Races in Manassas, Virginia (VA) Detailed Stats
Data:
Races - White alone (%)
Races - White alone (% change since 2000)
Races - Black alone (%)
Races - Black alone (% change since 2000)
Races - American Indian alone (%)
Races - American Indian alone (% change since 2000)
Races - Asian alone (%)
Races - Asian alone (% change since 2000)
Races - Hispanic (%)
Races - Hispanic (% change since 2000)
Races - Native Hawaiian and Other Pacific Islander alone (%)
Races - Native Hawaiian and Other Pacific Islander alone (% change since 2000)
Races - Two or more races(%)
Races - Two or more races(% change since 2000)
Races - Other race alone (%)
Races - Other race alone (% change since 2000)
Racial diversity
Place of birth - Born in state of residence (%)
Place of birth - Born in state of residence (%) - White
Place of birth - Born in state of residence (%) - Black or African American
Place of birth - Born in state of residence (%) - Asian
Place of birth - Born in state of residence (%) - Hispanic or Latino
Place of birth - Born in state of residence (%) - American Indian and Alaska Native
Place of birth - Born in state of residence (%) - Multirace
Place of birth - Born in state of residence (%) - Other Race
Place of birth - Born in other state (%)
Place of birth - Born in other state (%) - White
Place of birth - Born in other state (%) - Black or African American
Place of birth - Born in other state (%) - Asian
Place of birth - Born in other state (%) - Hispanic or Latino
Place of birth - Born in other state (%) - American Indian and Alaska Native
Place of birth - Born in other state (%) - Multirace
Place of birth - Born in other state (%) - Other Race
Place of birth - Native, outside of US (%)
Place of birth - Native, outside of US (%) - White
Place of birth - Native, outside of US (%) - Black or African American
Place of birth - Native, outside of US (%) - Asian
Place of birth - Native, outside of US (%) - Hispanic or Latino
Place of birth - Native, outside of US (%) - American Indian and Alaska Native
Place of birth - Native, outside of US (%) - Multirace
Place of birth - Native, outside of US (%) - Other Race
Place of birth - Foreign born (%)
Place of birth - Foreign born (%) - White
Place of birth - Foreign born (%) - Black or African American
Place of birth - Foreign born (%) - Asian
Place of birth - Foreign born (%) - Hispanic or Latino
Place of birth - Foreign born (%) - American Indian and Alaska Native
Place of birth - Foreign born (%) - Multirace
Place of birth - Foreign born (%) - Other Race
Residents speaking English at home (%)
Residents speaking English at home - Born in the United States (%)
Residents speaking English at home - Native, born elsewhere (%)
Residents speaking English at home - Foreign born (%)
Residents speaking Spanish at home (%)
Residents speaking Spanish at home - Born in the United States (%)
Residents speaking Spanish at home - Native, born elsewhere (%)
Residents speaking Spanish at home - Foreign born (%)
Residents speaking other language at home (%)
Residents speaking other language at home - Born in the United States (%)
Residents speaking other language at home - Native, born elsewhere (%)
Residents speaking other language at home - Foreign born (%)
Marital status - Never married (%)
Marital status - Now married (%)
Marital status - Separated (%)
Marital status - Widowed (%)
Marital status - Divorced (%)
Ancestries Reported - Arab (%)
Ancestries Reported - Czech (%)
Ancestries Reported - Danish (%)
Ancestries Reported - Dutch (%)
Ancestries Reported - English (%)
Ancestries Reported - French (%)
Ancestries Reported - French Canadian (%)
Ancestries Reported - German (%)
Ancestries Reported - Greek (%)
Ancestries Reported - Hungarian (%)
Ancestries Reported - Irish (%)
Ancestries Reported - Italian (%)
Ancestries Reported - Lithuanian (%)
Ancestries Reported - Norwegian (%)
Ancestries Reported - Polish (%)
Ancestries Reported - Portuguese (%)
Ancestries Reported - Russian (%)
Ancestries Reported - Scotch-Irish (%)
Ancestries Reported - Scottish (%)
Ancestries Reported - Slovak (%)
Ancestries Reported - Subsaharan African (%)
Ancestries Reported - Swedish (%)
Ancestries Reported - Swiss (%)
Ancestries Reported - Ukrainian (%)
Ancestries Reported - United States (%)
Ancestries Reported - Welsh (%)
Ancestries Reported - West Indian (%)
Ancestries Reported - Other (%)
Geographical mobility - Same house 1 year ago (%)
Geographical mobility - Same house 1 year ago (%) - White
Geographical mobility - Same house 1 year ago (%) - Black or African American
Geographical mobility - Same house 1 year ago (%) - Asian
Geographical mobility - Same house 1 year ago (%) - Hispanic or Latino
Geographical mobility - Same house 1 year ago (%) - American Indian and Alaska Native
Geographical mobility - Same house 1 year ago (%) - Multirace
Geographical mobility - Same house 1 year ago (%) - Other Race
Geographical mobility - Moved within same county (%)
Geographical mobility - Moved within same county (%) - White
Geographical mobility - Moved within same county (%) - Black or African American
Geographical mobility - Moved within same county (%) - Asian
Geographical mobility - Moved within same county (%) - Hispanic or Latino
Geographical mobility - Moved within same county (%) - American Indian and Alaska Native
Geographical mobility - Moved within same county (%) - Multirace
Geographical mobility - Moved within same county (%) - Other Race
Geographical mobility - Moved from different county within same state (%)
Geographical mobility - Moved from different county within same state (%) - White
Geographical mobility - Moved from different county within same state (%) - Black or African American
Geographical mobility - Moved from different county within same state (%) - Asian
Geographical mobility - Moved from different county within same state (%) - Hispanic or Latino
Geographical mobility - Moved from different county within same state (%) - American Indian and Alaska Native
Geographical mobility - Moved from different county within same state (%) - Multirace
Geographical mobility - Moved from different county within same state (%) - Other Race
Geographical mobility - Moved from different state (%)
Geographical mobility - Moved from different state (%) - White
Geographical mobility - Moved from different state (%) - Black or African American
Geographical mobility - Moved from different state (%) - Asian
Geographical mobility - Moved from different state (%) - Hispanic or Latino
Geographical mobility - Moved from different state (%) - American Indian and Alaska Native
Geographical mobility - Moved from different state (%) - Multirace
Geographical mobility - Moved from different state (%) - Other Race
Geographical mobility - Moved from abroad (%)
Geographical mobility - Moved from abroad (%) - White
Geographical mobility - Moved from abroad (%) - Black or African American
Geographical mobility - Moved from abroad (%) - Asian
Geographical mobility - Moved from abroad (%) - Hispanic or Latino
Geographical mobility - Moved from abroad (%) - American Indian and Alaska Native
Geographical mobility - Moved from abroad (%) - Multirace
Geographical mobility - Moved from abroad (%) - Other Race
Place of birth for the foreign-born population - Ireland (%)
Place of birth for the foreign-born population - Denmark (%)
Place of birth for the foreign-born population - Norway (%)
Place of birth for the foreign-born population - Sweden (%)
Place of birth for the foreign-born population - United Kingdom (%)
Place of birth for the foreign-born population - England (%)
Place of birth for the foreign-born population - Scotland (%)
Place of birth for the foreign-born population - Other Northern Europe (%)
Place of birth for the foreign-born population - Austria (%)
Place of birth for the foreign-born population - Belgium (%)
Place of birth for the foreign-born population - France (%)
Place of birth for the foreign-born population - Germany (%)
Place of birth for the foreign-born population - Netherlands (%)
Place of birth for the foreign-born population - Switzerland (%)
Place of birth for the foreign-born population - Other Western Europe (%)
Place of birth for the foreign-born population - Greece (%)
Place of birth for the foreign-born population - Italy (%)
Place of birth for the foreign-born population - Portugal (%)
Place of birth for the foreign-born population - Spain (%)
Place of birth for the foreign-born population - Other Southern Europe (%)
Place of birth for the foreign-born population - Albania (%)
Place of birth for the foreign-born population - Belarus (%)
Place of birth for the foreign-born population - Bosnia and Herzegovina (%)
Place of birth for the foreign-born population - Bulgaria (%)
Place of birth for the foreign-born population - Croatia (%)
Place of birth for the foreign-born population - Czechoslovakia (%)
Place of birth for the foreign-born population - Hungary (%)
Place of birth for the foreign-born population - Latvia (%)
Place of birth for the foreign-born population - Lithuania (%)
Place of birth for the foreign-born population - North Macedonia (Macedonia) (%)
Place of birth for the foreign-born population - Moldova (%)
Place of birth for the foreign-born population - Poland (%)
Place of birth for the foreign-born population - Romania (%)
Place of birth for the foreign-born population - Russia (%)
Place of birth for the foreign-born population - Serbia (%)
Place of birth for the foreign-born population - Ukraine (%)
Place of birth for the foreign-born population - Other Eastern Europe (%)
Place of birth for the foreign-born population - China (%)
Place of birth for the foreign-born population - Hong Kong (%)
Place of birth for the foreign-born population - Taiwan (%)
Place of birth for the foreign-born population - Japan (%)
Place of birth for the foreign-born population - Korea (%)
Place of birth for the foreign-born population - Other Eastern Asia (%)
Place of birth for the foreign-born population - Afghanistan (%)
Place of birth for the foreign-born population - Bangladesh (%)
Place of birth for the foreign-born population - India (%)
Place of birth for the foreign-born population - Iran (%)
Place of birth for the foreign-born population - Kazakhstan (%)
Place of birth for the foreign-born population - Nepal (%)
Place of birth for the foreign-born population - Pakistan (%)
Place of birth for the foreign-born population - Sri Lanka (%)
Place of birth for the foreign-born population - Uzbekistan (%)
Place of birth for the foreign-born population - Other South Central Asia (%)
Place of birth for the foreign-born population - Burma (%)
Place of birth for the foreign-born population - Cambodia (%)
Place of birth for the foreign-born population - Indonesia (%)
Place of birth for the foreign-born population - Laos (%)
Place of birth for the foreign-born population - Malaysia (%)
Place of birth for the foreign-born population - Philippines (%)
Place of birth for the foreign-born population - Singapore (%)
Place of birth for the foreign-born population - Thailand (%)
Place of birth for the foreign-born population - Vietnam (%)
Place of birth for the foreign-born population - Other South Eastern Asia (%)
Place of birth for the foreign-born population - Armenia (%)
Place of birth for the foreign-born population - Iraq (%)
Place of birth for the foreign-born population - Israel (%)
Place of birth for the foreign-born population - Jordan (%)
Place of birth for the foreign-born population - Kuwait (%)
Place of birth for the foreign-born population - Lebanon (%)
Place of birth for the foreign-born population - Saudi Arabia (%)
Place of birth for the foreign-born population - Syria (%)
Place of birth for the foreign-born population - Turkey (%)
Place of birth for the foreign-born population - Yemen (%)
Place of birth for the foreign-born population - Other Western Asia (%)
Place of birth for the foreign-born population - Eritrea (%)
Place of birth for the foreign-born population - Ethiopia (%)
Place of birth for the foreign-born population - Kenya (%)
Place of birth for the foreign-born population - Somalia (%)
Place of birth for the foreign-born population - Uganda (%)
Place of birth for the foreign-born population - Zimbabwe (%)
Place of birth for the foreign-born population - Other Eastern Africa (%)
Place of birth for the foreign-born population - Cameroon (%)
Place of birth for the foreign-born population - Congo (%)
Place of birth for the foreign-born population - Democratic Republic of Congo (Zaire) (%)
Place of birth for the foreign-born population - Other Middle Africa (%)
Place of birth for the foreign-born population - Egypt (%)
Place of birth for the foreign-born population - Morocco (%)
Place of birth for the foreign-born population - Sudan (%)
Place of birth for the foreign-born population - Other Northern Africa (%)
Place of birth for the foreign-born population - South Africa (%)
Place of birth for the foreign-born population - Other Southern Africa (%)
Place of birth for the foreign-born population - Cabo Verde (%)
Place of birth for the foreign-born population - Ghana (%)
Place of birth for the foreign-born population - Liberia (%)
Place of birth for the foreign-born population - Nigeria (%)
Place of birth for the foreign-born population - Senegal (%)
Place of birth for the foreign-born population - Sierra Leone (%)
Place of birth for the foreign-born population - Other Western Africa (%)
Place of birth for the foreign-born population - Australia (%)
Place of birth for the foreign-born population - New Zealand (%)
Place of birth for the foreign-born population - Fiji (%)
Place of birth for the foreign-born population - Micronesia (%)
Place of birth for the foreign-born population - Bahamas (%)
Place of birth for the foreign-born population - Barbados (%)
Place of birth for the foreign-born population - Cuba (%)
Place of birth for the foreign-born population - Dominica (%)
Place of birth for the foreign-born population - Dominican Republic (%)
Place of birth for the foreign-born population - Grenada (%)
Place of birth for the foreign-born population - Haiti (%)
Place of birth for the foreign-born population - Jamaica (%)
Place of birth for the foreign-born population - St. Vincent and the Grenadines (%)
Place of birth for the foreign-born population - Trinidad and Tobago (%)
Place of birth for the foreign-born population - West Indies (%)
Place of birth for the foreign-born population - Other Caribbean (%)
Place of birth for the foreign-born population - Belize (%)
Place of birth for the foreign-born population - Costa Rica (%)
Place of birth for the foreign-born population - El Salvador (%)
Place of birth for the foreign-born population - Guatemala (%)
Place of birth for the foreign-born population - Honduras (%)
Place of birth for the foreign-born population - Mexico (%)
Place of birth for the foreign-born population - Nicaragua (%)
Place of birth for the foreign-born population - Panama (%)
Place of birth for the foreign-born population - Other Central America (%)
Place of birth for the foreign-born population - Argentina (%)
Place of birth for the foreign-born population - Bolivia (%)
Place of birth for the foreign-born population - Brazil (%)
Place of birth for the foreign-born population - Chile (%)
Place of birth for the foreign-born population - Colombia (%)
Place of birth for the foreign-born population - Ecuador (%)
Place of birth for the foreign-born population - Guyana (%)
Place of birth for the foreign-born population - Peru (%)
Place of birth for the foreign-born population - Uruguay (%)
Place of birth for the foreign-born population - Venezuela (%)
Place of birth for the foreign-born population - Other South America (%)
Place of birth for the foreign-born population - Canada (%)
Place of birth for the foreign-born population - Other Northern America (%)
Place of birth for the foreign-born population - Other (%)
Latest news about races in Manassas, VA collected exclusively by city-data.com from local newspapers, TV, and radio stations
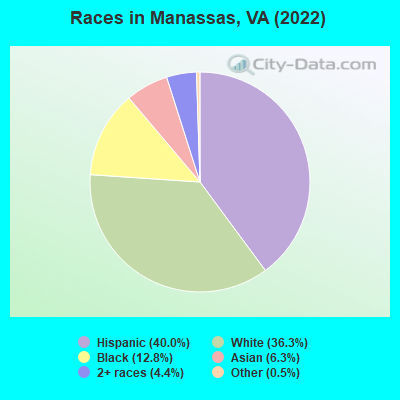
According to 2022 data, the most numerous races in Manassas, VA are White alone (15,654 residents), Black alone (5,542 residents), and Hispanic (17,269 residents). 57.3% of Manassas residents speak English at home. 29.5% of Manassas, VA residents are foreign-born (21.5% born in Latin America, 4.8% born in Asia), which is 59.3% greater than the foreign-born rate of 12.0% across the entire state of Virginia.
Race distribution in Manassas
2000 2022
4,965,637 70.2% White alone 1,376,378 19.4% Black alone 329,540 4.7% Hispanic 259,277 3.7% Asian alone 114,022 1.6% Two or more races 18,596 0.3% American Indian alone 11,685 0.2% Other race alone 3,380 0.05% Native Hawaiian and Other
5,095,130 58.7% White alone 1,594,785 18.4% Black alone 905,750 10.4% Hispanic 602,881 6.9% Asian alone 406,047 4.7% Two or more races 60,419 0.7% Other race alone 11,738 0.1% American Indian alone 6,869 0.08% Native Hawaiian and Other
Income and house value in Manassas Median household income in 2022 $109,564 White non-Hispanic householders$92,002 Black householders$151,760 Asian householders$94,052 Some other race householders$116,057 Two or more races householders$117,429 Hispanic or Latino race householdersMedian 2022 house value $461,949 White Non-Hispanic householders$356,319 Black or African American householders$349,124 American Indian or Alaska Native householders $465,115 Asian householders$330,128 Some other race householders$267,959 Two or more races householders$341,353 Hispanic or Latino householders
Median age by race in Manassas
39.9 Median age for White residents38.5 41.1 37.2 Median age for Black or African American residents34.4 38.8 39.0 Median age for American Indian / Alaska Native residents39.6 57.7 42.7 Median age for Asian residents35.5 45.4 -611,955,419.9 Median age for Native Hawaiian / Pacific Islander residents-541,531,822.5 -714,150,046.8 23.1 Median age for Other race residents24.4 26.0 26.5 Median age for Two or more races residents26.8 24.2 44.0 Median age for White alone residents41.3 45.5 27.5 Median age for Hispanic or Latino residents28.5 26.7
Owner/renter occupied households by race in Manassas
House owners and renters - White residents 5,735 76.0% Owner occupied1,810 24.0% Renter occupiedHouse owners and renters - Black or African American residents 1,748 75.4% Owner occupied570 24.6% Renter occupiedHouse owners and renters - American Indian / Alaska Native residents 9 14.9% Owner occupied54 85.1% Renter occupiedHouse owners and renters - Asian residents 626 76.9% Owner occupied188 23.1% Renter occupiedHouse owners and renters - Native Hawaiian / Pacific Islander residents 11 100.0% Renter occupiedHouse owners and renters - Other race residents 696 59.6% Owner occupied472 40.4% Renter occupiedHouse owners and renters - Two or more races residents 1,598 69.4% Owner occupied703 30.6% Renter occupiedHouse owners and renters - White alone residents 5,018 74.7% Owner occupied1,698 25.3% Renter occupiedHouse owners and renters - Hispanic or Latino residents 2,616 68.8% Owner occupied1,184 31.2% Renter occupied
Language usage in Manassas
English speakers - Total 57.3% of residents of Manassas speak English at home.
32.9% of residents speak Spanish at home 5,862 44.7% Speak English very well7,265 55.3% Speak English less than very well9.1% of residents speak other language at home 2,218 61.2% Speak English very well1,409 38.8% Speak English less than very well
English speakers - Born in the United States 88.7% of residents of Manassas speak English at home.
10.6% of residents speak Spanish at home 996 79.4% Speak English very well259 20.6% Speak English less than very well1.3% of residents speak other language at home 126 84.0% Speak English very well24 16.0% Speak English less than very well
English speakers - Native, born elsewhere 41.4% of residents of Manassas speak English at home.
39.2% of residents speak Spanish at home 270 60.9% Speak English very well173 39.1% Speak English less than very well21.5% of residents speak other language at home 210 86.4% Speak English very well33 13.6% Speak English less than very well
English speakers - Foreign-born 6.9% of residents of Manassas speak English at home.
69.9% of residents speak Spanish at home 1,773 20.7% Speak English very well6,796 79.3% Speak English less than very well23.0% of residents speak other language at home 1,499 53.3% Speak English very well1,314 46.7% Speak English less than very well
White (Caucasian) - Speak only English Native:
90.5% (14,609)Foreign-born:
7.5% (145)
White (Caucasian) - Speak another language Native:
8.6% (1,382)Foreign-born:
91.9% (1,769)
Black or African American - Speak only English Native:
96.3% (4,338)Foreign-born:
19.7% (183)
Black or African American - Speak another language Native:
3.5% (158)Foreign-born:
75.8% (705)
American Indian / Alaska Native - Speak another language Native:
66.7% (103)Foreign-born:
100.0% (113)
Asian - Speak only English Native:
61.6% (511)Foreign-born:
13.6% (248)
Asian - Speak another language Native:
29.3% (243)Foreign-born:
86.3% (1,571)
Other race - Speak only English Native:
19.7% (308)Foreign-born:
4.2% (121)
Other race - Speak another language Native:
80.4% (1,258)Foreign-born:
94.2% (2,710)
Two or more races - Speak only English Native:
48.5% (2,067)Foreign-born:
1.5% (85)
Two or more races - Speak another language Native:
58.5% (2,493)Foreign-born:
97.2% (5,506)
White alone - Speak only English Native:
98.3% (13,974)Foreign-born:
21.6% (139)
White alone - Speak another language Native:
1.9% (271)Foreign-born:
77.0% (496)
Hispanic or Latino - Speak only English Native:
30.7% (1,997)Foreign-born:
3.1% (274)
Hispanic or Latino - Speak another language Native:
68.8% (4,472)Foreign-born:
94.9% (8,511)
Foreign-born residents in Manassas 12,714 residents are foreign born (21.5% Latin America , 4.8% Asia ).
This city:
29.5%Virginia:
12.6%
Marital status for residents in Manassas Marital status - White (Caucasian) population 15 years and over
Males 35.2% Never married52.4% Now married1.0% Separated1.8% Widowed9.6% DivorcedFemales 28.1% Never married49.9% Now married3.2% Separated7.2% Widowed11.7% DivorcedWomen who gave birth in the past 12 months Now married:
65.7% (214)Unmarried:
34.3% (112)
Women who did not give birth in the past 12 months Now married:
44.9% (1,803)Unmarried:
55.1% (2,215)
Marital status - Black or African American population 15 years and over
Males 39.2% Never married50.6% Now married0.0% Separated0.8% Widowed9.4% DivorcedFemales 38.1% Never married38.4% Now married7.2% Separated3.9% Widowed12.4% DivorcedWomen who did not give birth in the past 12 months Now married:
45.5% (598)Unmarried:
54.5% (714)
Marital status - American Indian / Alaska Native population 15 years and over
Males 42.9% Never married40.5% Now married11.7% Separated0.0% Widowed4.9% DivorcedFemales 40.3% Never married38.9% Now married0.0% Separated0.0% Widowed20.8% DivorcedWomen who did not give birth in the past 12 months Now married:
0.0% (0)Unmarried:
100.0% (31)
Marital status - Asian population 15 years and over
Males 33.1% Never married64.3% Now married0.0% Separated0.0% Widowed2.6% DivorcedFemales 20.9% Never married55.3% Now married0.8% Separated17.8% Widowed5.2% DivorcedWomen who gave birth in the past 12 months Now married:
100.0% (21)Unmarried:
0.0% (0)
Women who did not give birth in the past 12 months Now married:
65.7% (467)Unmarried:
34.3% (244)
Marital status - Other race population 15 years and over
Males 47.1% Never married44.4% Now married0.9% Separated2.6% Widowed5.0% DivorcedFemales 47.8% Never married34.9% Now married1.0% Separated8.8% Widowed7.6% DivorcedWomen who gave birth in the past 12 months Now married:
45.9% (89)Unmarried:
54.1% (105)
Women who did not give birth in the past 12 months Now married:
36.6% (427)Unmarried:
63.4% (739)
Marital status - Two or more races population 15 years and over
Males 50.0% Never married45.3% Now married1.7% Separated0.0% Widowed2.9% DivorcedFemales 45.5% Never married45.5% Now married0.4% Separated1.6% Widowed7.0% DivorcedWomen who gave birth in the past 12 months Now married:
100.0% (139)Unmarried:
0.0% (0)
Women who did not give birth in the past 12 months Now married:
34.0% (943)Unmarried:
66.0% (1,833)
Marital status - White alone, not Hispanic / Latino population 15 years and over
Males 32.3% Never married54.4% Now married0.6% Separated2.3% Widowed10.3% DivorcedFemales 25.4% Never married51.3% Now married2.4% Separated7.6% Widowed13.3% DivorcedWomen who gave birth in the past 12 months Now married:
88.2% (199)Unmarried:
11.8% (27)
Women who did not give birth in the past 12 months Now married:
42.8% (1,300)Unmarried:
57.2% (1,736)
Marital status - Hispanic or Latino population 15 years and over
Males 47.8% Never married44.7% Now married2.1% Separated0.5% Widowed4.9% DivorcedFemales 39.6% Never married44.6% Now married3.3% Separated5.3% Widowed7.2% DivorcedWomen who gave birth in the past 12 months Now married:
51.8% (209)Unmarried:
48.2% (195)
Women who did not give birth in the past 12 months Now married:
43.4% (1,810)Unmarried:
56.6% (2,365)
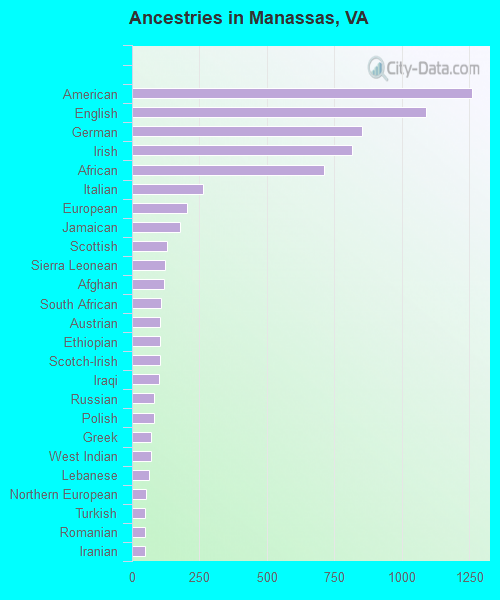
Ancestries in Manassas
1,261 5.4% American1,090 4.7% English852 3.6% German815 3.5% Irish711 3.0% African264 1.1% Italian204 0.9% European179 0.8% Jamaican129 0.6% Scottish121 0.5% Sierra Leonean117 0.5% Afghan106 0.5% South African104 0.4% Austrian102 0.4% Ethiopian102 0.4% Scotch-Irish99 0.4% Iraqi81 0.3% Russian81 0.3% Polish72 0.3% Greek72 0.3% West Indian64 0.3% Lebanese53 0.2% Northern European50 0.2% Turkish50 0.2% Romanian47 0.2% Iranian47 0.2% British46 0.2% French Canadian44 0.2% Nigerian43 0.2% Czech42 0.2% Dutch39 0.2% German Russian35 0.1% Moroccan33 0.1% Eastern European32 0.1% Bulgarian30 0.1% Norwegian21 0.09% Welsh20 0.09% Danish19 0.08% Portuguese19 0.08% Swiss16 0.07% Finnish15 0.06% Czechoslovakian13 0.06% Israeli10 0.04% French9 0.04% Scandinavian9 0.04% Basque8 0.03% Ukrainian8 0.03% Jordanian6 0.03% Albanian6 0.03% Slovak6 0.03% Swedish6 0.03% Arab5 0.02% Hungarian4 0.02% Trinidadian and Tobagonian
Geographical mobility in Manassas Same house 1 year ago 15,815 82.7% White (Caucasian)4,994 87.6% Black or African American138 53.6% American Indian / Alaska Native2,445 89.8% Asian13 95.3% Native Hawaiian / Pacific Islander4,648 90.8% Other race8,309 77.7% Two or more races13,446 87.2% White alone, not Hispanic / Latino13,088 77.1% Hispanic or LatinoMoved within same county 703 3.7% White / Caucasian385 6.7% Black or African American89 1.7% Other race437 4.1% Two or more races334 2.2% White alone, not Hispanic / Latino767 4.5% Hispanic or LatinoMoved within same state 2,701 14.1% White / Caucasian275 4.8% Black or African American107 41.7% American Indian / Alaska Native185 6.8% Asian255 5.0% Other race1,400 13.1% Two or more races1,572 10.2% White alone, not Hispanic / Latino3,395 20.0% Hispanic or LatinoMoved from different state 150 0.8% White / Caucasian45 0.8% Black or African American8 0.3% Asian559 5.2% Two or more races147 1.0% White alone, not Hispanic / Latino465 2.7% Hispanic or LatinoMoved from abroad 75 0.4% White12 0.2% Black or African American147 5.4% Asian18 0.3% Other race113 1.1% Two or more races166 1.0% Hispanic or Latino
Children Nativity (place of birth) in Manassas
Children under 6 years - Living with two parents Both parents native 1,469 100.0% Native0 0.0% Foreign-bornBoth parents foreign-born 967 99.2% Native8 0.8% Foreign-bornOne native, one foreign-born parent 284 100.0% NativeChildren under 6 years - Living with one parent Native parent 613 100.0% NativeForeign-born parent 327 100.0% NativeChildren 6 to 17 years - Living with two parents Both parents native 2,069 100.0% NativeBoth parents foreign-born 1,513 67.1% Native743 32.9% Foreign-bornOne native, one foreign-born parent 460 100.0% NativeChildren 6 to 17 years - Living with one parent Native parent 187 100.0% NativeForeign-born parent 1,873 58.2% Native1,343 41.8% Foreign-born
Grandparents responsible for own grandchildren in Manassas
Grandparents (30 to 59 years) White / Caucasian 40 31.2% Responsible for grandchildren89 68.8% Not responsible for grandchildrenBlack or African American 19 51.0% Responsible for grandchildren19 49.0% Not responsible for grandchildrenOther race 14 17.3% Responsible for grandchildren68 82.7% Not responsible for grandchildrenTwo or more races 36 12.9% Responsible for grandchildren246 87.1% Not responsible for grandchildrenWhite alone, not Hispanic / Latino 42 64.8% Responsible for grandchildren23 35.2% Not responsible for grandchildrenHispanic or Latino 107 28.3% Responsible for grandchildren272 71.7% Not responsible for grandchildrenGrandparents (60 years and over) White / Caucasian 69 31.5% Responsible for grandchildren151 68.5% Not responsible for grandchildrenBlack or African American 84 100.0% Not responsible for grandchildrenOther race 46 100.0% Not responsible for grandchildrenTwo or more races 42 100.0% Not responsible for grandchildrenWhite alone, not Hispanic / Latino 80 31.9% Responsible for grandchildren172 68.1% Not responsible for grandchildrenHispanic or Latino 58 100.0% Not responsible for grandchildren