Races in Newburgh, New York (NY) Detailed Stats
Data:
Races - White alone (%)
Races - White alone (% change since 2000)
Races - Black alone (%)
Races - Black alone (% change since 2000)
Races - American Indian alone (%)
Races - American Indian alone (% change since 2000)
Races - Asian alone (%)
Races - Asian alone (% change since 2000)
Races - Hispanic (%)
Races - Hispanic (% change since 2000)
Races - Native Hawaiian and Other Pacific Islander alone (%)
Races - Native Hawaiian and Other Pacific Islander alone (% change since 2000)
Races - Two or more races(%)
Races - Two or more races(% change since 2000)
Races - Other race alone (%)
Races - Other race alone (% change since 2000)
Racial diversity
Place of birth - Born in state of residence (%)
Place of birth - Born in state of residence (%) - White
Place of birth - Born in state of residence (%) - Black or African American
Place of birth - Born in state of residence (%) - Asian
Place of birth - Born in state of residence (%) - Hispanic or Latino
Place of birth - Born in state of residence (%) - American Indian and Alaska Native
Place of birth - Born in state of residence (%) - Multirace
Place of birth - Born in state of residence (%) - Other Race
Place of birth - Born in other state (%)
Place of birth - Born in other state (%) - White
Place of birth - Born in other state (%) - Black or African American
Place of birth - Born in other state (%) - Asian
Place of birth - Born in other state (%) - Hispanic or Latino
Place of birth - Born in other state (%) - American Indian and Alaska Native
Place of birth - Born in other state (%) - Multirace
Place of birth - Born in other state (%) - Other Race
Place of birth - Native, outside of US (%)
Place of birth - Native, outside of US (%) - White
Place of birth - Native, outside of US (%) - Black or African American
Place of birth - Native, outside of US (%) - Asian
Place of birth - Native, outside of US (%) - Hispanic or Latino
Place of birth - Native, outside of US (%) - American Indian and Alaska Native
Place of birth - Native, outside of US (%) - Multirace
Place of birth - Native, outside of US (%) - Other Race
Place of birth - Foreign born (%)
Place of birth - Foreign born (%) - White
Place of birth - Foreign born (%) - Black or African American
Place of birth - Foreign born (%) - Asian
Place of birth - Foreign born (%) - Hispanic or Latino
Place of birth - Foreign born (%) - American Indian and Alaska Native
Place of birth - Foreign born (%) - Multirace
Place of birth - Foreign born (%) - Other Race
Residents speaking English at home (%)
Residents speaking English at home - Born in the United States (%)
Residents speaking English at home - Native, born elsewhere (%)
Residents speaking English at home - Foreign born (%)
Residents speaking Spanish at home (%)
Residents speaking Spanish at home - Born in the United States (%)
Residents speaking Spanish at home - Native, born elsewhere (%)
Residents speaking Spanish at home - Foreign born (%)
Residents speaking other language at home (%)
Residents speaking other language at home - Born in the United States (%)
Residents speaking other language at home - Native, born elsewhere (%)
Residents speaking other language at home - Foreign born (%)
Marital status - Never married (%)
Marital status - Now married (%)
Marital status - Separated (%)
Marital status - Widowed (%)
Marital status - Divorced (%)
Ancestries Reported - Arab (%)
Ancestries Reported - Czech (%)
Ancestries Reported - Danish (%)
Ancestries Reported - Dutch (%)
Ancestries Reported - English (%)
Ancestries Reported - French (%)
Ancestries Reported - French Canadian (%)
Ancestries Reported - German (%)
Ancestries Reported - Greek (%)
Ancestries Reported - Hungarian (%)
Ancestries Reported - Irish (%)
Ancestries Reported - Italian (%)
Ancestries Reported - Lithuanian (%)
Ancestries Reported - Norwegian (%)
Ancestries Reported - Polish (%)
Ancestries Reported - Portuguese (%)
Ancestries Reported - Russian (%)
Ancestries Reported - Scotch-Irish (%)
Ancestries Reported - Scottish (%)
Ancestries Reported - Slovak (%)
Ancestries Reported - Subsaharan African (%)
Ancestries Reported - Swedish (%)
Ancestries Reported - Swiss (%)
Ancestries Reported - Ukrainian (%)
Ancestries Reported - United States (%)
Ancestries Reported - Welsh (%)
Ancestries Reported - West Indian (%)
Ancestries Reported - Other (%)
Geographical mobility - Same house 1 year ago (%)
Geographical mobility - Same house 1 year ago (%) - White
Geographical mobility - Same house 1 year ago (%) - Black or African American
Geographical mobility - Same house 1 year ago (%) - Asian
Geographical mobility - Same house 1 year ago (%) - Hispanic or Latino
Geographical mobility - Same house 1 year ago (%) - American Indian and Alaska Native
Geographical mobility - Same house 1 year ago (%) - Multirace
Geographical mobility - Same house 1 year ago (%) - Other Race
Geographical mobility - Moved within same county (%)
Geographical mobility - Moved within same county (%) - White
Geographical mobility - Moved within same county (%) - Black or African American
Geographical mobility - Moved within same county (%) - Asian
Geographical mobility - Moved within same county (%) - Hispanic or Latino
Geographical mobility - Moved within same county (%) - American Indian and Alaska Native
Geographical mobility - Moved within same county (%) - Multirace
Geographical mobility - Moved within same county (%) - Other Race
Geographical mobility - Moved from different county within same state (%)
Geographical mobility - Moved from different county within same state (%) - White
Geographical mobility - Moved from different county within same state (%) - Black or African American
Geographical mobility - Moved from different county within same state (%) - Asian
Geographical mobility - Moved from different county within same state (%) - Hispanic or Latino
Geographical mobility - Moved from different county within same state (%) - American Indian and Alaska Native
Geographical mobility - Moved from different county within same state (%) - Multirace
Geographical mobility - Moved from different county within same state (%) - Other Race
Geographical mobility - Moved from different state (%)
Geographical mobility - Moved from different state (%) - White
Geographical mobility - Moved from different state (%) - Black or African American
Geographical mobility - Moved from different state (%) - Asian
Geographical mobility - Moved from different state (%) - Hispanic or Latino
Geographical mobility - Moved from different state (%) - American Indian and Alaska Native
Geographical mobility - Moved from different state (%) - Multirace
Geographical mobility - Moved from different state (%) - Other Race
Geographical mobility - Moved from abroad (%)
Geographical mobility - Moved from abroad (%) - White
Geographical mobility - Moved from abroad (%) - Black or African American
Geographical mobility - Moved from abroad (%) - Asian
Geographical mobility - Moved from abroad (%) - Hispanic or Latino
Geographical mobility - Moved from abroad (%) - American Indian and Alaska Native
Geographical mobility - Moved from abroad (%) - Multirace
Geographical mobility - Moved from abroad (%) - Other Race
Place of birth for the foreign-born population - Ireland (%)
Place of birth for the foreign-born population - Denmark (%)
Place of birth for the foreign-born population - Norway (%)
Place of birth for the foreign-born population - Sweden (%)
Place of birth for the foreign-born population - United Kingdom (%)
Place of birth for the foreign-born population - England (%)
Place of birth for the foreign-born population - Scotland (%)
Place of birth for the foreign-born population - Other Northern Europe (%)
Place of birth for the foreign-born population - Austria (%)
Place of birth for the foreign-born population - Belgium (%)
Place of birth for the foreign-born population - France (%)
Place of birth for the foreign-born population - Germany (%)
Place of birth for the foreign-born population - Netherlands (%)
Place of birth for the foreign-born population - Switzerland (%)
Place of birth for the foreign-born population - Other Western Europe (%)
Place of birth for the foreign-born population - Greece (%)
Place of birth for the foreign-born population - Italy (%)
Place of birth for the foreign-born population - Portugal (%)
Place of birth for the foreign-born population - Spain (%)
Place of birth for the foreign-born population - Other Southern Europe (%)
Place of birth for the foreign-born population - Albania (%)
Place of birth for the foreign-born population - Belarus (%)
Place of birth for the foreign-born population - Bosnia and Herzegovina (%)
Place of birth for the foreign-born population - Bulgaria (%)
Place of birth for the foreign-born population - Croatia (%)
Place of birth for the foreign-born population - Czechoslovakia (%)
Place of birth for the foreign-born population - Hungary (%)
Place of birth for the foreign-born population - Latvia (%)
Place of birth for the foreign-born population - Lithuania (%)
Place of birth for the foreign-born population - North Macedonia (Macedonia) (%)
Place of birth for the foreign-born population - Moldova (%)
Place of birth for the foreign-born population - Poland (%)
Place of birth for the foreign-born population - Romania (%)
Place of birth for the foreign-born population - Russia (%)
Place of birth for the foreign-born population - Serbia (%)
Place of birth for the foreign-born population - Ukraine (%)
Place of birth for the foreign-born population - Other Eastern Europe (%)
Place of birth for the foreign-born population - China (%)
Place of birth for the foreign-born population - Hong Kong (%)
Place of birth for the foreign-born population - Taiwan (%)
Place of birth for the foreign-born population - Japan (%)
Place of birth for the foreign-born population - Korea (%)
Place of birth for the foreign-born population - Other Eastern Asia (%)
Place of birth for the foreign-born population - Afghanistan (%)
Place of birth for the foreign-born population - Bangladesh (%)
Place of birth for the foreign-born population - India (%)
Place of birth for the foreign-born population - Iran (%)
Place of birth for the foreign-born population - Kazakhstan (%)
Place of birth for the foreign-born population - Nepal (%)
Place of birth for the foreign-born population - Pakistan (%)
Place of birth for the foreign-born population - Sri Lanka (%)
Place of birth for the foreign-born population - Uzbekistan (%)
Place of birth for the foreign-born population - Other South Central Asia (%)
Place of birth for the foreign-born population - Burma (%)
Place of birth for the foreign-born population - Cambodia (%)
Place of birth for the foreign-born population - Indonesia (%)
Place of birth for the foreign-born population - Laos (%)
Place of birth for the foreign-born population - Malaysia (%)
Place of birth for the foreign-born population - Philippines (%)
Place of birth for the foreign-born population - Singapore (%)
Place of birth for the foreign-born population - Thailand (%)
Place of birth for the foreign-born population - Vietnam (%)
Place of birth for the foreign-born population - Other South Eastern Asia (%)
Place of birth for the foreign-born population - Armenia (%)
Place of birth for the foreign-born population - Iraq (%)
Place of birth for the foreign-born population - Israel (%)
Place of birth for the foreign-born population - Jordan (%)
Place of birth for the foreign-born population - Kuwait (%)
Place of birth for the foreign-born population - Lebanon (%)
Place of birth for the foreign-born population - Saudi Arabia (%)
Place of birth for the foreign-born population - Syria (%)
Place of birth for the foreign-born population - Turkey (%)
Place of birth for the foreign-born population - Yemen (%)
Place of birth for the foreign-born population - Other Western Asia (%)
Place of birth for the foreign-born population - Eritrea (%)
Place of birth for the foreign-born population - Ethiopia (%)
Place of birth for the foreign-born population - Kenya (%)
Place of birth for the foreign-born population - Somalia (%)
Place of birth for the foreign-born population - Uganda (%)
Place of birth for the foreign-born population - Zimbabwe (%)
Place of birth for the foreign-born population - Other Eastern Africa (%)
Place of birth for the foreign-born population - Cameroon (%)
Place of birth for the foreign-born population - Congo (%)
Place of birth for the foreign-born population - Democratic Republic of Congo (Zaire) (%)
Place of birth for the foreign-born population - Other Middle Africa (%)
Place of birth for the foreign-born population - Egypt (%)
Place of birth for the foreign-born population - Morocco (%)
Place of birth for the foreign-born population - Sudan (%)
Place of birth for the foreign-born population - Other Northern Africa (%)
Place of birth for the foreign-born population - South Africa (%)
Place of birth for the foreign-born population - Other Southern Africa (%)
Place of birth for the foreign-born population - Cabo Verde (%)
Place of birth for the foreign-born population - Ghana (%)
Place of birth for the foreign-born population - Liberia (%)
Place of birth for the foreign-born population - Nigeria (%)
Place of birth for the foreign-born population - Senegal (%)
Place of birth for the foreign-born population - Sierra Leone (%)
Place of birth for the foreign-born population - Other Western Africa (%)
Place of birth for the foreign-born population - Australia (%)
Place of birth for the foreign-born population - New Zealand (%)
Place of birth for the foreign-born population - Fiji (%)
Place of birth for the foreign-born population - Micronesia (%)
Place of birth for the foreign-born population - Bahamas (%)
Place of birth for the foreign-born population - Barbados (%)
Place of birth for the foreign-born population - Cuba (%)
Place of birth for the foreign-born population - Dominica (%)
Place of birth for the foreign-born population - Dominican Republic (%)
Place of birth for the foreign-born population - Grenada (%)
Place of birth for the foreign-born population - Haiti (%)
Place of birth for the foreign-born population - Jamaica (%)
Place of birth for the foreign-born population - St. Vincent and the Grenadines (%)
Place of birth for the foreign-born population - Trinidad and Tobago (%)
Place of birth for the foreign-born population - West Indies (%)
Place of birth for the foreign-born population - Other Caribbean (%)
Place of birth for the foreign-born population - Belize (%)
Place of birth for the foreign-born population - Costa Rica (%)
Place of birth for the foreign-born population - El Salvador (%)
Place of birth for the foreign-born population - Guatemala (%)
Place of birth for the foreign-born population - Honduras (%)
Place of birth for the foreign-born population - Mexico (%)
Place of birth for the foreign-born population - Nicaragua (%)
Place of birth for the foreign-born population - Panama (%)
Place of birth for the foreign-born population - Other Central America (%)
Place of birth for the foreign-born population - Argentina (%)
Place of birth for the foreign-born population - Bolivia (%)
Place of birth for the foreign-born population - Brazil (%)
Place of birth for the foreign-born population - Chile (%)
Place of birth for the foreign-born population - Colombia (%)
Place of birth for the foreign-born population - Ecuador (%)
Place of birth for the foreign-born population - Guyana (%)
Place of birth for the foreign-born population - Peru (%)
Place of birth for the foreign-born population - Uruguay (%)
Place of birth for the foreign-born population - Venezuela (%)
Place of birth for the foreign-born population - Other South America (%)
Place of birth for the foreign-born population - Canada (%)
Place of birth for the foreign-born population - Other Northern America (%)
Place of birth for the foreign-born population - Other (%)
Latest news about races in Newburgh, NY collected exclusively by city-data.com from local newspapers, TV, and radio stations
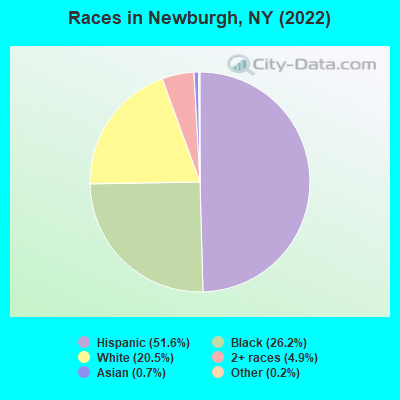
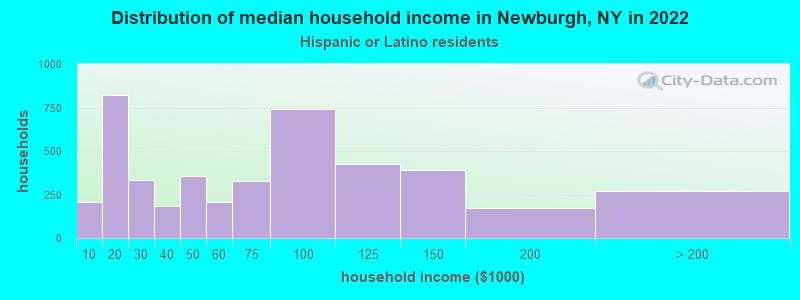
According to 2022 data, the most numerous races in Newburgh, NY are White alone (5,965 residents), Hispanic (15,014 residents), and Black alone (7,635 residents). 55.7% of Newburgh residents speak English at home. 19.5% of Newburgh, NY residents are foreign-born (18.3% born in Latin America), which is 12.7% less than the foreign-born rate of 22.0% across the entire state of New York.
Race distribution in Newburgh
2000 2022
11,760,981 62.0% White alone 2,867,583 15.1% Hispanic 2,812,623 14.8% Black alone 1,035,926 5.5% Asian alone 366,116 1.9% Two or more races 75,499 0.4% Other race alone 52,499 0.3% American Indian alone 5,230 0.03% Native Hawaiian and Other
10,408,933 52.9% White alone 3,867,299 19.7% Hispanic 2,633,840 13.4% Black alone 1,776,286 9.0% Asian alone 732,670 3.7% Two or more races 216,110 1.1% Other race alone 35,082 0.2% American Indian alone 6,931 0.04% Native Hawaiian and Other
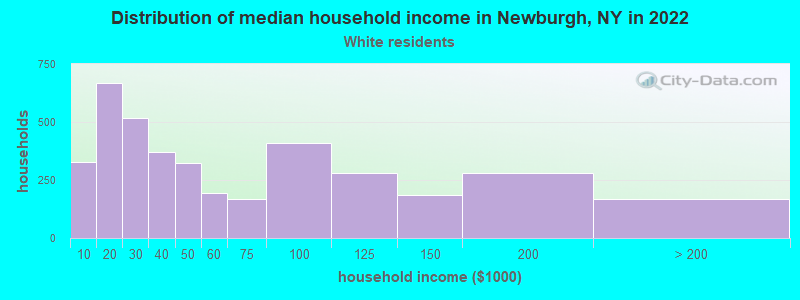
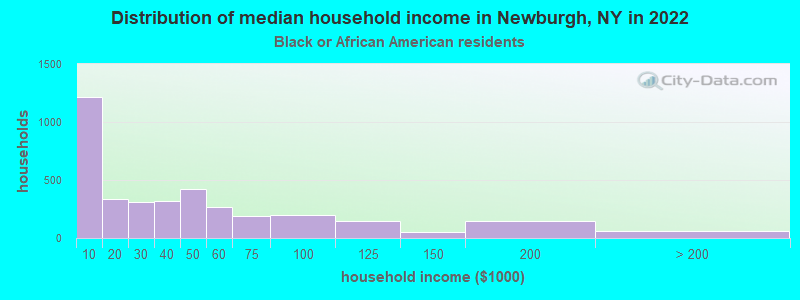
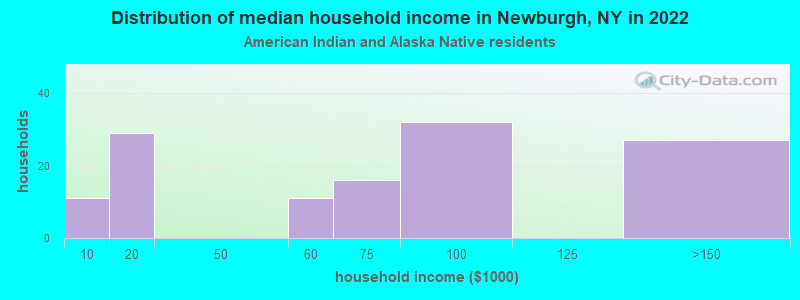
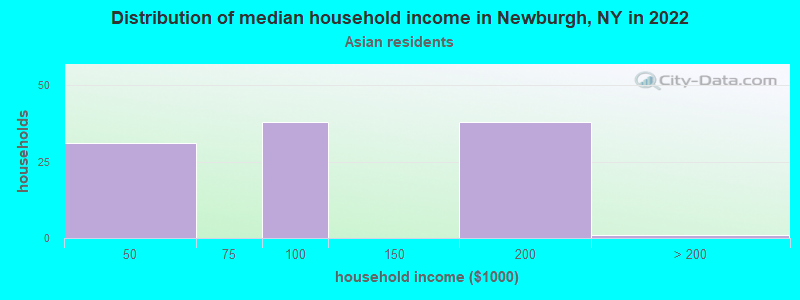
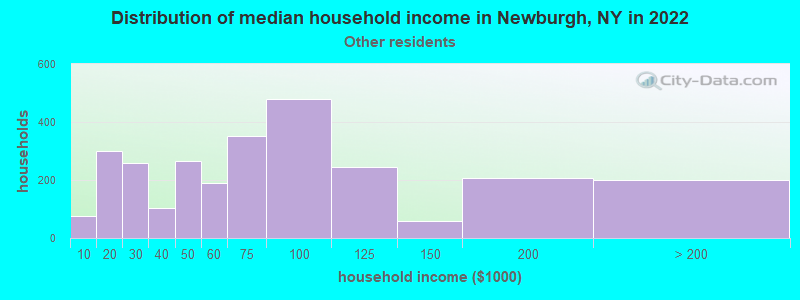
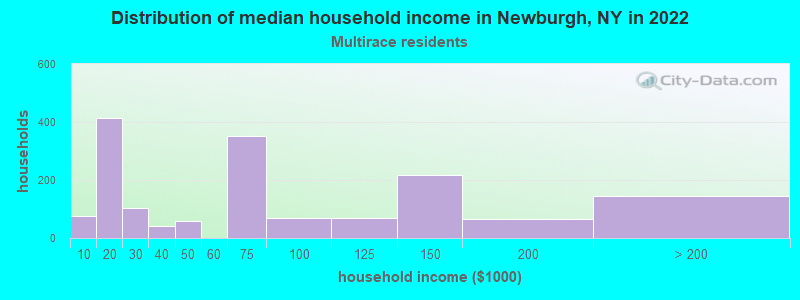
Income and house value in Newburgh Median household income in 2022 $34,207 White non-Hispanic householders$33,875 Black householders$70,548 American Indian and Alaska Native householders$78,804 Asian householders$72,601 Some other race householders$71,430 Two or more races householders$71,542 Hispanic or Latino race householdersMedian 2022 house value $208,990 White Non-Hispanic householders$209,666 Black or African American householders$253,355 American Indian or Alaska Native householders$788,218 Native Hawaiian and other Pacific Islander householders$206,062 Some other race householders$182,641 Two or more races householders$202,009 Hispanic or Latino householders
Median age by race in Newburgh
40.7 Median age for White residents38.1 43.3 32.4 Median age for Black or African American residents31.5 34.1 45.3 Median age for American Indian / Alaska Native residents46.9 40.5 46.3 Median age for Asian residents45.2 47.4 -487,992,314.6 Median age for Native Hawaiian / Pacific Islander residents-477,502,295.2 -497,387,669.3 28.3 Median age for Other race residents26.6 29.9 33.8 Median age for Two or more races residents25.2 35.8 48.5 Median age for White alone residents46.5 50.1 29.9 Median age for Hispanic or Latino residents28.2 30.7
Owner/renter occupied households by race in Newburgh
House owners and renters - White residents 1,731 43.9% Owner occupied2,215 56.1% Renter occupiedHouse owners and renters - Black or African American residents 734 23.5% Owner occupied2,395 76.5% Renter occupiedHouse owners and renters - American Indian / Alaska Native residents 52 40.5% Owner occupied77 59.5% Renter occupiedHouse owners and renters - Asian residents 62 53.5% Owner occupied54 46.5% Renter occupiedHouse owners and renters - Other race residents 895 33.8% Owner occupied1,749 66.2% Renter occupiedHouse owners and renters - Two or more races residents 453 28.2% Owner occupied1,153 71.8% Renter occupiedHouse owners and renters - White alone residents 1,373 44.4% Owner occupied1,719 55.6% Renter occupiedHouse owners and renters - Hispanic or Latino residents 1,533 35.8% Owner occupied2,753 64.2% Renter occupied
Language usage in Newburgh
English speakers - Total 55.7% of residents of Newburgh speak English at home.
43.2% of residents speak Spanish at home 6,518 54.9% Speak English very well5,352 45.1% Speak English less than very well2.9% of residents speak other language at home 659 82.6% Speak English very well139 17.4% Speak English less than very well
English speakers - Born in the United States 93.9% of residents of Newburgh speak English at home.
5.0% of residents speak Spanish at home 152 100.0% Speak English very well0.4% of residents speak other language at home 11 100.0% Speak English very well
English speakers - Native, born elsewhere 10.5% of residents of Newburgh speak English at home.
89.0% of residents speak Spanish at home 536 40.1% Speak English very well801 59.9% Speak English less than very well1.5% of residents speak other language at home 19 86.4% Speak English very well3 13.6% Speak English less than very well
English speakers - Foreign-born 8.0% of residents of Newburgh speak English at home.
95.6% of residents speak Spanish at home 1,778 29.7% Speak English very well4,199 70.3% Speak English less than very well4.9% of residents speak other language at home 265 86.6% Speak English very well41 13.4% Speak English less than very well
White (Caucasian) - Speak only English Native:
73.7% (5,198)Foreign-born:
20.2% (196)
White (Caucasian) - Speak another language Native:
27.7% (1,951)Foreign-born:
72.1% (701)
Black or African American - Speak only English Native:
95.7% (7,125)Foreign-born:
30.9% (78)
Black or African American - Speak another language Native:
1.7% (124)Foreign-born:
84.0% (211)
American Indian / Alaska Native - Speak only English Native:
6.0% (8)Foreign-born:
4.5% (10)
American Indian / Alaska Native - Speak another language Native:
100.0% (131)Foreign-born:
99.6% (221)
Asian - Speak only English Native:
100.0% (102)Foreign-born:
46.6% (53)
Other race - Speak only English Native:
31.3% (1,833)Foreign-born:
2.2% (96)
Other race - Speak another language Native:
65.6% (3,840)Foreign-born:
95.7% (4,136)
Two or more races - Speak only English Native:
63.7% (1,891)Foreign-born:
9.9% (89)
Two or more races - Speak another language Native:
37.5% (1,113)Foreign-born:
88.4% (795)
White alone - Speak only English Native:
87.5% (4,889)Foreign-born:
65.4% (153)
White alone - Speak another language Native:
9.6% (536)Foreign-born:
38.6% (90)
Hispanic or Latino - Speak only English Native:
31.2% (2,566)Foreign-born:
3.4% (202)
Hispanic or Latino - Speak another language Native:
69.3% (5,694)Foreign-born:
97.1% (5,821)
Foreign-born residents in Newburgh 5,678 residents are foreign born (18.3% Latin America ).
This city:
19.5%New York:
22.6%
Marital status for residents in Newburgh Marital status - White (Caucasian) population 15 years and over
Males 50.9% Never married33.9% Now married1.1% Separated1.2% Widowed12.8% DivorcedFemales 44.2% Never married23.6% Now married3.4% Separated11.8% Widowed17.1% DivorcedWomen who gave birth in the past 12 months Now married:
25.0% (9)Unmarried:
75.0% (26)
Women who did not give birth in the past 12 months Now married:
30.7% (731)Unmarried:
69.3% (1,652)
Marital status - Black or African American population 15 years and over
Males 50.8% Never married33.4% Now married2.2% Separated6.2% Widowed7.4% DivorcedFemales 57.5% Never married20.6% Now married2.9% Separated6.3% Widowed12.7% DivorcedWomen who gave birth in the past 12 months Now married:
33.9% (60)Unmarried:
66.1% (117)
Women who did not give birth in the past 12 months Now married:
19.3% (406)Unmarried:
80.7% (1,694)
Marital status - American Indian / Alaska Native population 15 years and over
Males 36.6% Never married32.5% Now married25.2% Separated5.7% Widowed0.0% DivorcedFemales 26.0% Never married59.8% Now married6.3% Separated0.0% Widowed7.9% DivorcedWomen who did not give birth in the past 12 months Now married:
63.9% (109)Unmarried:
36.1% (62)
Marital status - Asian population 15 years and over
Males 1.4% Never married47.2% Now married51.4% Separated0.0% Widowed0.0% DivorcedFemales 43.6% Never married29.5% Now married26.9% Separated0.0% Widowed0.0% DivorcedWomen who did not give birth in the past 12 months Now married:
43.3% (29)Unmarried:
56.7% (38)
Marital status - Other race population 15 years and over
Males 46.7% Never married41.5% Now married6.4% Separated0.7% Widowed4.8% DivorcedFemales 37.6% Never married39.3% Now married1.8% Separated11.7% Widowed9.7% DivorcedWomen who gave birth in the past 12 months Now married:
50.2% (140)Unmarried:
49.8% (139)
Women who did not give birth in the past 12 months Now married:
40.6% (1,004)Unmarried:
59.4% (1,469)
Marital status - Two or more races population 15 years and over
Males 65.1% Never married29.8% Now married5.1% Separated0.0% Widowed0.0% DivorcedFemales 49.4% Never married21.1% Now married0.6% Separated14.0% Widowed14.8% DivorcedWomen who gave birth in the past 12 months Now married:
8.2% (12)Unmarried:
91.8% (140)
Women who did not give birth in the past 12 months Now married:
17.3% (240)Unmarried:
82.7% (1,151)
Marital status - White alone, not Hispanic / Latino population 15 years and over
Males 52.2% Never married28.8% Now married1.5% Separated1.8% Widowed15.6% DivorcedFemales 42.6% Never married19.4% Now married3.8% Separated16.0% Widowed18.2% DivorcedWomen who did not give birth in the past 12 months Now married:
25.2% (409)Unmarried:
74.8% (1,215)
Marital status - Hispanic or Latino population 15 years and over
Males 48.4% Never married42.1% Now married4.8% Separated0.4% Widowed4.3% DivorcedFemales 41.0% Never married35.8% Now married1.7% Separated10.1% Widowed11.4% DivorcedWomen who gave birth in the past 12 months Now married:
43.4% (140)Unmarried:
56.6% (182)
Women who did not give birth in the past 12 months Now married:
37.0% (1,437)Unmarried:
63.0% (2,443)
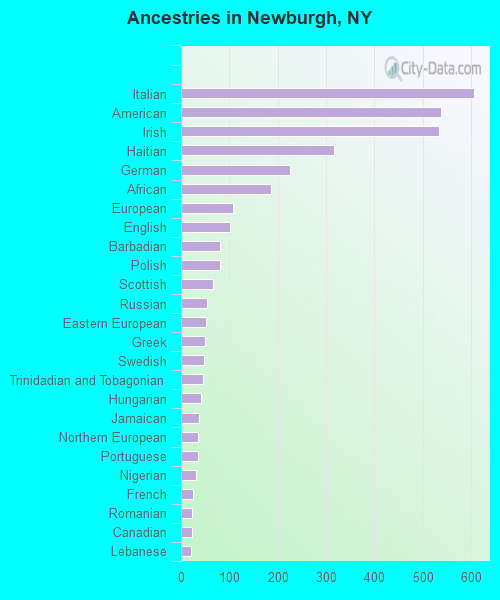
Ancestries in Newburgh
607 3.7% Italian538 3.3% American533 3.2% Irish316 1.9% Haitian225 1.4% German186 1.1% African108 0.7% European101 0.6% English81 0.5% Barbadian80 0.5% Polish66 0.4% Scottish53 0.3% Russian51 0.3% Eastern European49 0.3% Greek47 0.3% Swedish45 0.3% Trinidadian and Tobagonian41 0.2% Hungarian37 0.2% Jamaican35 0.2% Northern European35 0.2% Portuguese32 0.2% Nigerian25 0.2% French23 0.1% Romanian22 0.1% Canadian21 0.1% Lebanese20 0.1% Dutch17 0.1% French Canadian17 0.1% Slovak15 0.09% Scotch-Irish15 0.09% Ghanaian11 0.07% Australian
Geographical mobility in Newburgh Same house 1 year ago 7,750 90.4% White (Caucasian)7,071 86.1% Black or African American335 100.0% American Indian / Alaska Native147 72.0% Asian9,073 85.2% Other race3,613 88.7% Two or more races5,470 91.8% White alone, not Hispanic / Latino13,205 88.7% Hispanic or LatinoMoved within same county 350 4.1% White / Caucasian292 3.6% Black or African American13 100.0% Native Hawaiian / Pacific Islander467 4.4% Other race129 3.2% Two or more races250 4.2% White alone, not Hispanic / Latino628 4.2% Hispanic or LatinoMoved within same state 129 1.5% White / Caucasian799 9.7% Black or African American6 1.9% American Indian / Alaska Native65 31.8% Asian641 6.0% Other race349 8.6% Two or more races99 1.7% White alone, not Hispanic / Latino599 4.0% Hispanic or LatinoMoved from different state 202 2.3% White / Caucasian73 0.9% Black or African American72 1.2% White alone, not Hispanic / Latino406 2.7% Hispanic or LatinoMoved from abroad 19 0.2% White48 0.6% Black or African American70 0.7% Other race21 0.4% White alone, not Hispanic / Latino61 0.4% Hispanic or Latino
Children Nativity (place of birth) in Newburgh
Children under 6 years - Living with two parents Both parents native 203 100.0% NativeBoth parents foreign-born 298 100.0% NativeOne native, one foreign-born parent 120 100.0% NativeChildren under 6 years - Living with one parent Native parent 989 100.0% NativeForeign-born parent 414 100.0% NativeChildren 6 to 17 years - Living with two parents Both parents native 723 98.6% Native10 1.4% Foreign-bornBoth parents foreign-born 487 100.0% NativeOne native, one foreign-born parent 271 77.7% Native78 22.3% Foreign-bornChildren 6 to 17 years - Living with one parent Native parent 2,682 100.0% NativeForeign-born parent 1,146 55.8% Native909 44.2% Foreign-born
Grandparents responsible for own grandchildren in Newburgh
Grandparents (30 to 59 years) Other race 317 100.0% Not responsible for grandchildrenTwo or more races 27 100.0% Not responsible for grandchildrenHispanic or Latino 205 100.0% Not responsible for grandchildren
Grandparents (60 years and over) Other race 76 100.0% Not responsible for grandchildrenTwo or more races 62 100.0% Not responsible for grandchildrenHispanic or Latino 213 100.0% Not responsible for grandchildren