Races in North Haven, Connecticut (CT) Detailed Stats
Data:
Races - White alone (%)
Races - White alone (% change since 2000)
Races - Black alone (%)
Races - Black alone (% change since 2000)
Races - American Indian alone (%)
Races - American Indian alone (% change since 2000)
Races - Asian alone (%)
Races - Asian alone (% change since 2000)
Races - Hispanic (%)
Races - Hispanic (% change since 2000)
Races - Native Hawaiian and Other Pacific Islander alone (%)
Races - Native Hawaiian and Other Pacific Islander alone (% change since 2000)
Races - Two or more races(%)
Races - Two or more races(% change since 2000)
Races - Other race alone (%)
Races - Other race alone (% change since 2000)
Racial diversity
Place of birth - Born in state of residence (%)
Place of birth - Born in state of residence (%) - White
Place of birth - Born in state of residence (%) - Black or African American
Place of birth - Born in state of residence (%) - Asian
Place of birth - Born in state of residence (%) - Hispanic or Latino
Place of birth - Born in state of residence (%) - American Indian and Alaska Native
Place of birth - Born in state of residence (%) - Multirace
Place of birth - Born in state of residence (%) - Other Race
Place of birth - Born in other state (%)
Place of birth - Born in other state (%) - White
Place of birth - Born in other state (%) - Black or African American
Place of birth - Born in other state (%) - Asian
Place of birth - Born in other state (%) - Hispanic or Latino
Place of birth - Born in other state (%) - American Indian and Alaska Native
Place of birth - Born in other state (%) - Multirace
Place of birth - Born in other state (%) - Other Race
Place of birth - Native, outside of US (%)
Place of birth - Native, outside of US (%) - White
Place of birth - Native, outside of US (%) - Black or African American
Place of birth - Native, outside of US (%) - Asian
Place of birth - Native, outside of US (%) - Hispanic or Latino
Place of birth - Native, outside of US (%) - American Indian and Alaska Native
Place of birth - Native, outside of US (%) - Multirace
Place of birth - Native, outside of US (%) - Other Race
Place of birth - Foreign born (%)
Place of birth - Foreign born (%) - White
Place of birth - Foreign born (%) - Black or African American
Place of birth - Foreign born (%) - Asian
Place of birth - Foreign born (%) - Hispanic or Latino
Place of birth - Foreign born (%) - American Indian and Alaska Native
Place of birth - Foreign born (%) - Multirace
Place of birth - Foreign born (%) - Other Race
Residents speaking English at home (%)
Residents speaking English at home - Born in the United States (%)
Residents speaking English at home - Native, born elsewhere (%)
Residents speaking English at home - Foreign born (%)
Residents speaking Spanish at home (%)
Residents speaking Spanish at home - Born in the United States (%)
Residents speaking Spanish at home - Native, born elsewhere (%)
Residents speaking Spanish at home - Foreign born (%)
Residents speaking other language at home (%)
Residents speaking other language at home - Born in the United States (%)
Residents speaking other language at home - Native, born elsewhere (%)
Residents speaking other language at home - Foreign born (%)
Marital status - Never married (%)
Marital status - Now married (%)
Marital status - Separated (%)
Marital status - Widowed (%)
Marital status - Divorced (%)
Ancestries Reported - Arab (%)
Ancestries Reported - Czech (%)
Ancestries Reported - Danish (%)
Ancestries Reported - Dutch (%)
Ancestries Reported - English (%)
Ancestries Reported - French (%)
Ancestries Reported - French Canadian (%)
Ancestries Reported - German (%)
Ancestries Reported - Greek (%)
Ancestries Reported - Hungarian (%)
Ancestries Reported - Irish (%)
Ancestries Reported - Italian (%)
Ancestries Reported - Lithuanian (%)
Ancestries Reported - Norwegian (%)
Ancestries Reported - Polish (%)
Ancestries Reported - Portuguese (%)
Ancestries Reported - Russian (%)
Ancestries Reported - Scotch-Irish (%)
Ancestries Reported - Scottish (%)
Ancestries Reported - Slovak (%)
Ancestries Reported - Subsaharan African (%)
Ancestries Reported - Swedish (%)
Ancestries Reported - Swiss (%)
Ancestries Reported - Ukrainian (%)
Ancestries Reported - United States (%)
Ancestries Reported - Welsh (%)
Ancestries Reported - West Indian (%)
Ancestries Reported - Other (%)
Geographical mobility - Same house 1 year ago (%)
Geographical mobility - Same house 1 year ago (%) - White
Geographical mobility - Same house 1 year ago (%) - Black or African American
Geographical mobility - Same house 1 year ago (%) - Asian
Geographical mobility - Same house 1 year ago (%) - Hispanic or Latino
Geographical mobility - Same house 1 year ago (%) - American Indian and Alaska Native
Geographical mobility - Same house 1 year ago (%) - Multirace
Geographical mobility - Same house 1 year ago (%) - Other Race
Geographical mobility - Moved within same county (%)
Geographical mobility - Moved within same county (%) - White
Geographical mobility - Moved within same county (%) - Black or African American
Geographical mobility - Moved within same county (%) - Asian
Geographical mobility - Moved within same county (%) - Hispanic or Latino
Geographical mobility - Moved within same county (%) - American Indian and Alaska Native
Geographical mobility - Moved within same county (%) - Multirace
Geographical mobility - Moved within same county (%) - Other Race
Geographical mobility - Moved from different county within same state (%)
Geographical mobility - Moved from different county within same state (%) - White
Geographical mobility - Moved from different county within same state (%) - Black or African American
Geographical mobility - Moved from different county within same state (%) - Asian
Geographical mobility - Moved from different county within same state (%) - Hispanic or Latino
Geographical mobility - Moved from different county within same state (%) - American Indian and Alaska Native
Geographical mobility - Moved from different county within same state (%) - Multirace
Geographical mobility - Moved from different county within same state (%) - Other Race
Geographical mobility - Moved from different state (%)
Geographical mobility - Moved from different state (%) - White
Geographical mobility - Moved from different state (%) - Black or African American
Geographical mobility - Moved from different state (%) - Asian
Geographical mobility - Moved from different state (%) - Hispanic or Latino
Geographical mobility - Moved from different state (%) - American Indian and Alaska Native
Geographical mobility - Moved from different state (%) - Multirace
Geographical mobility - Moved from different state (%) - Other Race
Geographical mobility - Moved from abroad (%)
Geographical mobility - Moved from abroad (%) - White
Geographical mobility - Moved from abroad (%) - Black or African American
Geographical mobility - Moved from abroad (%) - Asian
Geographical mobility - Moved from abroad (%) - Hispanic or Latino
Geographical mobility - Moved from abroad (%) - American Indian and Alaska Native
Geographical mobility - Moved from abroad (%) - Multirace
Geographical mobility - Moved from abroad (%) - Other Race
Place of birth for the foreign-born population - Ireland (%)
Place of birth for the foreign-born population - Denmark (%)
Place of birth for the foreign-born population - Norway (%)
Place of birth for the foreign-born population - Sweden (%)
Place of birth for the foreign-born population - United Kingdom (%)
Place of birth for the foreign-born population - England (%)
Place of birth for the foreign-born population - Scotland (%)
Place of birth for the foreign-born population - Other Northern Europe (%)
Place of birth for the foreign-born population - Austria (%)
Place of birth for the foreign-born population - Belgium (%)
Place of birth for the foreign-born population - France (%)
Place of birth for the foreign-born population - Germany (%)
Place of birth for the foreign-born population - Netherlands (%)
Place of birth for the foreign-born population - Switzerland (%)
Place of birth for the foreign-born population - Other Western Europe (%)
Place of birth for the foreign-born population - Greece (%)
Place of birth for the foreign-born population - Italy (%)
Place of birth for the foreign-born population - Portugal (%)
Place of birth for the foreign-born population - Spain (%)
Place of birth for the foreign-born population - Other Southern Europe (%)
Place of birth for the foreign-born population - Albania (%)
Place of birth for the foreign-born population - Belarus (%)
Place of birth for the foreign-born population - Bosnia and Herzegovina (%)
Place of birth for the foreign-born population - Bulgaria (%)
Place of birth for the foreign-born population - Croatia (%)
Place of birth for the foreign-born population - Czechoslovakia (%)
Place of birth for the foreign-born population - Hungary (%)
Place of birth for the foreign-born population - Latvia (%)
Place of birth for the foreign-born population - Lithuania (%)
Place of birth for the foreign-born population - North Macedonia (Macedonia) (%)
Place of birth for the foreign-born population - Moldova (%)
Place of birth for the foreign-born population - Poland (%)
Place of birth for the foreign-born population - Romania (%)
Place of birth for the foreign-born population - Russia (%)
Place of birth for the foreign-born population - Serbia (%)
Place of birth for the foreign-born population - Ukraine (%)
Place of birth for the foreign-born population - Other Eastern Europe (%)
Place of birth for the foreign-born population - China (%)
Place of birth for the foreign-born population - Hong Kong (%)
Place of birth for the foreign-born population - Taiwan (%)
Place of birth for the foreign-born population - Japan (%)
Place of birth for the foreign-born population - Korea (%)
Place of birth for the foreign-born population - Other Eastern Asia (%)
Place of birth for the foreign-born population - Afghanistan (%)
Place of birth for the foreign-born population - Bangladesh (%)
Place of birth for the foreign-born population - India (%)
Place of birth for the foreign-born population - Iran (%)
Place of birth for the foreign-born population - Kazakhstan (%)
Place of birth for the foreign-born population - Nepal (%)
Place of birth for the foreign-born population - Pakistan (%)
Place of birth for the foreign-born population - Sri Lanka (%)
Place of birth for the foreign-born population - Uzbekistan (%)
Place of birth for the foreign-born population - Other South Central Asia (%)
Place of birth for the foreign-born population - Burma (%)
Place of birth for the foreign-born population - Cambodia (%)
Place of birth for the foreign-born population - Indonesia (%)
Place of birth for the foreign-born population - Laos (%)
Place of birth for the foreign-born population - Malaysia (%)
Place of birth for the foreign-born population - Philippines (%)
Place of birth for the foreign-born population - Singapore (%)
Place of birth for the foreign-born population - Thailand (%)
Place of birth for the foreign-born population - Vietnam (%)
Place of birth for the foreign-born population - Other South Eastern Asia (%)
Place of birth for the foreign-born population - Armenia (%)
Place of birth for the foreign-born population - Iraq (%)
Place of birth for the foreign-born population - Israel (%)
Place of birth for the foreign-born population - Jordan (%)
Place of birth for the foreign-born population - Kuwait (%)
Place of birth for the foreign-born population - Lebanon (%)
Place of birth for the foreign-born population - Saudi Arabia (%)
Place of birth for the foreign-born population - Syria (%)
Place of birth for the foreign-born population - Turkey (%)
Place of birth for the foreign-born population - Yemen (%)
Place of birth for the foreign-born population - Other Western Asia (%)
Place of birth for the foreign-born population - Eritrea (%)
Place of birth for the foreign-born population - Ethiopia (%)
Place of birth for the foreign-born population - Kenya (%)
Place of birth for the foreign-born population - Somalia (%)
Place of birth for the foreign-born population - Uganda (%)
Place of birth for the foreign-born population - Zimbabwe (%)
Place of birth for the foreign-born population - Other Eastern Africa (%)
Place of birth for the foreign-born population - Cameroon (%)
Place of birth for the foreign-born population - Congo (%)
Place of birth for the foreign-born population - Democratic Republic of Congo (Zaire) (%)
Place of birth for the foreign-born population - Other Middle Africa (%)
Place of birth for the foreign-born population - Egypt (%)
Place of birth for the foreign-born population - Morocco (%)
Place of birth for the foreign-born population - Sudan (%)
Place of birth for the foreign-born population - Other Northern Africa (%)
Place of birth for the foreign-born population - South Africa (%)
Place of birth for the foreign-born population - Other Southern Africa (%)
Place of birth for the foreign-born population - Cabo Verde (%)
Place of birth for the foreign-born population - Ghana (%)
Place of birth for the foreign-born population - Liberia (%)
Place of birth for the foreign-born population - Nigeria (%)
Place of birth for the foreign-born population - Senegal (%)
Place of birth for the foreign-born population - Sierra Leone (%)
Place of birth for the foreign-born population - Other Western Africa (%)
Place of birth for the foreign-born population - Australia (%)
Place of birth for the foreign-born population - New Zealand (%)
Place of birth for the foreign-born population - Fiji (%)
Place of birth for the foreign-born population - Micronesia (%)
Place of birth for the foreign-born population - Bahamas (%)
Place of birth for the foreign-born population - Barbados (%)
Place of birth for the foreign-born population - Cuba (%)
Place of birth for the foreign-born population - Dominica (%)
Place of birth for the foreign-born population - Dominican Republic (%)
Place of birth for the foreign-born population - Grenada (%)
Place of birth for the foreign-born population - Haiti (%)
Place of birth for the foreign-born population - Jamaica (%)
Place of birth for the foreign-born population - St. Vincent and the Grenadines (%)
Place of birth for the foreign-born population - Trinidad and Tobago (%)
Place of birth for the foreign-born population - West Indies (%)
Place of birth for the foreign-born population - Other Caribbean (%)
Place of birth for the foreign-born population - Belize (%)
Place of birth for the foreign-born population - Costa Rica (%)
Place of birth for the foreign-born population - El Salvador (%)
Place of birth for the foreign-born population - Guatemala (%)
Place of birth for the foreign-born population - Honduras (%)
Place of birth for the foreign-born population - Mexico (%)
Place of birth for the foreign-born population - Nicaragua (%)
Place of birth for the foreign-born population - Panama (%)
Place of birth for the foreign-born population - Other Central America (%)
Place of birth for the foreign-born population - Argentina (%)
Place of birth for the foreign-born population - Bolivia (%)
Place of birth for the foreign-born population - Brazil (%)
Place of birth for the foreign-born population - Chile (%)
Place of birth for the foreign-born population - Colombia (%)
Place of birth for the foreign-born population - Ecuador (%)
Place of birth for the foreign-born population - Guyana (%)
Place of birth for the foreign-born population - Peru (%)
Place of birth for the foreign-born population - Uruguay (%)
Place of birth for the foreign-born population - Venezuela (%)
Place of birth for the foreign-born population - Other South America (%)
Place of birth for the foreign-born population - Canada (%)
Place of birth for the foreign-born population - Other Northern America (%)
Place of birth for the foreign-born population - Other (%)
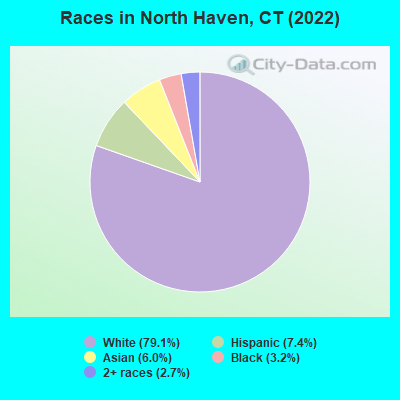
According to 2022 data, the most numerous races in North Haven, CT are White alone (19,207 residents), Hispanic (1,799 residents), and Black alone (789 residents). 85.8% of North Haven residents speak English at home. 10.2% of North Haven, CT residents are foreign-born (5.1% born in Asia, 3.1% born in Europe, 1.2% born in Latin America), which is 47.3% less than the foreign-born rate of 15.0% across the entire state of Connecticut.
Race distribution in North Haven
2000 2022
2,638,845 77.5% White alone 320,323 9.4% Hispanic 295,571 8.7% Black alone 81,564 2.4% Asian alone 52,896 1.6% Two or more races 8,141 0.2% Other race alone 7,267 0.2% American Indian alone 958 0.03% Native Hawaiian and Other
2,246,913 62.0% White alone 658,978 18.2% Hispanic 353,973 9.8% Black alone 172,929 4.8% Asian alone 159,631 4.4% Two or more races 29,761 0.8% Other race alone 3,428 0.09% American Indian alone 592 0.02% Native Hawaiian and Other
Income and house value in North Haven Median household income in 2022 $120,907 White non-Hispanic householders$76,312 Black householders$99,342 Asian householders$139,484 Some other race householders$164,986 Two or more races householders$129,558 Hispanic or Latino race householdersMedian 2022 house value $370,545 White Non-Hispanic householders$379,452 Black or African American householders $403,685 Asian householders$266,776 Some other race householders$317,107 Two or more races householders$312,550 Hispanic or Latino householders
Median age by race in North Haven
48.1 Median age for White residents46.3 49.8 37.3 Median age for Black or African American residents37.1 37.7 -742,173,111.6 Median age for American Indian / Alaska Native residents-701,030,927.1 -704,477,611.2 52.7 Median age for Asian residents51.6 54.6 -641,269,840.6 Median age for Native Hawaiian / Pacific Islander residents-414,239,481.8 -691,588,784.4 29.2 Median age for Other race residents12.0 30.3 34.6 Median age for Two or more races residents30.2 43.6 47.8 Median age for White alone residents45.8 49.3 31.0 Median age for Hispanic or Latino residents29.7 31.4
Owner/renter occupied households by race in North Haven
House owners and renters - White residents 6,603 84.1% Owner occupied1,246 15.9% Renter occupiedHouse owners and renters - Black or African American residents 268 75.7% Owner occupied86 24.3% Renter occupiedHouse owners and renters - Asian residents 538 90.6% Owner occupied56 9.4% Renter occupiedHouse owners and renters - Other race residents 240 67.1% Owner occupied118 32.9% Renter occupiedHouse owners and renters - Two or more races residents 229 59.6% Owner occupied155 40.4% Renter occupiedHouse owners and renters - White alone residents 6,563 83.2% Owner occupied1,323 16.8% Renter occupiedHouse owners and renters - Hispanic or Latino residents 412 69.2% Owner occupied184 30.8% Renter occupied
Language usage in North Haven
English speakers - Total 85.8% of residents of North Haven speak English at home.
4.4% of residents speak Spanish at home 703 69.1% Speak English very well314 30.9% Speak English less than very well9.2% of residents speak other language at home 961 44.6% Speak English very well1,196 55.4% Speak English less than very well
English speakers - Born in the United States 91.8% of residents of North Haven speak English at home.
4.5% of residents speak Spanish at home 183 100.0% Speak English very well3.3% of residents speak other language at home 133 100.0% Speak English very well
English speakers - Native, born elsewhere 66.8% of residents of North Haven speak English at home.
37.5% of residents speak Spanish at home 120 68.6% Speak English very well55 31.4% Speak English less than very well
English speakers - Foreign-born 22.1% of residents of North Haven speak English at home.
13.1% of residents speak Spanish at home 73 22.5% Speak English very well251 77.5% Speak English less than very well62.6% of residents speak other language at home 499 32.3% Speak English very well1,048 67.7% Speak English less than very well
White (Caucasian) - Speak only English Native:
97.8% (17,379)Foreign-born:
29.8% (195)
White (Caucasian) - Speak another language Native:
3.1% (545)Foreign-born:
70.0% (459)
Black or African American - Speak only English Native:
96.8% (681)Foreign-born:
42.2% (14)
Black or African American - Speak another language Native:
2.6% (18)Foreign-born:
51.9% (17)
Asian - Speak only English Native:
62.6% (163)Foreign-born:
19.7% (243)
Asian - Speak another language Native:
37.8% (98)Foreign-born:
80.0% (985)
Other race - Speak only English Native:
52.4% (329)Foreign-born:
3.4% (7)
Other race - Speak another language Native:
49.8% (313)Foreign-born:
97.2% (206)
Two or more races - Speak only English Native:
76.6% (745)Foreign-born:
17.5% (46)
Two or more races - Speak another language Native:
20.9% (203)Foreign-born:
77.4% (202)
White alone - Speak only English Native:
97.1% (17,342)Foreign-born:
27.9% (202)
White alone - Speak another language Native:
2.9% (521)Foreign-born:
72.0% (522)
Hispanic or Latino - Speak another language Native:
51.0% (661)Foreign-born:
100.0% (338)
Foreign-born residents in North Haven 2,473 residents are foreign born (5.1% Asia , 3.1% Europe , 1.2% Latin America ).
This city:
10.2%Connecticut:
15.0%
Marital status for residents in North Haven Marital status - White (Caucasian) population 15 years and over
Males 28.9% Never married61.8% Now married0.6% Separated2.4% Widowed6.4% DivorcedFemales 23.8% Never married52.3% Now married0.5% Separated12.2% Widowed11.2% DivorcedWomen who gave birth in the past 12 months Now married:
80.6% (149)Unmarried:
19.4% (36)
Women who did not give birth in the past 12 months Now married:
50.2% (1,799)Unmarried:
49.8% (1,787)
Marital status - Black or African American population 15 years and over
Males 61.1% Never married38.9% Now married0.0% Separated0.0% Widowed0.0% DivorcedFemales 33.7% Never married39.9% Now married0.0% Separated0.0% Widowed26.5% DivorcedWomen who did not give birth in the past 12 months Now married:
20.3% (25)Unmarried:
79.7% (100)
Marital status - Asian population 15 years and over
Males 27.8% Never married70.7% Now married0.0% Separated0.0% Widowed1.6% DivorcedFemales 23.4% Never married65.1% Now married1.8% Separated4.3% Widowed5.4% DivorcedWomen who gave birth in the past 12 months Now married:
100.0% (15)Unmarried:
0.0% (0)
Women who did not give birth in the past 12 months Now married:
57.1% (153)Unmarried:
42.9% (115)
Marital status - Other race population 15 years and over
Males 9.9% Never married82.4% Now married0.0% Separated0.0% Widowed7.6% DivorcedFemales 28.4% Never married71.6% Now married0.0% Separated0.0% Widowed0.0% DivorcedWomen who did not give birth in the past 12 months Now married:
50.8% (115)Unmarried:
49.2% (112)
Marital status - Two or more races population 15 years and over
Males 49.6% Never married35.2% Now married1.4% Separated0.0% Widowed13.8% DivorcedFemales 18.8% Never married55.5% Now married0.0% Separated0.0% Widowed25.6% DivorcedWomen who gave birth in the past 12 months Now married:
100.0% (14)Unmarried:
0.0% (0)
Women who did not give birth in the past 12 months Now married:
55.1% (124)Unmarried:
44.9% (101)
Marital status - White alone, not Hispanic / Latino population 15 years and over
Males 28.8% Never married61.7% Now married0.6% Separated2.3% Widowed6.6% DivorcedFemales 23.6% Never married52.4% Now married0.5% Separated12.1% Widowed11.4% DivorcedWomen who gave birth in the past 12 months Now married:
80.6% (157)Unmarried:
19.4% (38)
Women who did not give birth in the past 12 months Now married:
50.7% (1,881)Unmarried:
49.3% (1,829)
Marital status - Hispanic or Latino population 15 years and over
Males 31.3% Never married56.2% Now married0.0% Separated2.4% Widowed10.0% DivorcedFemales 28.3% Never married61.5% Now married0.0% Separated4.3% Widowed5.9% DivorcedWomen who did not give birth in the past 12 months Now married:
44.5% (149)Unmarried:
55.5% (186)
Ancestries in North Haven
4,707 39.4% Italian1,438 12.0% Irish618 5.2% American308 2.6% German268 2.2% Polish255 2.1% English246 2.1% Albanian156 1.3% European95 0.8% French71 0.6% Russian57 0.5% French Canadian51 0.4% Swedish51 0.4% Ukrainian42 0.4% Greek40 0.3% Turkish35 0.3% Portuguese20 0.2% Armenian17 0.1% Canadian17 0.1% Finnish16 0.1% African16 0.1% Hungarian14 0.1% British West Indian13 0.1% Scotch-Irish13 0.1% Czech12 0.1% Dutch7 0.06% Moroccan6 0.05% Celtic6 0.05% British6 0.05% Lithuanian5 0.04% Northern European2 0.02% Scandinavian2 0.02% Sudanese1 0.01% Cape Verdean
Children Nativity (place of birth) in North Haven
Children under 6 years - Living with two parents Both parents native 665 100.0% NativeBoth parents foreign-born 91 100.0% NativeOne native, one foreign-born parent 84 100.0% NativeChildren under 6 years - Living with one parent Native parent 97 100.0% NativeChildren 6 to 17 years - Living with two parents Both parents native 2,378 99.7% Native8 0.3% Foreign-bornBoth parents foreign-born 417 88.1% Native56 11.9% Foreign-bornOne native, one foreign-born parent 253 100.0% NativeChildren 6 to 17 years - Living with one parent Native parent 609 100.0% NativeForeign-born parent 31 50.8% Native30 49.2% Foreign-born
Grandparents responsible for own grandchildren in North Haven
Grandparents (30 to 59 years) White / Caucasian 9 50.3% Responsible for grandchildren9 49.7% Not responsible for grandchildrenWhite alone, not Hispanic / Latino 10 46.1% Responsible for grandchildren12 53.9% Not responsible for grandchildrenGrandparents (60 years and over) White / Caucasian 61 17.5% Responsible for grandchildren289 82.5% Not responsible for grandchildrenWhite alone, not Hispanic / Latino 65 17.6% Responsible for grandchildren305 82.4% Not responsible for grandchildren