Races in North Royalton, Ohio (OH) Detailed Stats
Data:
Races - White alone (%)
Races - White alone (% change since 2000)
Races - Black alone (%)
Races - Black alone (% change since 2000)
Races - American Indian alone (%)
Races - American Indian alone (% change since 2000)
Races - Asian alone (%)
Races - Asian alone (% change since 2000)
Races - Hispanic (%)
Races - Hispanic (% change since 2000)
Races - Native Hawaiian and Other Pacific Islander alone (%)
Races - Native Hawaiian and Other Pacific Islander alone (% change since 2000)
Races - Two or more races(%)
Races - Two or more races(% change since 2000)
Races - Other race alone (%)
Races - Other race alone (% change since 2000)
Racial diversity
Place of birth - Born in state of residence (%)
Place of birth - Born in state of residence (%) - White
Place of birth - Born in state of residence (%) - Black or African American
Place of birth - Born in state of residence (%) - Asian
Place of birth - Born in state of residence (%) - Hispanic or Latino
Place of birth - Born in state of residence (%) - American Indian and Alaska Native
Place of birth - Born in state of residence (%) - Multirace
Place of birth - Born in state of residence (%) - Other Race
Place of birth - Born in other state (%)
Place of birth - Born in other state (%) - White
Place of birth - Born in other state (%) - Black or African American
Place of birth - Born in other state (%) - Asian
Place of birth - Born in other state (%) - Hispanic or Latino
Place of birth - Born in other state (%) - American Indian and Alaska Native
Place of birth - Born in other state (%) - Multirace
Place of birth - Born in other state (%) - Other Race
Place of birth - Native, outside of US (%)
Place of birth - Native, outside of US (%) - White
Place of birth - Native, outside of US (%) - Black or African American
Place of birth - Native, outside of US (%) - Asian
Place of birth - Native, outside of US (%) - Hispanic or Latino
Place of birth - Native, outside of US (%) - American Indian and Alaska Native
Place of birth - Native, outside of US (%) - Multirace
Place of birth - Native, outside of US (%) - Other Race
Place of birth - Foreign born (%)
Place of birth - Foreign born (%) - White
Place of birth - Foreign born (%) - Black or African American
Place of birth - Foreign born (%) - Asian
Place of birth - Foreign born (%) - Hispanic or Latino
Place of birth - Foreign born (%) - American Indian and Alaska Native
Place of birth - Foreign born (%) - Multirace
Place of birth - Foreign born (%) - Other Race
Residents speaking English at home (%)
Residents speaking English at home - Born in the United States (%)
Residents speaking English at home - Native, born elsewhere (%)
Residents speaking English at home - Foreign born (%)
Residents speaking Spanish at home (%)
Residents speaking Spanish at home - Born in the United States (%)
Residents speaking Spanish at home - Native, born elsewhere (%)
Residents speaking Spanish at home - Foreign born (%)
Residents speaking other language at home (%)
Residents speaking other language at home - Born in the United States (%)
Residents speaking other language at home - Native, born elsewhere (%)
Residents speaking other language at home - Foreign born (%)
Marital status - Never married (%)
Marital status - Now married (%)
Marital status - Separated (%)
Marital status - Widowed (%)
Marital status - Divorced (%)
Ancestries Reported - Arab (%)
Ancestries Reported - Czech (%)
Ancestries Reported - Danish (%)
Ancestries Reported - Dutch (%)
Ancestries Reported - English (%)
Ancestries Reported - French (%)
Ancestries Reported - French Canadian (%)
Ancestries Reported - German (%)
Ancestries Reported - Greek (%)
Ancestries Reported - Hungarian (%)
Ancestries Reported - Irish (%)
Ancestries Reported - Italian (%)
Ancestries Reported - Lithuanian (%)
Ancestries Reported - Norwegian (%)
Ancestries Reported - Polish (%)
Ancestries Reported - Portuguese (%)
Ancestries Reported - Russian (%)
Ancestries Reported - Scotch-Irish (%)
Ancestries Reported - Scottish (%)
Ancestries Reported - Slovak (%)
Ancestries Reported - Subsaharan African (%)
Ancestries Reported - Swedish (%)
Ancestries Reported - Swiss (%)
Ancestries Reported - Ukrainian (%)
Ancestries Reported - United States (%)
Ancestries Reported - Welsh (%)
Ancestries Reported - West Indian (%)
Ancestries Reported - Other (%)
Geographical mobility - Same house 1 year ago (%)
Geographical mobility - Same house 1 year ago (%) - White
Geographical mobility - Same house 1 year ago (%) - Black or African American
Geographical mobility - Same house 1 year ago (%) - Asian
Geographical mobility - Same house 1 year ago (%) - Hispanic or Latino
Geographical mobility - Same house 1 year ago (%) - American Indian and Alaska Native
Geographical mobility - Same house 1 year ago (%) - Multirace
Geographical mobility - Same house 1 year ago (%) - Other Race
Geographical mobility - Moved within same county (%)
Geographical mobility - Moved within same county (%) - White
Geographical mobility - Moved within same county (%) - Black or African American
Geographical mobility - Moved within same county (%) - Asian
Geographical mobility - Moved within same county (%) - Hispanic or Latino
Geographical mobility - Moved within same county (%) - American Indian and Alaska Native
Geographical mobility - Moved within same county (%) - Multirace
Geographical mobility - Moved within same county (%) - Other Race
Geographical mobility - Moved from different county within same state (%)
Geographical mobility - Moved from different county within same state (%) - White
Geographical mobility - Moved from different county within same state (%) - Black or African American
Geographical mobility - Moved from different county within same state (%) - Asian
Geographical mobility - Moved from different county within same state (%) - Hispanic or Latino
Geographical mobility - Moved from different county within same state (%) - American Indian and Alaska Native
Geographical mobility - Moved from different county within same state (%) - Multirace
Geographical mobility - Moved from different county within same state (%) - Other Race
Geographical mobility - Moved from different state (%)
Geographical mobility - Moved from different state (%) - White
Geographical mobility - Moved from different state (%) - Black or African American
Geographical mobility - Moved from different state (%) - Asian
Geographical mobility - Moved from different state (%) - Hispanic or Latino
Geographical mobility - Moved from different state (%) - American Indian and Alaska Native
Geographical mobility - Moved from different state (%) - Multirace
Geographical mobility - Moved from different state (%) - Other Race
Geographical mobility - Moved from abroad (%)
Geographical mobility - Moved from abroad (%) - White
Geographical mobility - Moved from abroad (%) - Black or African American
Geographical mobility - Moved from abroad (%) - Asian
Geographical mobility - Moved from abroad (%) - Hispanic or Latino
Geographical mobility - Moved from abroad (%) - American Indian and Alaska Native
Geographical mobility - Moved from abroad (%) - Multirace
Geographical mobility - Moved from abroad (%) - Other Race
Place of birth for the foreign-born population - Ireland (%)
Place of birth for the foreign-born population - Denmark (%)
Place of birth for the foreign-born population - Norway (%)
Place of birth for the foreign-born population - Sweden (%)
Place of birth for the foreign-born population - United Kingdom (%)
Place of birth for the foreign-born population - England (%)
Place of birth for the foreign-born population - Scotland (%)
Place of birth for the foreign-born population - Other Northern Europe (%)
Place of birth for the foreign-born population - Austria (%)
Place of birth for the foreign-born population - Belgium (%)
Place of birth for the foreign-born population - France (%)
Place of birth for the foreign-born population - Germany (%)
Place of birth for the foreign-born population - Netherlands (%)
Place of birth for the foreign-born population - Switzerland (%)
Place of birth for the foreign-born population - Other Western Europe (%)
Place of birth for the foreign-born population - Greece (%)
Place of birth for the foreign-born population - Italy (%)
Place of birth for the foreign-born population - Portugal (%)
Place of birth for the foreign-born population - Spain (%)
Place of birth for the foreign-born population - Other Southern Europe (%)
Place of birth for the foreign-born population - Albania (%)
Place of birth for the foreign-born population - Belarus (%)
Place of birth for the foreign-born population - Bosnia and Herzegovina (%)
Place of birth for the foreign-born population - Bulgaria (%)
Place of birth for the foreign-born population - Croatia (%)
Place of birth for the foreign-born population - Czechoslovakia (%)
Place of birth for the foreign-born population - Hungary (%)
Place of birth for the foreign-born population - Latvia (%)
Place of birth for the foreign-born population - Lithuania (%)
Place of birth for the foreign-born population - North Macedonia (Macedonia) (%)
Place of birth for the foreign-born population - Moldova (%)
Place of birth for the foreign-born population - Poland (%)
Place of birth for the foreign-born population - Romania (%)
Place of birth for the foreign-born population - Russia (%)
Place of birth for the foreign-born population - Serbia (%)
Place of birth for the foreign-born population - Ukraine (%)
Place of birth for the foreign-born population - Other Eastern Europe (%)
Place of birth for the foreign-born population - China (%)
Place of birth for the foreign-born population - Hong Kong (%)
Place of birth for the foreign-born population - Taiwan (%)
Place of birth for the foreign-born population - Japan (%)
Place of birth for the foreign-born population - Korea (%)
Place of birth for the foreign-born population - Other Eastern Asia (%)
Place of birth for the foreign-born population - Afghanistan (%)
Place of birth for the foreign-born population - Bangladesh (%)
Place of birth for the foreign-born population - India (%)
Place of birth for the foreign-born population - Iran (%)
Place of birth for the foreign-born population - Kazakhstan (%)
Place of birth for the foreign-born population - Nepal (%)
Place of birth for the foreign-born population - Pakistan (%)
Place of birth for the foreign-born population - Sri Lanka (%)
Place of birth for the foreign-born population - Uzbekistan (%)
Place of birth for the foreign-born population - Other South Central Asia (%)
Place of birth for the foreign-born population - Burma (%)
Place of birth for the foreign-born population - Cambodia (%)
Place of birth for the foreign-born population - Indonesia (%)
Place of birth for the foreign-born population - Laos (%)
Place of birth for the foreign-born population - Malaysia (%)
Place of birth for the foreign-born population - Philippines (%)
Place of birth for the foreign-born population - Singapore (%)
Place of birth for the foreign-born population - Thailand (%)
Place of birth for the foreign-born population - Vietnam (%)
Place of birth for the foreign-born population - Other South Eastern Asia (%)
Place of birth for the foreign-born population - Armenia (%)
Place of birth for the foreign-born population - Iraq (%)
Place of birth for the foreign-born population - Israel (%)
Place of birth for the foreign-born population - Jordan (%)
Place of birth for the foreign-born population - Kuwait (%)
Place of birth for the foreign-born population - Lebanon (%)
Place of birth for the foreign-born population - Saudi Arabia (%)
Place of birth for the foreign-born population - Syria (%)
Place of birth for the foreign-born population - Turkey (%)
Place of birth for the foreign-born population - Yemen (%)
Place of birth for the foreign-born population - Other Western Asia (%)
Place of birth for the foreign-born population - Eritrea (%)
Place of birth for the foreign-born population - Ethiopia (%)
Place of birth for the foreign-born population - Kenya (%)
Place of birth for the foreign-born population - Somalia (%)
Place of birth for the foreign-born population - Uganda (%)
Place of birth for the foreign-born population - Zimbabwe (%)
Place of birth for the foreign-born population - Other Eastern Africa (%)
Place of birth for the foreign-born population - Cameroon (%)
Place of birth for the foreign-born population - Congo (%)
Place of birth for the foreign-born population - Democratic Republic of Congo (Zaire) (%)
Place of birth for the foreign-born population - Other Middle Africa (%)
Place of birth for the foreign-born population - Egypt (%)
Place of birth for the foreign-born population - Morocco (%)
Place of birth for the foreign-born population - Sudan (%)
Place of birth for the foreign-born population - Other Northern Africa (%)
Place of birth for the foreign-born population - South Africa (%)
Place of birth for the foreign-born population - Other Southern Africa (%)
Place of birth for the foreign-born population - Cabo Verde (%)
Place of birth for the foreign-born population - Ghana (%)
Place of birth for the foreign-born population - Liberia (%)
Place of birth for the foreign-born population - Nigeria (%)
Place of birth for the foreign-born population - Senegal (%)
Place of birth for the foreign-born population - Sierra Leone (%)
Place of birth for the foreign-born population - Other Western Africa (%)
Place of birth for the foreign-born population - Australia (%)
Place of birth for the foreign-born population - New Zealand (%)
Place of birth for the foreign-born population - Fiji (%)
Place of birth for the foreign-born population - Micronesia (%)
Place of birth for the foreign-born population - Bahamas (%)
Place of birth for the foreign-born population - Barbados (%)
Place of birth for the foreign-born population - Cuba (%)
Place of birth for the foreign-born population - Dominica (%)
Place of birth for the foreign-born population - Dominican Republic (%)
Place of birth for the foreign-born population - Grenada (%)
Place of birth for the foreign-born population - Haiti (%)
Place of birth for the foreign-born population - Jamaica (%)
Place of birth for the foreign-born population - St. Vincent and the Grenadines (%)
Place of birth for the foreign-born population - Trinidad and Tobago (%)
Place of birth for the foreign-born population - West Indies (%)
Place of birth for the foreign-born population - Other Caribbean (%)
Place of birth for the foreign-born population - Belize (%)
Place of birth for the foreign-born population - Costa Rica (%)
Place of birth for the foreign-born population - El Salvador (%)
Place of birth for the foreign-born population - Guatemala (%)
Place of birth for the foreign-born population - Honduras (%)
Place of birth for the foreign-born population - Mexico (%)
Place of birth for the foreign-born population - Nicaragua (%)
Place of birth for the foreign-born population - Panama (%)
Place of birth for the foreign-born population - Other Central America (%)
Place of birth for the foreign-born population - Argentina (%)
Place of birth for the foreign-born population - Bolivia (%)
Place of birth for the foreign-born population - Brazil (%)
Place of birth for the foreign-born population - Chile (%)
Place of birth for the foreign-born population - Colombia (%)
Place of birth for the foreign-born population - Ecuador (%)
Place of birth for the foreign-born population - Guyana (%)
Place of birth for the foreign-born population - Peru (%)
Place of birth for the foreign-born population - Uruguay (%)
Place of birth for the foreign-born population - Venezuela (%)
Place of birth for the foreign-born population - Other South America (%)
Place of birth for the foreign-born population - Canada (%)
Place of birth for the foreign-born population - Other Northern America (%)
Place of birth for the foreign-born population - Other (%)
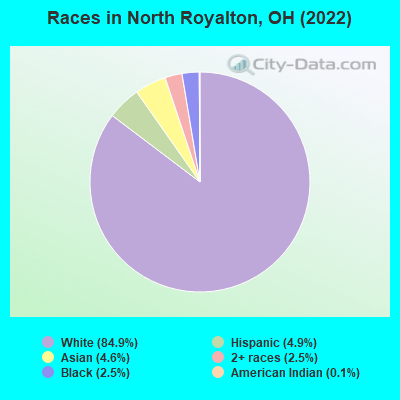
According to 2022 data, the most numerous races in North Royalton, OH are White alone (25,985 residents), Black alone (754 residents), and Two or more races (779 residents). 84.7% of North Royalton residents speak English at home. 12.3% of North Royalton, OH residents are foreign-born (6.0% born in Europe, 4.0% born in Asia), which is 67.4% greater than the foreign-born rate of 4.0% across the entire state of Ohio.
Race distribution in North Royalton
2000 2022
9,538,111 84.0% White alone 1,290,662 11.4% Black alone 217,123 1.9% Hispanic 137,770 1.2% Two or more races 131,670 1.2% Asian alone 21,985 0.2% American Indian alone 13,483 0.1% Other race alone 2,336 0.02% Native Hawaiian and Other
8,948,793 76.1% White alone 1,401,403 11.9% Black alone 529,291 4.5% Two or more races 517,232 4.4% Hispanic 293,387 2.5% Asian alone 52,805 0.4% Other race alone 9,785 0.08% American Indian alone 3,362 0.03% Native Hawaiian and Other
Income and house value in North Royalton Median household income in 2022 $79,313 White non-Hispanic householders$82,638 Black householders$132,638 Asian householders$85,715 Two or more races householders$50,755 Hispanic or Latino race householdersMedian 2022 house value $298,573 White Non-Hispanic householders$405,463 Black or African American householders$94,214 American Indian or Alaska Native householders $337,629 Asian householders$358,698 Two or more races householders$199,905 Hispanic or Latino householders
Median age by race in North Royalton
48.0 Median age for White residents44.8 50.1 31.5 Median age for Black or African American residents32.9 29.9 9.8 Median age for American Indian / Alaska Native residents9.7 33.7 37.8 Median age for Asian residents37.9 38.8 -706,093,189.3 Median age for Native Hawaiian / Pacific Islander residents-750,242,953.6 -805,394,989.6 52.1 Median age for Other race residents54.5 52.7 30.3 Median age for Two or more races residents21.1 55.9 48.3 Median age for White alone residents45.7 50.0 28.9 Median age for Hispanic or Latino residents17.6 41.8
Owner/renter occupied households by race in North Royalton
House owners and renters - White residents 8,848 74.2% Owner occupied3,080 25.8% Renter occupiedHouse owners and renters - Black or African American residents 37 9.7% Owner occupied342 90.3% Renter occupiedHouse owners and renters - American Indian / Alaska Native residents 66 100.0% Renter occupiedHouse owners and renters - Asian residents 222 56.2% Owner occupied173 43.8% Renter occupiedHouse owners and renters - Other race residents 27 100.0% Owner occupiedHouse owners and renters - Two or more races residents 452 60.0% Owner occupied302 40.0% Renter occupiedHouse owners and renters - White alone residents 8,866 73.8% Owner occupied3,153 26.2% Renter occupiedHouse owners and renters - Hispanic or Latino residents 183 47.7% Owner occupied201 52.3% Renter occupied
Language usage in North Royalton
English speakers - Total 84.7% of residents of North Royalton speak English at home.
2.1% of residents speak Spanish at home 352 56.6% Speak English very well270 43.4% Speak English less than very well13.5% of residents speak other language at home 2,579 64.9% Speak English very well1,394 35.1% Speak English less than very well
English speakers - Born in the United States 92.0% of residents of North Royalton speak English at home.
2.9% of residents speak Spanish at home 86 80.4% Speak English very well21 19.6% Speak English less than very well5.5% of residents speak other language at home 109 52.7% Speak English very well98 47.3% Speak English less than very well
English speakers - Native, born elsewhere 31.1% of residents of North Royalton speak English at home.
49.5% of residents speak Spanish at home 79 53.4% Speak English very well69 46.6% Speak English less than very well13.7% of residents speak other language at home 41 100.0% Speak English very well
English speakers - Foreign-born 13.6% of residents of North Royalton speak English at home.
5.8% of residents speak Spanish at home 42 19.9% Speak English very well169 80.1% Speak English less than very well80.4% of residents speak other language at home 1,682 57.9% Speak English very well1,223 42.1% Speak English less than very well
White (Caucasian) - Speak only English Native:
96.9% (22,338)Foreign-born:
19.5% (399)
White (Caucasian) - Speak another language Native:
3.3% (756)Foreign-born:
80.4% (1,643)
American Indian / Alaska Native - Speak another language Native:
100.0% (120)Foreign-born:
96.6% (72)
Asian - Speak only English Native:
29.7% (65)Foreign-born:
5.7% (62)
Asian - Speak another language Native:
72.6% (160)Foreign-born:
94.2% (1,034)
Other race - Speak only English Native:
33.6% (49)Foreign-born:
44.2% (33)
Other race - Speak another language Native:
67.5% (98)Foreign-born:
65.9% (50)
Two or more races - Speak another language Native:
13.2% (172)Foreign-born:
100.0% (142)
White alone - Speak only English Native:
96.2% (22,145)Foreign-born:
19.0% (405)
White alone - Speak another language Native:
3.8% (869)Foreign-born:
81.0% (1,730)
Hispanic or Latino - Speak only English Native:
66.1% (776)Foreign-born:
11.3% (27)
Hispanic or Latino - Speak another language Native:
34.7% (407)Foreign-born:
86.2% (205)
Foreign-born residents in North Royalton 3,756 residents are foreign born (6.0% Europe , 4.0% Asia ).
Marital status for residents in North Royalton Marital status - White (Caucasian) population 15 years and over
Males 32.1% Never married56.2% Now married1.4% Separated2.0% Widowed8.3% DivorcedFemales 25.7% Never married52.2% Now married0.4% Separated10.9% Widowed10.9% DivorcedWomen who gave birth in the past 12 months Now married:
68.4% (183)Unmarried:
31.6% (84)
Women who did not give birth in the past 12 months Now married:
41.2% (2,104)Unmarried:
58.8% (3,006)
Marital status - Black or African American population 15 years and over
Males 67.2% Never married14.9% Now married0.0% Separated2.0% Widowed15.9% DivorcedFemales 79.1% Never married10.3% Now married2.5% Separated8.1% Widowed0.0% DivorcedWomen who did not give birth in the past 12 months Now married:
8.7% (27)Unmarried:
91.3% (282)
Marital status - American Indian / Alaska Native population 15 years and over
Males 0.0% Never married100.0% Now married0.0% Separated0.0% Widowed0.0% DivorcedFemales 0.0% Never married41.0% Now married0.0% Separated0.0% Widowed59.0% DivorcedWomen who did not give birth in the past 12 months Now married:
100.0% (31)Unmarried:
0.0% (0)
Marital status - Asian population 15 years and over
Males 23.1% Never married71.5% Now married0.0% Separated3.0% Widowed2.5% DivorcedFemales 15.4% Never married82.6% Now married0.0% Separated0.0% Widowed2.0% DivorcedWomen who gave birth in the past 12 months Now married:
100.0% (73)Unmarried:
0.0% (0)
Women who did not give birth in the past 12 months Now married:
73.4% (223)Unmarried:
26.6% (81)
Marital status - Other race population 15 years and over
Males 31.6% Never married68.4% Now married0.0% Separated0.0% Widowed0.0% DivorcedFemales 0.0% Never married88.5% Now married0.0% Separated11.5% Widowed0.0% DivorcedWomen who gave birth in the past 12 months Now married:
100.0% (30)Unmarried:
0.0% (0)
Women who did not give birth in the past 12 months Now married:
100.0% (43)Unmarried:
0.0% (0)
Marital status - Two or more races population 15 years and over
Males 51.4% Never married42.3% Now married0.0% Separated0.0% Widowed6.3% DivorcedFemales 6.5% Never married60.5% Now married0.0% Separated0.0% Widowed33.0% DivorcedWomen who did not give birth in the past 12 months Now married:
52.1% (87)Unmarried:
47.9% (80)
Marital status - White alone, not Hispanic / Latino population 15 years and over
Males 32.3% Never married56.2% Now married1.4% Separated2.0% Widowed8.1% DivorcedFemales 25.9% Never married51.7% Now married0.4% Separated11.0% Widowed11.0% DivorcedWomen who gave birth in the past 12 months Now married:
68.4% (188)Unmarried:
31.6% (87)
Women who did not give birth in the past 12 months Now married:
40.5% (2,087)Unmarried:
59.5% (3,068)
Marital status - Hispanic or Latino population 15 years and over
Males 24.8% Never married63.7% Now married0.0% Separated0.0% Widowed11.5% DivorcedFemales 12.4% Never married64.5% Now married0.0% Separated1.9% Widowed21.2% DivorcedWomen who gave birth in the past 12 months Now married:
100.0% (22)Unmarried:
0.0% (0)
Women who did not give birth in the past 12 months Now married:
69.1% (203)Unmarried:
30.9% (91)
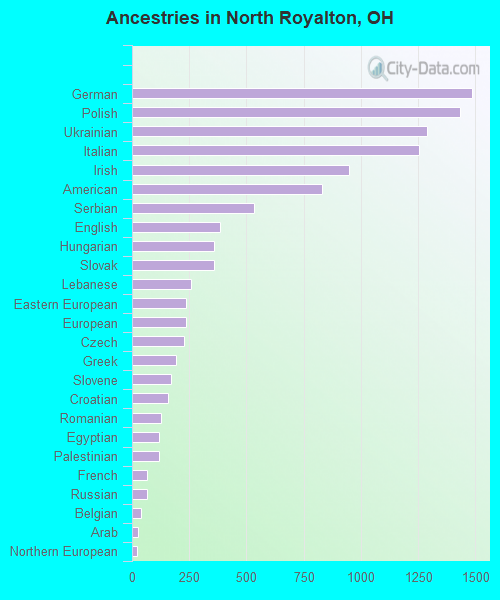
Ancestries in North Royalton
1,486 10.3% German1,432 9.9% Polish1,288 8.9% Ukrainian1,254 8.7% Italian949 6.5% Irish832 5.7% American535 3.7% Serbian383 2.6% English360 2.5% Hungarian360 2.5% Slovak257 1.8% Lebanese238 1.6% Eastern European238 1.6% European229 1.6% Czech191 1.3% Greek170 1.2% Slovene157 1.1% Croatian127 0.9% Romanian120 0.8% Egyptian118 0.8% Palestinian67 0.5% French65 0.4% Russian38 0.3% Belgian25 0.2% Arab24 0.2% Northern European24 0.2% Czechoslovakian22 0.2% Welsh22 0.2% Jordanian21 0.1% Scotch-Irish21 0.1% Albanian20 0.1% British20 0.1% Scottish18 0.1% Lithuanian17 0.1% Macedonian14 0.10% Austrian12 0.08% Swiss10 0.07% Syrian9 0.06% Finnish6 0.04% Portuguese4 0.03% Slavic
Geographical mobility in North Royalton Same house 1 year ago 23,161 90.0% White (Caucasian)508 62.7% Black or African American239 100.0% American Indian / Alaska Native1,014 75.4% Asian215 91.6% Other race1,468 92.6% Two or more races23,242 90.2% White alone, not Hispanic / Latino1,201 81.7% Hispanic or LatinoMoved within same county 1,757 6.8% White / Caucasian106 13.1% Black or African American65 4.8% Asian102 6.4% Two or more races1,670 6.5% White alone, not Hispanic / Latino203 13.8% Hispanic or LatinoMoved within same state 592 2.3% White / Caucasian149 18.4% Black or African American3 0.2% Two or more races596 2.3% White alone, not Hispanic / LatinoMoved from different state 195 0.8% White / Caucasian120 8.9% Asian206 0.8% White alone, not Hispanic / LatinoMoved from abroad 65 8.0% Black or African American69 5.2% Asian28 1.9% Hispanic or Latino
Children Nativity (place of birth) in North Royalton
Children under 6 years - Living with two parents Both parents native 913 100.0% NativeBoth parents foreign-born 156 100.0% NativeOne native, one foreign-born parent 108 100.0% NativeChildren under 6 years - Living with one parent Native parent 243 100.0% NativeForeign-born parent 24 100.0% NativeChildren 6 to 17 years - Living with two parents Both parents native 1,856 100.0% NativeBoth parents foreign-born 340 69.5% Native149 30.5% Foreign-bornOne native, one foreign-born parent 89 100.0% NativeChildren 6 to 17 years - Living with one parent Native parent 1,027 100.0% NativeForeign-born parent 35 65.2% Native19 34.8% Foreign-born
Grandparents responsible for own grandchildren in North Royalton
Grandparents (30 to 59 years) White / Caucasian 77 100.0% Not responsible for grandchildrenAsian 16 100.0% Not responsible for grandchildrenWhite alone, not Hispanic / Latino 76 100.0% Not responsible for grandchildrenGrandparents (60 years and over) White / Caucasian 79 42.1% Responsible for grandchildren108 57.9% Not responsible for grandchildrenAsian 12 27.8% Responsible for grandchildren30 72.2% Not responsible for grandchildrenWhite alone, not Hispanic / Latino 80 41.5% Responsible for grandchildren113 58.5% Not responsible for grandchildren