Races in Oceanside, New York (NY) Detailed Stats
Data:
Races - White alone (%)
Races - White alone (% change since 2000)
Races - Black alone (%)
Races - Black alone (% change since 2000)
Races - American Indian alone (%)
Races - American Indian alone (% change since 2000)
Races - Asian alone (%)
Races - Asian alone (% change since 2000)
Races - Hispanic (%)
Races - Hispanic (% change since 2000)
Races - Native Hawaiian and Other Pacific Islander alone (%)
Races - Native Hawaiian and Other Pacific Islander alone (% change since 2000)
Races - Two or more races(%)
Races - Two or more races(% change since 2000)
Races - Other race alone (%)
Races - Other race alone (% change since 2000)
Racial diversity
Place of birth - Born in state of residence (%)
Place of birth - Born in state of residence (%) - White
Place of birth - Born in state of residence (%) - Black or African American
Place of birth - Born in state of residence (%) - Asian
Place of birth - Born in state of residence (%) - Hispanic or Latino
Place of birth - Born in state of residence (%) - American Indian and Alaska Native
Place of birth - Born in state of residence (%) - Multirace
Place of birth - Born in state of residence (%) - Other Race
Place of birth - Born in other state (%)
Place of birth - Born in other state (%) - White
Place of birth - Born in other state (%) - Black or African American
Place of birth - Born in other state (%) - Asian
Place of birth - Born in other state (%) - Hispanic or Latino
Place of birth - Born in other state (%) - American Indian and Alaska Native
Place of birth - Born in other state (%) - Multirace
Place of birth - Born in other state (%) - Other Race
Place of birth - Native, outside of US (%)
Place of birth - Native, outside of US (%) - White
Place of birth - Native, outside of US (%) - Black or African American
Place of birth - Native, outside of US (%) - Asian
Place of birth - Native, outside of US (%) - Hispanic or Latino
Place of birth - Native, outside of US (%) - American Indian and Alaska Native
Place of birth - Native, outside of US (%) - Multirace
Place of birth - Native, outside of US (%) - Other Race
Place of birth - Foreign born (%)
Place of birth - Foreign born (%) - White
Place of birth - Foreign born (%) - Black or African American
Place of birth - Foreign born (%) - Asian
Place of birth - Foreign born (%) - Hispanic or Latino
Place of birth - Foreign born (%) - American Indian and Alaska Native
Place of birth - Foreign born (%) - Multirace
Place of birth - Foreign born (%) - Other Race
Residents speaking English at home (%)
Residents speaking English at home - Born in the United States (%)
Residents speaking English at home - Native, born elsewhere (%)
Residents speaking English at home - Foreign born (%)
Residents speaking Spanish at home (%)
Residents speaking Spanish at home - Born in the United States (%)
Residents speaking Spanish at home - Native, born elsewhere (%)
Residents speaking Spanish at home - Foreign born (%)
Residents speaking other language at home (%)
Residents speaking other language at home - Born in the United States (%)
Residents speaking other language at home - Native, born elsewhere (%)
Residents speaking other language at home - Foreign born (%)
Marital status - Never married (%)
Marital status - Now married (%)
Marital status - Separated (%)
Marital status - Widowed (%)
Marital status - Divorced (%)
Ancestries Reported - Arab (%)
Ancestries Reported - Czech (%)
Ancestries Reported - Danish (%)
Ancestries Reported - Dutch (%)
Ancestries Reported - English (%)
Ancestries Reported - French (%)
Ancestries Reported - French Canadian (%)
Ancestries Reported - German (%)
Ancestries Reported - Greek (%)
Ancestries Reported - Hungarian (%)
Ancestries Reported - Irish (%)
Ancestries Reported - Italian (%)
Ancestries Reported - Lithuanian (%)
Ancestries Reported - Norwegian (%)
Ancestries Reported - Polish (%)
Ancestries Reported - Portuguese (%)
Ancestries Reported - Russian (%)
Ancestries Reported - Scotch-Irish (%)
Ancestries Reported - Scottish (%)
Ancestries Reported - Slovak (%)
Ancestries Reported - Subsaharan African (%)
Ancestries Reported - Swedish (%)
Ancestries Reported - Swiss (%)
Ancestries Reported - Ukrainian (%)
Ancestries Reported - United States (%)
Ancestries Reported - Welsh (%)
Ancestries Reported - West Indian (%)
Ancestries Reported - Other (%)
Geographical mobility - Same house 1 year ago (%)
Geographical mobility - Same house 1 year ago (%) - White
Geographical mobility - Same house 1 year ago (%) - Black or African American
Geographical mobility - Same house 1 year ago (%) - Asian
Geographical mobility - Same house 1 year ago (%) - Hispanic or Latino
Geographical mobility - Same house 1 year ago (%) - American Indian and Alaska Native
Geographical mobility - Same house 1 year ago (%) - Multirace
Geographical mobility - Same house 1 year ago (%) - Other Race
Geographical mobility - Moved within same county (%)
Geographical mobility - Moved within same county (%) - White
Geographical mobility - Moved within same county (%) - Black or African American
Geographical mobility - Moved within same county (%) - Asian
Geographical mobility - Moved within same county (%) - Hispanic or Latino
Geographical mobility - Moved within same county (%) - American Indian and Alaska Native
Geographical mobility - Moved within same county (%) - Multirace
Geographical mobility - Moved within same county (%) - Other Race
Geographical mobility - Moved from different county within same state (%)
Geographical mobility - Moved from different county within same state (%) - White
Geographical mobility - Moved from different county within same state (%) - Black or African American
Geographical mobility - Moved from different county within same state (%) - Asian
Geographical mobility - Moved from different county within same state (%) - Hispanic or Latino
Geographical mobility - Moved from different county within same state (%) - American Indian and Alaska Native
Geographical mobility - Moved from different county within same state (%) - Multirace
Geographical mobility - Moved from different county within same state (%) - Other Race
Geographical mobility - Moved from different state (%)
Geographical mobility - Moved from different state (%) - White
Geographical mobility - Moved from different state (%) - Black or African American
Geographical mobility - Moved from different state (%) - Asian
Geographical mobility - Moved from different state (%) - Hispanic or Latino
Geographical mobility - Moved from different state (%) - American Indian and Alaska Native
Geographical mobility - Moved from different state (%) - Multirace
Geographical mobility - Moved from different state (%) - Other Race
Geographical mobility - Moved from abroad (%)
Geographical mobility - Moved from abroad (%) - White
Geographical mobility - Moved from abroad (%) - Black or African American
Geographical mobility - Moved from abroad (%) - Asian
Geographical mobility - Moved from abroad (%) - Hispanic or Latino
Geographical mobility - Moved from abroad (%) - American Indian and Alaska Native
Geographical mobility - Moved from abroad (%) - Multirace
Geographical mobility - Moved from abroad (%) - Other Race
Place of birth for the foreign-born population - Ireland (%)
Place of birth for the foreign-born population - Denmark (%)
Place of birth for the foreign-born population - Norway (%)
Place of birth for the foreign-born population - Sweden (%)
Place of birth for the foreign-born population - United Kingdom (%)
Place of birth for the foreign-born population - England (%)
Place of birth for the foreign-born population - Scotland (%)
Place of birth for the foreign-born population - Other Northern Europe (%)
Place of birth for the foreign-born population - Austria (%)
Place of birth for the foreign-born population - Belgium (%)
Place of birth for the foreign-born population - France (%)
Place of birth for the foreign-born population - Germany (%)
Place of birth for the foreign-born population - Netherlands (%)
Place of birth for the foreign-born population - Switzerland (%)
Place of birth for the foreign-born population - Other Western Europe (%)
Place of birth for the foreign-born population - Greece (%)
Place of birth for the foreign-born population - Italy (%)
Place of birth for the foreign-born population - Portugal (%)
Place of birth for the foreign-born population - Spain (%)
Place of birth for the foreign-born population - Other Southern Europe (%)
Place of birth for the foreign-born population - Albania (%)
Place of birth for the foreign-born population - Belarus (%)
Place of birth for the foreign-born population - Bosnia and Herzegovina (%)
Place of birth for the foreign-born population - Bulgaria (%)
Place of birth for the foreign-born population - Croatia (%)
Place of birth for the foreign-born population - Czechoslovakia (%)
Place of birth for the foreign-born population - Hungary (%)
Place of birth for the foreign-born population - Latvia (%)
Place of birth for the foreign-born population - Lithuania (%)
Place of birth for the foreign-born population - North Macedonia (Macedonia) (%)
Place of birth for the foreign-born population - Moldova (%)
Place of birth for the foreign-born population - Poland (%)
Place of birth for the foreign-born population - Romania (%)
Place of birth for the foreign-born population - Russia (%)
Place of birth for the foreign-born population - Serbia (%)
Place of birth for the foreign-born population - Ukraine (%)
Place of birth for the foreign-born population - Other Eastern Europe (%)
Place of birth for the foreign-born population - China (%)
Place of birth for the foreign-born population - Hong Kong (%)
Place of birth for the foreign-born population - Taiwan (%)
Place of birth for the foreign-born population - Japan (%)
Place of birth for the foreign-born population - Korea (%)
Place of birth for the foreign-born population - Other Eastern Asia (%)
Place of birth for the foreign-born population - Afghanistan (%)
Place of birth for the foreign-born population - Bangladesh (%)
Place of birth for the foreign-born population - India (%)
Place of birth for the foreign-born population - Iran (%)
Place of birth for the foreign-born population - Kazakhstan (%)
Place of birth for the foreign-born population - Nepal (%)
Place of birth for the foreign-born population - Pakistan (%)
Place of birth for the foreign-born population - Sri Lanka (%)
Place of birth for the foreign-born population - Uzbekistan (%)
Place of birth for the foreign-born population - Other South Central Asia (%)
Place of birth for the foreign-born population - Burma (%)
Place of birth for the foreign-born population - Cambodia (%)
Place of birth for the foreign-born population - Indonesia (%)
Place of birth for the foreign-born population - Laos (%)
Place of birth for the foreign-born population - Malaysia (%)
Place of birth for the foreign-born population - Philippines (%)
Place of birth for the foreign-born population - Singapore (%)
Place of birth for the foreign-born population - Thailand (%)
Place of birth for the foreign-born population - Vietnam (%)
Place of birth for the foreign-born population - Other South Eastern Asia (%)
Place of birth for the foreign-born population - Armenia (%)
Place of birth for the foreign-born population - Iraq (%)
Place of birth for the foreign-born population - Israel (%)
Place of birth for the foreign-born population - Jordan (%)
Place of birth for the foreign-born population - Kuwait (%)
Place of birth for the foreign-born population - Lebanon (%)
Place of birth for the foreign-born population - Saudi Arabia (%)
Place of birth for the foreign-born population - Syria (%)
Place of birth for the foreign-born population - Turkey (%)
Place of birth for the foreign-born population - Yemen (%)
Place of birth for the foreign-born population - Other Western Asia (%)
Place of birth for the foreign-born population - Eritrea (%)
Place of birth for the foreign-born population - Ethiopia (%)
Place of birth for the foreign-born population - Kenya (%)
Place of birth for the foreign-born population - Somalia (%)
Place of birth for the foreign-born population - Uganda (%)
Place of birth for the foreign-born population - Zimbabwe (%)
Place of birth for the foreign-born population - Other Eastern Africa (%)
Place of birth for the foreign-born population - Cameroon (%)
Place of birth for the foreign-born population - Congo (%)
Place of birth for the foreign-born population - Democratic Republic of Congo (Zaire) (%)
Place of birth for the foreign-born population - Other Middle Africa (%)
Place of birth for the foreign-born population - Egypt (%)
Place of birth for the foreign-born population - Morocco (%)
Place of birth for the foreign-born population - Sudan (%)
Place of birth for the foreign-born population - Other Northern Africa (%)
Place of birth for the foreign-born population - South Africa (%)
Place of birth for the foreign-born population - Other Southern Africa (%)
Place of birth for the foreign-born population - Cabo Verde (%)
Place of birth for the foreign-born population - Ghana (%)
Place of birth for the foreign-born population - Liberia (%)
Place of birth for the foreign-born population - Nigeria (%)
Place of birth for the foreign-born population - Senegal (%)
Place of birth for the foreign-born population - Sierra Leone (%)
Place of birth for the foreign-born population - Other Western Africa (%)
Place of birth for the foreign-born population - Australia (%)
Place of birth for the foreign-born population - New Zealand (%)
Place of birth for the foreign-born population - Fiji (%)
Place of birth for the foreign-born population - Micronesia (%)
Place of birth for the foreign-born population - Bahamas (%)
Place of birth for the foreign-born population - Barbados (%)
Place of birth for the foreign-born population - Cuba (%)
Place of birth for the foreign-born population - Dominica (%)
Place of birth for the foreign-born population - Dominican Republic (%)
Place of birth for the foreign-born population - Grenada (%)
Place of birth for the foreign-born population - Haiti (%)
Place of birth for the foreign-born population - Jamaica (%)
Place of birth for the foreign-born population - St. Vincent and the Grenadines (%)
Place of birth for the foreign-born population - Trinidad and Tobago (%)
Place of birth for the foreign-born population - West Indies (%)
Place of birth for the foreign-born population - Other Caribbean (%)
Place of birth for the foreign-born population - Belize (%)
Place of birth for the foreign-born population - Costa Rica (%)
Place of birth for the foreign-born population - El Salvador (%)
Place of birth for the foreign-born population - Guatemala (%)
Place of birth for the foreign-born population - Honduras (%)
Place of birth for the foreign-born population - Mexico (%)
Place of birth for the foreign-born population - Nicaragua (%)
Place of birth for the foreign-born population - Panama (%)
Place of birth for the foreign-born population - Other Central America (%)
Place of birth for the foreign-born population - Argentina (%)
Place of birth for the foreign-born population - Bolivia (%)
Place of birth for the foreign-born population - Brazil (%)
Place of birth for the foreign-born population - Chile (%)
Place of birth for the foreign-born population - Colombia (%)
Place of birth for the foreign-born population - Ecuador (%)
Place of birth for the foreign-born population - Guyana (%)
Place of birth for the foreign-born population - Peru (%)
Place of birth for the foreign-born population - Uruguay (%)
Place of birth for the foreign-born population - Venezuela (%)
Place of birth for the foreign-born population - Other South America (%)
Place of birth for the foreign-born population - Canada (%)
Place of birth for the foreign-born population - Other Northern America (%)
Place of birth for the foreign-born population - Other (%)
Latest news about races in Oceanside, NY collected exclusively by city-data.com from local newspapers, TV, and radio stations
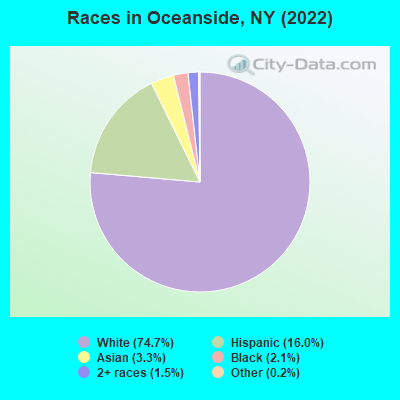
According to 2022 data, the most numerous races in Oceanside, NY are White alone (23,430 residents), Hispanic (5,012 residents), and Black alone (669 residents). 82.1% of Oceanside residents speak English at home. 14.5% of Oceanside, NY residents are foreign-born (6.5% born in Latin America, 5.3% born in Europe, 2.4% born in Asia), which is 51.8% less than the foreign-born rate of 22.0% across the entire state of New York.
Race distribution in Oceanside
2000 2022
11,760,981 62.0% White alone 2,867,583 15.1% Hispanic 2,812,623 14.8% Black alone 1,035,926 5.5% Asian alone 366,116 1.9% Two or more races 75,499 0.4% Other race alone 52,499 0.3% American Indian alone 5,230 0.03% Native Hawaiian and Other
10,408,933 52.9% White alone 3,867,299 19.7% Hispanic 2,633,840 13.4% Black alone 1,776,286 9.0% Asian alone 732,670 3.7% Two or more races 216,110 1.1% Other race alone 35,082 0.2% American Indian alone 6,931 0.04% Native Hawaiian and Other
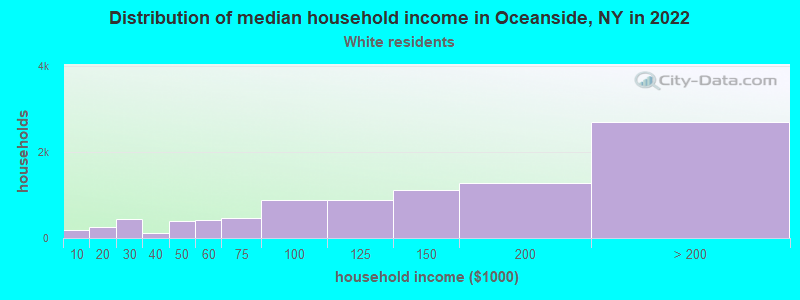
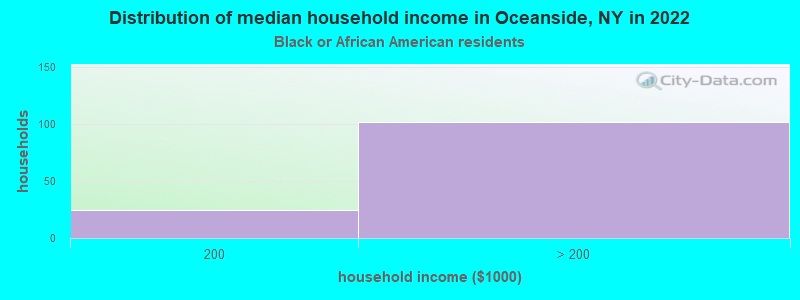
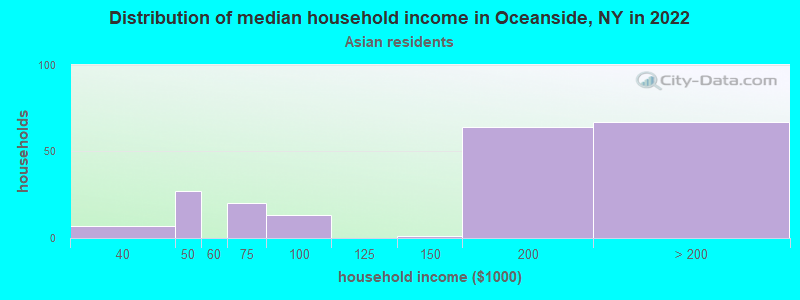
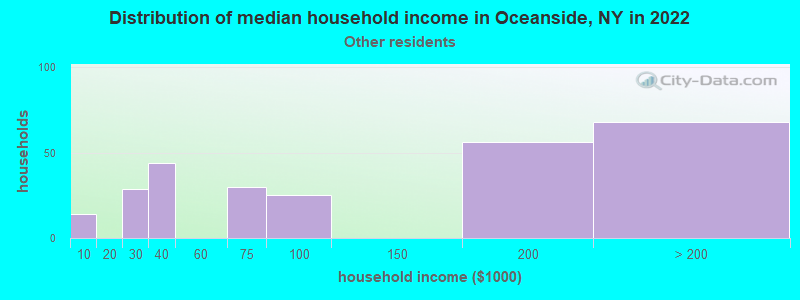
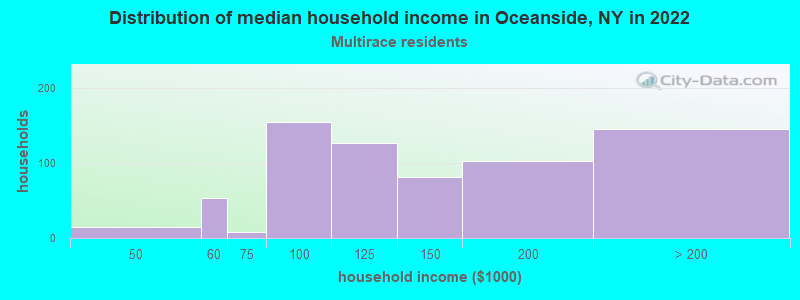
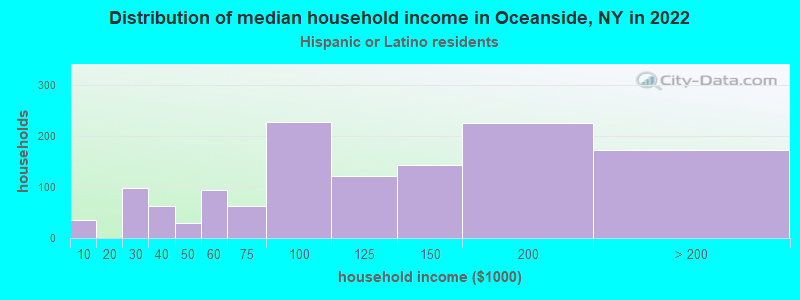
Income and house value in Oceanside Median household income in 2022 $133,801 White non-Hispanic householdersover $200,000 Black householders$180,526 Asian householders$107,618 Two or more races householders$103,631 Hispanic or Latino race householdersMedian 2022 house value $636,804 White Non-Hispanic householders$677,098 Black or African American householders $595,456 Asian householders$606,781 Some other race householders$582,025 Two or more races householders$620,739 Hispanic or Latino householders
Median age by race in Oceanside
48.4 Median age for White residents45.4 51.8 34.2 Median age for Black or African American residents30.8 37.1 49.3 Median age for American Indian / Alaska Native residents35.0 48.5 51.7 Median age for Asian residents53.9 43.2 -487,992,314.6 Median age for Native Hawaiian / Pacific Islander residents-477,502,295.2 -497,387,669.3 34.8 Median age for Other race residents24.3 49.9 29.0 Median age for Two or more races residents28.7 29.5 49.1 Median age for White alone residents47.0 51.3 34.1 Median age for Hispanic or Latino residents30.1 42.1
Owner/renter occupied households by race in Oceanside
House owners and renters - White residents 8,479 93.0% Owner occupied640 7.0% Renter occupiedHouse owners and renters - Black or African American residents 136 100.0% Owner occupiedHouse owners and renters - American Indian / Alaska Native residents 6 100.0% Owner occupiedHouse owners and renters - Asian residents 211 100.0% Owner occupiedHouse owners and renters - Other race residents 282 95.2% Owner occupied14 4.8% Renter occupiedHouse owners and renters - Two or more races residents 399 56.3% Owner occupied310 43.7% Renter occupiedHouse owners and renters - White alone residents 8,302 93.2% Owner occupied603 6.8% Renter occupiedHouse owners and renters - Hispanic or Latino residents 904 73.8% Owner occupied321 26.2% Renter occupied
Language usage in Oceanside
English speakers - Total 82.1% of residents of Oceanside speak English at home.
9.2% of residents speak Spanish at home 1,670 60.4% Speak English very well1,096 39.6% Speak English less than very well8.1% of residents speak other language at home 1,719 71.1% Speak English very well698 28.9% Speak English less than very well
English speakers - Born in the United States 91.9% of residents of Oceanside speak English at home.
6.4% of residents speak Spanish at home 67 82.7% Speak English very well14 17.3% Speak English less than very well1.6% of residents speak other language at home 20 100.0% Speak English very well
English speakers - Native, born elsewhere 48.3% of residents of Oceanside speak English at home.
29.0% of residents speak Spanish at home 73 83.9% Speak English very well14 16.1% Speak English less than very well23.0% of residents speak other language at home 39 56.5% Speak English very well30 43.5% Speak English less than very well
English speakers - Foreign-born 27.8% of residents of Oceanside speak English at home.
32.8% of residents speak Spanish at home 702 45.6% Speak English very well839 54.4% Speak English less than very well37.0% of residents speak other language at home 1,079 62.2% Speak English very well657 37.8% Speak English less than very well
White (Caucasian) - Speak only English Native:
97.4% (20,822)Foreign-born:
40.6% (813)
White (Caucasian) - Speak another language Native:
3.4% (734)Foreign-born:
61.9% (1,239)
Black or African American - Speak only English Native:
90.1% (321)Foreign-born:
78.4% (237)
Black or African American - Speak another language Native:
9.8% (35)Foreign-born:
21.1% (64)
Asian - Speak only English Native:
81.0% (378)Foreign-born:
19.3% (94)
Asian - Speak another language Native:
21.1% (98)Foreign-born:
78.9% (385)
Other race - Speak only English Native:
32.5% (219)Foreign-born:
5.0% (18)
Other race - Speak another language Native:
66.3% (448)Foreign-born:
95.7% (337)
Two or more races - Speak only English Native:
70.4% (1,238)Foreign-born:
10.0% (121)
Two or more races - Speak another language Native:
28.5% (502)Foreign-born:
91.3% (1,109)
White alone - Speak only English Native:
97.6% (20,215)Foreign-born:
40.7% (835)
White alone - Speak another language Native:
2.7% (557)Foreign-born:
59.1% (1,213)
Hispanic or Latino - Speak only English Native:
58.3% (1,627)Foreign-born:
8.4% (145)
Hispanic or Latino - Speak another language Native:
41.4% (1,156)Foreign-born:
91.6% (1,577)
Foreign-born residents in Oceanside 4,547 residents are foreign born (6.5% Latin America , 5.3% Europe , 2.4% Asia ).
This city:
14.5%New York:
22.6%
Marital status for residents in Oceanside Marital status - White (Caucasian) population 15 years and over
Males 29.0% Never married62.0% Now married0.7% Separated4.0% Widowed4.3% DivorcedFemales 19.2% Never married59.2% Now married1.6% Separated11.8% Widowed8.2% DivorcedWomen who gave birth in the past 12 months Now married:
86.0% (198)Unmarried:
14.0% (32)
Women who did not give birth in the past 12 months Now married:
54.8% (2,169)Unmarried:
45.2% (1,791)
Marital status - Black or African American population 15 years and over
Males 38.8% Never married53.2% Now married0.0% Separated2.8% Widowed5.2% DivorcedFemales 56.5% Never married35.8% Now married0.0% Separated1.4% Widowed6.3% DivorcedWomen who did not give birth in the past 12 months Now married:
30.4% (49)Unmarried:
69.6% (112)
Marital status - American Indian / Alaska Native population 15 years and over
Males 0.0% Never married100.0% Now married0.0% Separated0.0% Widowed0.0% DivorcedFemales 43.5% Never married56.5% Now married0.0% Separated0.0% Widowed0.0% DivorcedWomen who did not give birth in the past 12 months Now married:
56.5% (19)Unmarried:
43.5% (14)
Marital status - Asian population 15 years and over
Males 21.7% Never married78.3% Now married0.0% Separated0.0% Widowed0.0% DivorcedFemales 9.9% Never married79.2% Now married0.0% Separated0.0% Widowed11.0% DivorcedWomen who gave birth in the past 12 months Now married:
100.0% (20)Unmarried:
0.0% (0)
Women who did not give birth in the past 12 months Now married:
78.0% (136)Unmarried:
22.0% (39)
Marital status - Other race population 15 years and over
Males 51.3% Never married48.7% Now married0.0% Separated0.0% Widowed0.0% DivorcedFemales 17.4% Never married67.1% Now married0.0% Separated0.0% Widowed15.5% DivorcedWomen who gave birth in the past 12 months Now married:
100.0% (16)Unmarried:
0.0% (0)
Women who did not give birth in the past 12 months Now married:
76.7% (247)Unmarried:
23.3% (75)
Marital status - Two or more races population 15 years and over
Males 28.4% Never married63.6% Now married7.9% Separated0.0% Widowed0.0% DivorcedFemales 36.1% Never married53.7% Now married0.0% Separated2.7% Widowed7.6% DivorcedWomen who gave birth in the past 12 months Now married:
100.0% (8)Unmarried:
0.0% (0)
Women who did not give birth in the past 12 months Now married:
41.8% (346)Unmarried:
58.2% (482)
Marital status - White alone, not Hispanic / Latino population 15 years and over
Males 29.5% Never married61.3% Now married0.7% Separated4.2% Widowed4.3% DivorcedFemales 20.2% Never married58.7% Now married1.5% Separated12.0% Widowed7.7% DivorcedWomen who gave birth in the past 12 months Now married:
86.0% (211)Unmarried:
14.0% (34)
Women who did not give birth in the past 12 months Now married:
52.1% (2,039)Unmarried:
47.9% (1,875)
Marital status - Hispanic or Latino population 15 years and over
Males 31.1% Never married63.6% Now married3.4% Separated0.0% Widowed2.0% DivorcedFemales 20.1% Never married62.6% Now married1.0% Separated4.6% Widowed11.8% DivorcedWomen who gave birth in the past 12 months Now married:
100.0% (19)Unmarried:
0.0% (0)
Women who did not give birth in the past 12 months Now married:
64.7% (686)Unmarried:
35.3% (374)
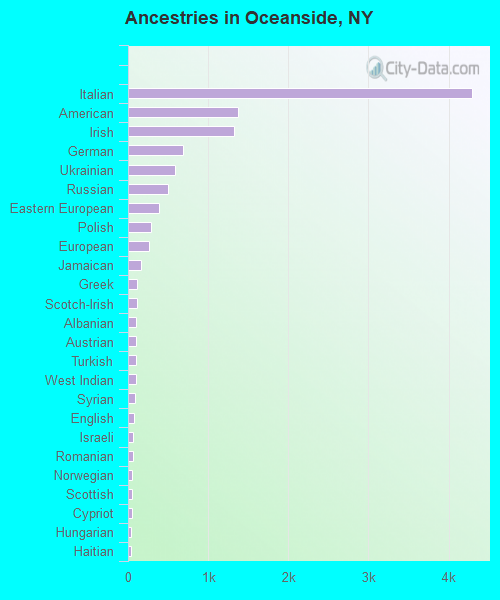
Ancestries in Oceanside
4,289 29.3% Italian1,371 9.4% American1,318 9.0% Irish690 4.7% German581 4.0% Ukrainian493 3.4% Russian391 2.7% Eastern European285 1.9% Polish261 1.8% European158 1.1% Jamaican111 0.8% Greek109 0.7% Scotch-Irish106 0.7% Albanian105 0.7% Austrian105 0.7% Turkish95 0.6% West Indian90 0.6% Syrian77 0.5% English68 0.5% Israeli65 0.4% Romanian56 0.4% Norwegian50 0.3% Scottish47 0.3% Cypriot43 0.3% Hungarian41 0.3% Haitian38 0.3% Dutch34 0.2% Jordanian33 0.2% Armenian30 0.2% Slavic25 0.2% British22 0.2% Australian16 0.1% Portuguese15 0.1% Slovak11 0.08% Moroccan11 0.08% Slovene8 0.05% Lebanese8 0.05% Belgian6 0.04% Canadian5 0.03% French5 0.03% Nigerian4 0.03% Scandinavian
Geographical mobility in Oceanside Same house 1 year ago 22,617 94.2% White (Caucasian)749 96.3% Black or African American70 100.0% American Indian / Alaska Native980 95.4% Asian896 88.4% Other race3,147 98.9% Two or more races21,856 93.9% White alone, not Hispanic / Latino4,773 96.8% Hispanic or LatinoMoved within same county 967 4.0% White / Caucasian22 2.8% Black or African American23 2.3% Asian125 12.4% Other race1,013 4.4% White alone, not Hispanic / Latino127 2.6% Hispanic or LatinoMoved within same state 246 1.0% White / Caucasian3 0.4% Black or African American6 0.6% Other race252 1.1% White alone, not Hispanic / Latino8 0.2% Hispanic or LatinoMoved from different state 23 0.1% White / Caucasian23 0.1% White alone, not Hispanic / LatinoMoved from abroad 84 0.4% White88 0.4% White alone, not Hispanic / Latino
Children Nativity (place of birth) in Oceanside
Children under 6 years - Living with two parents Both parents native 1,184 100.0% NativeBoth parents foreign-born 66 100.0% NativeOne native, one foreign-born parent 180 100.0% NativeChildren under 6 years - Living with one parent Native parent 128 100.0% NativeForeign-born parent 36 100.0% NativeChildren 6 to 17 years - Living with two parents Both parents native 2,554 100.0% NativeBoth parents foreign-born 503 94.2% Native31 5.8% Foreign-bornOne native, one foreign-born parent 756 100.0% NativeChildren 6 to 17 years - Living with one parent Native parent 542 100.0% NativeForeign-born parent 82 53.8% Native70 46.2% Foreign-born
Grandparents responsible for own grandchildren in Oceanside
Grandparents (30 to 59 years) White / Caucasian 53 100.0% Not responsible for grandchildrenWhite alone, not Hispanic / Latino 22 100.0% Not responsible for grandchildrenHispanic or Latino 22 100.0% Not responsible for grandchildrenGrandparents (60 years and over) White / Caucasian 30 6.1% Responsible for grandchildren462 93.9% Not responsible for grandchildrenWhite alone, not Hispanic / Latino 28 5.8% Responsible for grandchildren458 94.2% Not responsible for grandchildrenHispanic or Latino 111 100.0% Not responsible for grandchildren