Races in Palestine, Texas (TX) Detailed Stats
Data:
Races - White alone (%)
Races - White alone (% change since 2000)
Races - Black alone (%)
Races - Black alone (% change since 2000)
Races - American Indian alone (%)
Races - American Indian alone (% change since 2000)
Races - Asian alone (%)
Races - Asian alone (% change since 2000)
Races - Hispanic (%)
Races - Hispanic (% change since 2000)
Races - Native Hawaiian and Other Pacific Islander alone (%)
Races - Native Hawaiian and Other Pacific Islander alone (% change since 2000)
Races - Two or more races(%)
Races - Two or more races(% change since 2000)
Races - Other race alone (%)
Races - Other race alone (% change since 2000)
Racial diversity
Place of birth - Born in state of residence (%)
Place of birth - Born in state of residence (%) - White
Place of birth - Born in state of residence (%) - Black or African American
Place of birth - Born in state of residence (%) - Asian
Place of birth - Born in state of residence (%) - Hispanic or Latino
Place of birth - Born in state of residence (%) - American Indian and Alaska Native
Place of birth - Born in state of residence (%) - Multirace
Place of birth - Born in state of residence (%) - Other Race
Place of birth - Born in other state (%)
Place of birth - Born in other state (%) - White
Place of birth - Born in other state (%) - Black or African American
Place of birth - Born in other state (%) - Asian
Place of birth - Born in other state (%) - Hispanic or Latino
Place of birth - Born in other state (%) - American Indian and Alaska Native
Place of birth - Born in other state (%) - Multirace
Place of birth - Born in other state (%) - Other Race
Place of birth - Native, outside of US (%)
Place of birth - Native, outside of US (%) - White
Place of birth - Native, outside of US (%) - Black or African American
Place of birth - Native, outside of US (%) - Asian
Place of birth - Native, outside of US (%) - Hispanic or Latino
Place of birth - Native, outside of US (%) - American Indian and Alaska Native
Place of birth - Native, outside of US (%) - Multirace
Place of birth - Native, outside of US (%) - Other Race
Place of birth - Foreign born (%)
Place of birth - Foreign born (%) - White
Place of birth - Foreign born (%) - Black or African American
Place of birth - Foreign born (%) - Asian
Place of birth - Foreign born (%) - Hispanic or Latino
Place of birth - Foreign born (%) - American Indian and Alaska Native
Place of birth - Foreign born (%) - Multirace
Place of birth - Foreign born (%) - Other Race
Residents speaking English at home (%)
Residents speaking English at home - Born in the United States (%)
Residents speaking English at home - Native, born elsewhere (%)
Residents speaking English at home - Foreign born (%)
Residents speaking Spanish at home (%)
Residents speaking Spanish at home - Born in the United States (%)
Residents speaking Spanish at home - Native, born elsewhere (%)
Residents speaking Spanish at home - Foreign born (%)
Residents speaking other language at home (%)
Residents speaking other language at home - Born in the United States (%)
Residents speaking other language at home - Native, born elsewhere (%)
Residents speaking other language at home - Foreign born (%)
Marital status - Never married (%)
Marital status - Now married (%)
Marital status - Separated (%)
Marital status - Widowed (%)
Marital status - Divorced (%)
Ancestries Reported - Arab (%)
Ancestries Reported - Czech (%)
Ancestries Reported - Danish (%)
Ancestries Reported - Dutch (%)
Ancestries Reported - English (%)
Ancestries Reported - French (%)
Ancestries Reported - French Canadian (%)
Ancestries Reported - German (%)
Ancestries Reported - Greek (%)
Ancestries Reported - Hungarian (%)
Ancestries Reported - Irish (%)
Ancestries Reported - Italian (%)
Ancestries Reported - Lithuanian (%)
Ancestries Reported - Norwegian (%)
Ancestries Reported - Polish (%)
Ancestries Reported - Portuguese (%)
Ancestries Reported - Russian (%)
Ancestries Reported - Scotch-Irish (%)
Ancestries Reported - Scottish (%)
Ancestries Reported - Slovak (%)
Ancestries Reported - Subsaharan African (%)
Ancestries Reported - Swedish (%)
Ancestries Reported - Swiss (%)
Ancestries Reported - Ukrainian (%)
Ancestries Reported - United States (%)
Ancestries Reported - Welsh (%)
Ancestries Reported - West Indian (%)
Ancestries Reported - Other (%)
Geographical mobility - Same house 1 year ago (%)
Geographical mobility - Same house 1 year ago (%) - White
Geographical mobility - Same house 1 year ago (%) - Black or African American
Geographical mobility - Same house 1 year ago (%) - Asian
Geographical mobility - Same house 1 year ago (%) - Hispanic or Latino
Geographical mobility - Same house 1 year ago (%) - American Indian and Alaska Native
Geographical mobility - Same house 1 year ago (%) - Multirace
Geographical mobility - Same house 1 year ago (%) - Other Race
Geographical mobility - Moved within same county (%)
Geographical mobility - Moved within same county (%) - White
Geographical mobility - Moved within same county (%) - Black or African American
Geographical mobility - Moved within same county (%) - Asian
Geographical mobility - Moved within same county (%) - Hispanic or Latino
Geographical mobility - Moved within same county (%) - American Indian and Alaska Native
Geographical mobility - Moved within same county (%) - Multirace
Geographical mobility - Moved within same county (%) - Other Race
Geographical mobility - Moved from different county within same state (%)
Geographical mobility - Moved from different county within same state (%) - White
Geographical mobility - Moved from different county within same state (%) - Black or African American
Geographical mobility - Moved from different county within same state (%) - Asian
Geographical mobility - Moved from different county within same state (%) - Hispanic or Latino
Geographical mobility - Moved from different county within same state (%) - American Indian and Alaska Native
Geographical mobility - Moved from different county within same state (%) - Multirace
Geographical mobility - Moved from different county within same state (%) - Other Race
Geographical mobility - Moved from different state (%)
Geographical mobility - Moved from different state (%) - White
Geographical mobility - Moved from different state (%) - Black or African American
Geographical mobility - Moved from different state (%) - Asian
Geographical mobility - Moved from different state (%) - Hispanic or Latino
Geographical mobility - Moved from different state (%) - American Indian and Alaska Native
Geographical mobility - Moved from different state (%) - Multirace
Geographical mobility - Moved from different state (%) - Other Race
Geographical mobility - Moved from abroad (%)
Geographical mobility - Moved from abroad (%) - White
Geographical mobility - Moved from abroad (%) - Black or African American
Geographical mobility - Moved from abroad (%) - Asian
Geographical mobility - Moved from abroad (%) - Hispanic or Latino
Geographical mobility - Moved from abroad (%) - American Indian and Alaska Native
Geographical mobility - Moved from abroad (%) - Multirace
Geographical mobility - Moved from abroad (%) - Other Race
Place of birth for the foreign-born population - Ireland (%)
Place of birth for the foreign-born population - Denmark (%)
Place of birth for the foreign-born population - Norway (%)
Place of birth for the foreign-born population - Sweden (%)
Place of birth for the foreign-born population - United Kingdom (%)
Place of birth for the foreign-born population - England (%)
Place of birth for the foreign-born population - Scotland (%)
Place of birth for the foreign-born population - Other Northern Europe (%)
Place of birth for the foreign-born population - Austria (%)
Place of birth for the foreign-born population - Belgium (%)
Place of birth for the foreign-born population - France (%)
Place of birth for the foreign-born population - Germany (%)
Place of birth for the foreign-born population - Netherlands (%)
Place of birth for the foreign-born population - Switzerland (%)
Place of birth for the foreign-born population - Other Western Europe (%)
Place of birth for the foreign-born population - Greece (%)
Place of birth for the foreign-born population - Italy (%)
Place of birth for the foreign-born population - Portugal (%)
Place of birth for the foreign-born population - Spain (%)
Place of birth for the foreign-born population - Other Southern Europe (%)
Place of birth for the foreign-born population - Albania (%)
Place of birth for the foreign-born population - Belarus (%)
Place of birth for the foreign-born population - Bosnia and Herzegovina (%)
Place of birth for the foreign-born population - Bulgaria (%)
Place of birth for the foreign-born population - Croatia (%)
Place of birth for the foreign-born population - Czechoslovakia (%)
Place of birth for the foreign-born population - Hungary (%)
Place of birth for the foreign-born population - Latvia (%)
Place of birth for the foreign-born population - Lithuania (%)
Place of birth for the foreign-born population - North Macedonia (Macedonia) (%)
Place of birth for the foreign-born population - Moldova (%)
Place of birth for the foreign-born population - Poland (%)
Place of birth for the foreign-born population - Romania (%)
Place of birth for the foreign-born population - Russia (%)
Place of birth for the foreign-born population - Serbia (%)
Place of birth for the foreign-born population - Ukraine (%)
Place of birth for the foreign-born population - Other Eastern Europe (%)
Place of birth for the foreign-born population - China (%)
Place of birth for the foreign-born population - Hong Kong (%)
Place of birth for the foreign-born population - Taiwan (%)
Place of birth for the foreign-born population - Japan (%)
Place of birth for the foreign-born population - Korea (%)
Place of birth for the foreign-born population - Other Eastern Asia (%)
Place of birth for the foreign-born population - Afghanistan (%)
Place of birth for the foreign-born population - Bangladesh (%)
Place of birth for the foreign-born population - India (%)
Place of birth for the foreign-born population - Iran (%)
Place of birth for the foreign-born population - Kazakhstan (%)
Place of birth for the foreign-born population - Nepal (%)
Place of birth for the foreign-born population - Pakistan (%)
Place of birth for the foreign-born population - Sri Lanka (%)
Place of birth for the foreign-born population - Uzbekistan (%)
Place of birth for the foreign-born population - Other South Central Asia (%)
Place of birth for the foreign-born population - Burma (%)
Place of birth for the foreign-born population - Cambodia (%)
Place of birth for the foreign-born population - Indonesia (%)
Place of birth for the foreign-born population - Laos (%)
Place of birth for the foreign-born population - Malaysia (%)
Place of birth for the foreign-born population - Philippines (%)
Place of birth for the foreign-born population - Singapore (%)
Place of birth for the foreign-born population - Thailand (%)
Place of birth for the foreign-born population - Vietnam (%)
Place of birth for the foreign-born population - Other South Eastern Asia (%)
Place of birth for the foreign-born population - Armenia (%)
Place of birth for the foreign-born population - Iraq (%)
Place of birth for the foreign-born population - Israel (%)
Place of birth for the foreign-born population - Jordan (%)
Place of birth for the foreign-born population - Kuwait (%)
Place of birth for the foreign-born population - Lebanon (%)
Place of birth for the foreign-born population - Saudi Arabia (%)
Place of birth for the foreign-born population - Syria (%)
Place of birth for the foreign-born population - Turkey (%)
Place of birth for the foreign-born population - Yemen (%)
Place of birth for the foreign-born population - Other Western Asia (%)
Place of birth for the foreign-born population - Eritrea (%)
Place of birth for the foreign-born population - Ethiopia (%)
Place of birth for the foreign-born population - Kenya (%)
Place of birth for the foreign-born population - Somalia (%)
Place of birth for the foreign-born population - Uganda (%)
Place of birth for the foreign-born population - Zimbabwe (%)
Place of birth for the foreign-born population - Other Eastern Africa (%)
Place of birth for the foreign-born population - Cameroon (%)
Place of birth for the foreign-born population - Congo (%)
Place of birth for the foreign-born population - Democratic Republic of Congo (Zaire) (%)
Place of birth for the foreign-born population - Other Middle Africa (%)
Place of birth for the foreign-born population - Egypt (%)
Place of birth for the foreign-born population - Morocco (%)
Place of birth for the foreign-born population - Sudan (%)
Place of birth for the foreign-born population - Other Northern Africa (%)
Place of birth for the foreign-born population - South Africa (%)
Place of birth for the foreign-born population - Other Southern Africa (%)
Place of birth for the foreign-born population - Cabo Verde (%)
Place of birth for the foreign-born population - Ghana (%)
Place of birth for the foreign-born population - Liberia (%)
Place of birth for the foreign-born population - Nigeria (%)
Place of birth for the foreign-born population - Senegal (%)
Place of birth for the foreign-born population - Sierra Leone (%)
Place of birth for the foreign-born population - Other Western Africa (%)
Place of birth for the foreign-born population - Australia (%)
Place of birth for the foreign-born population - New Zealand (%)
Place of birth for the foreign-born population - Fiji (%)
Place of birth for the foreign-born population - Micronesia (%)
Place of birth for the foreign-born population - Bahamas (%)
Place of birth for the foreign-born population - Barbados (%)
Place of birth for the foreign-born population - Cuba (%)
Place of birth for the foreign-born population - Dominica (%)
Place of birth for the foreign-born population - Dominican Republic (%)
Place of birth for the foreign-born population - Grenada (%)
Place of birth for the foreign-born population - Haiti (%)
Place of birth for the foreign-born population - Jamaica (%)
Place of birth for the foreign-born population - St. Vincent and the Grenadines (%)
Place of birth for the foreign-born population - Trinidad and Tobago (%)
Place of birth for the foreign-born population - West Indies (%)
Place of birth for the foreign-born population - Other Caribbean (%)
Place of birth for the foreign-born population - Belize (%)
Place of birth for the foreign-born population - Costa Rica (%)
Place of birth for the foreign-born population - El Salvador (%)
Place of birth for the foreign-born population - Guatemala (%)
Place of birth for the foreign-born population - Honduras (%)
Place of birth for the foreign-born population - Mexico (%)
Place of birth for the foreign-born population - Nicaragua (%)
Place of birth for the foreign-born population - Panama (%)
Place of birth for the foreign-born population - Other Central America (%)
Place of birth for the foreign-born population - Argentina (%)
Place of birth for the foreign-born population - Bolivia (%)
Place of birth for the foreign-born population - Brazil (%)
Place of birth for the foreign-born population - Chile (%)
Place of birth for the foreign-born population - Colombia (%)
Place of birth for the foreign-born population - Ecuador (%)
Place of birth for the foreign-born population - Guyana (%)
Place of birth for the foreign-born population - Peru (%)
Place of birth for the foreign-born population - Uruguay (%)
Place of birth for the foreign-born population - Venezuela (%)
Place of birth for the foreign-born population - Other South America (%)
Place of birth for the foreign-born population - Canada (%)
Place of birth for the foreign-born population - Other Northern America (%)
Place of birth for the foreign-born population - Other (%)
Latest news about races in Palestine, TX collected exclusively by city-data.com from local newspapers, TV, and radio stations
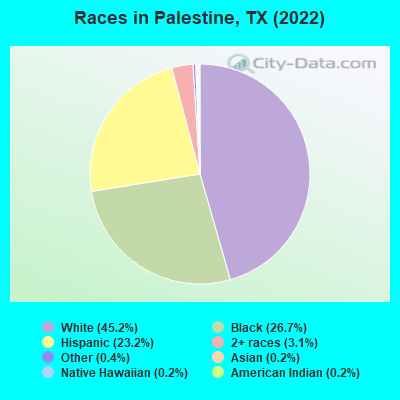
According to 2022 data, the most numerous races in Palestine, TX are Hispanic (4,471 residents), White alone (8,698 residents), and Black alone (5,136 residents). 87.2% of Palestine residents speak English at home. 7.4% of Palestine, TX residents are foreign-born (4.3% born in Latin America, 2.5% born in Africa), which is 131.0% less than the foreign-born rate of 17.0% across the entire state of Texas.
Race distribution in Palestine
2000 2022
10,933,313 52.4% White alone 6,669,666 32.0% Hispanic 2,364,255 11.3% Black alone 554,445 2.7% Asian alone 230,567 1.1% Two or more races 68,859 0.3% American Indian alone 19,958 0.10% Other race alone 10,757 0.05% Native Hawaiian and Other
12,070,642 40.2% Hispanic 11,683,430 38.9% White alone 3,508,706 11.7% Black alone 1,608,173 5.4% Asian alone 956,560 3.2% Two or more races 125,763 0.4% Other race alone 47,023 0.2% American Indian alone 29,275 0.10% Native Hawaiian and Other
Income and house value in Palestine Median household income in 2022 $51,402 White non-Hispanic householders$34,763 Black householders$37,027 American Indian and Alaska Native householders$45,283 Two or more races householders$43,901 Hispanic or Latino race householdersMedian 2022 house value $170,221 White Non-Hispanic householders$108,804 Black or African American householders$172,074 American Indian or Alaska Native householders $233,227 Asian householders$119,128 Native Hawaiian and other Pacific Islander householders$100,862 Some other race householders$33,091 Two or more races householders$103,774 Hispanic or Latino householders
Median age by race in Palestine
37.1 Median age for White residents36.9 37.2 35.2 Median age for Black or African American residents35.1 34.2 32.6 Median age for American Indian / Alaska Native residents16.2 38.9 -681,278,538.1 Median age for Asian residents-683,426,442.5 -679,245,282.3 -581,560,283.1 Median age for Native Hawaiian / Pacific Islander residents-612,729,233.5 -577,777,777.2 23.7 Median age for Other race residents25.3 23.4 26.0 Median age for Two or more races residents21.8 36.9 40.2 Median age for White alone residents41.4 39.5 25.0 Median age for Hispanic or Latino residents22.2 28.6
Owner/renter occupied households by race in Palestine
House owners and renters - White residents 2,275 68.6% Owner occupied1,042 31.4% Renter occupiedHouse owners and renters - Black or African American residents 786 28.9% Owner occupied1,934 71.1% Renter occupiedHouse owners and renters - American Indian / Alaska Native residents 37 71.1% Owner occupied15 28.9% Renter occupiedHouse owners and renters - Asian residents 46 100.0% Owner occupiedHouse owners and renters - Other race residents 110 60.5% Owner occupied72 39.5% Renter occupiedHouse owners and renters - Two or more races residents 509 58.5% Owner occupied361 41.5% Renter occupiedHouse owners and renters - White alone residents 2,160 66.8% Owner occupied1,072 33.2% Renter occupiedHouse owners and renters - Hispanic or Latino residents 804 59.7% Owner occupied543 40.3% Renter occupied
Language usage in Palestine
English speakers - Total 87.2% of residents of Palestine speak English at home.
11.7% of residents speak Spanish at home 1,456 70.0% Speak English very well624 30.0% Speak English less than very well1.0% of residents speak other language at home 149 85.6% Speak English very well25 14.4% Speak English less than very well
English speakers - Born in the United States 97.7% of residents of Palestine speak English at home.
1.9% of residents speak Spanish at home 55 100.0% Speak English very well0.1% of residents speak other language at home 4 100.0% Speak English very well
English speakers - Native, born elsewhere 73.4% of residents of Palestine speak English at home.
24.2% of residents speak Spanish at home 5 16.7% Speak English very well25 83.3% Speak English less than very well
English speakers - Foreign-born 40.2% of residents of Palestine speak English at home.
47.9% of residents speak Spanish at home 291 42.9% Speak English very well387 57.1% Speak English less than very well12.0% of residents speak other language at home 145 85.3% Speak English very well25 14.7% Speak English less than very well
White (Caucasian) - Speak only English Native:
100.0% (8,219)Foreign-born:
56.3% (84)
White (Caucasian) - Speak another language Native:
3.8% (309)Foreign-born:
60.3% (90)
Black or African American - Speak only English Native:
97.3% (4,387)Foreign-born:
64.8% (312)
Black or African American - Speak another language Native:
2.7% (124)Foreign-born:
30.0% (144)
American Indian / Alaska Native - Speak another language Native:
61.8% (59)Foreign-born:
98.9% (23)
Other race - Speak another language Native:
44.0% (227)Foreign-born:
99.5% (63)
Two or more races - Speak only English Native:
67.1% (1,708)Foreign-born:
12.9% (103)
Two or more races - Speak another language Native:
30.1% (765)Foreign-born:
86.7% (687)
White alone - Speak only English Native:
100.0% (8,145)Foreign-born:
27.3% (12)
White alone - Speak another language Native:
0.2% (17)Foreign-born:
72.6% (31)
Hispanic or Latino - Speak only English Native:
56.3% (1,750)Foreign-born:
19.9% (164)
Hispanic or Latino - Speak another language Native:
44.2% (1,374)Foreign-born:
81.3% (670)
Foreign-born residents in Palestine 1,416 residents are foreign born (4.3% Latin America , 2.5% Africa ).
This city:
7.4%Texas:
17.1%
Marital status for residents in Palestine Marital status - White (Caucasian) population 15 years and over
Males 33.5% Never married54.0% Now married0.6% Separated2.5% Widowed9.4% DivorcedFemales 22.5% Never married45.7% Now married3.7% Separated15.4% Widowed12.6% DivorcedWomen who gave birth in the past 12 months Now married:
78.2% (145)Unmarried:
21.8% (40)
Women who did not give birth in the past 12 months Now married:
47.8% (885)Unmarried:
52.2% (966)
Marital status - Black or African American population 15 years and over
Males 40.6% Never married52.0% Now married1.7% Separated1.4% Widowed4.3% DivorcedFemales 34.5% Never married26.7% Now married1.7% Separated14.9% Widowed22.2% DivorcedWomen who gave birth in the past 12 months Now married:
59.1% (13)Unmarried:
40.9% (9)
Women who did not give birth in the past 12 months Now married:
19.9% (214)Unmarried:
80.1% (860)
Marital status - American Indian / Alaska Native population 15 years and over
Males 83.3% Never married16.7% Now married0.0% Separated0.0% Widowed0.0% DivorcedFemales 48.2% Never married14.3% Now married23.2% Separated0.0% Widowed14.3% DivorcedWomen who did not give birth in the past 12 months Now married:
46.4% (19)Unmarried:
53.6% (22)
Marital status - Other race population 15 years and over
Males 46.7% Never married53.3% Now married0.0% Separated0.0% Widowed0.0% DivorcedFemales 48.6% Never married41.1% Now married10.3% Separated0.0% Widowed0.0% DivorcedWomen who gave birth in the past 12 months Now married:
69.2% (25)Unmarried:
30.8% (11)
Women who did not give birth in the past 12 months Now married:
36.4% (60)Unmarried:
63.6% (106)
Marital status - Two or more races population 15 years and over
Males 63.3% Never married35.8% Now married0.0% Separated0.0% Widowed0.9% DivorcedFemales 30.3% Never married44.8% Now married1.2% Separated5.1% Widowed18.6% DivorcedWomen who did not give birth in the past 12 months Now married:
48.0% (634)Unmarried:
52.0% (686)
Marital status - White alone, not Hispanic / Latino population 15 years and over
Males 29.1% Never married57.8% Now married0.7% Separated2.7% Widowed9.6% DivorcedFemales 22.2% Never married44.1% Now married2.5% Separated16.7% Widowed14.5% DivorcedWomen who gave birth in the past 12 months Now married:
72.4% (130)Unmarried:
27.6% (50)
Women who did not give birth in the past 12 months Now married:
41.0% (736)Unmarried:
59.0% (1,059)
Marital status - Hispanic or Latino population 15 years and over
Males 60.9% Never married35.3% Now married0.0% Separated0.3% Widowed3.5% DivorcedFemales 30.9% Never married41.1% Now married6.7% Separated4.5% Widowed16.8% DivorcedWomen who gave birth in the past 12 months Now married:
89.2% (69)Unmarried:
10.8% (8)
Women who did not give birth in the past 12 months Now married:
49.5% (732)Unmarried:
50.5% (746)
Ancestries in Palestine
1,343 11.8% American489 4.3% English367 3.2% Polish203 1.8% Irish157 1.4% German136 1.2% European121 1.1% Nigerian110 1.0% African65 0.6% Norwegian56 0.5% Italian38 0.3% British33 0.3% Greek32 0.3% Scottish30 0.3% Dutch28 0.2% Ghanaian15 0.1% Czech12 0.1% Swiss11 0.10% Russian10 0.09% Guyanese9 0.08% Scotch-Irish8 0.07% Welsh7 0.06% Croatian7 0.06% French
Geographical mobility in Palestine Same house 1 year ago 7,564 89.5% White (Caucasian)3,990 74.9% Black or African American108 89.0% American Indian / Alaska Native43 99.3% Asian41 98.2% Native Hawaiian / Pacific Islander518 75.6% Other race3,300 90.1% Two or more races7,592 88.9% White alone, not Hispanic / Latino4,110 93.5% Hispanic or LatinoMoved within same county 244 2.9% White / Caucasian1,001 18.8% Black or African American4 2.9% American Indian / Alaska Native111 16.1% Other race17 0.5% Two or more races230 2.7% White alone, not Hispanic / Latino123 2.8% Hispanic or LatinoMoved within same state 469 5.5% White / Caucasian201 3.8% Black or African American10 8.4% American Indian / Alaska Native40 5.9% Other race188 5.1% Two or more races508 6.0% White alone, not Hispanic / Latino53 1.2% Hispanic or LatinoMoved from different state 217 2.6% White / Caucasian8 1.1% Other race41 1.1% Two or more races225 2.6% White alone, not Hispanic / Latino39 0.9% Hispanic or LatinoMoved from abroad 21 0.2% White26 0.5% Black or African American138 3.8% Two or more races26 0.3% White alone, not Hispanic / Latino88 2.0% Hispanic or Latino
Children Nativity (place of birth) in Palestine
Children under 6 years - Living with two parents Both parents native 472 100.0% NativeBoth parents foreign-born 98 100.0% NativeOne native, one foreign-born parent 161 100.0% NativeChildren under 6 years - Living with one parent Native parent 861 100.0% NativeForeign-born parent 15 100.0% NativeChildren 6 to 17 years - Living with two parents Both parents native 1,195 100.0% NativeBoth parents foreign-born 237 100.0% NativeOne native, one foreign-born parent 391 100.0% NativeChildren 6 to 17 years - Living with one parent Native parent 1,152 100.0% NativeForeign-born parent 204 50.5% Native201 49.5% Foreign-born
Grandparents responsible for own grandchildren in Palestine
Grandparents (30 to 59 years) White / Caucasian 54 38.2% Responsible for grandchildren87 61.8% Not responsible for grandchildrenBlack or African American 51 71.7% Responsible for grandchildren20 28.3% Not responsible for grandchildrenAmerican Indian / Alaska Native 5 100.0% Not responsible for grandchildrenTwo or more races 51 34.2% Responsible for grandchildren97 65.8% Not responsible for grandchildrenWhite alone, not Hispanic / Latino 71 37.4% Responsible for grandchildren118 62.6% Not responsible for grandchildrenHispanic or Latino 78 100.0% Not responsible for grandchildrenGrandparents (60 years and over) White / Caucasian 11 19.3% Responsible for grandchildren45 80.7% Not responsible for grandchildrenBlack or African American 23 35.4% Responsible for grandchildren41 64.6% Not responsible for grandchildrenWhite alone, not Hispanic / Latino 13 17.1% Responsible for grandchildren62 82.9% Not responsible for grandchildren