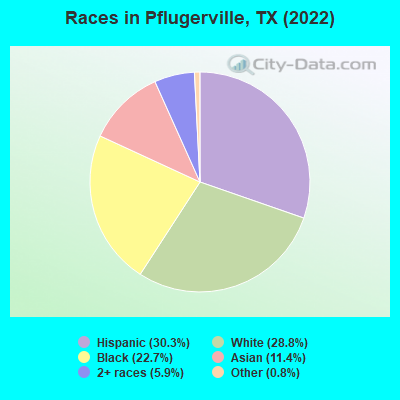
Races in Pflugerville, Texas (TX) Detailed Stats
Data:
Races - White alone (%)
Races - White alone (% change since 2000)
Races - Black alone (%)
Races - Black alone (% change since 2000)
Races - American Indian alone (%)
Races - American Indian alone (% change since 2000)
Races - Asian alone (%)
Races - Asian alone (% change since 2000)
Races - Hispanic (%)
Races - Hispanic (% change since 2000)
Races - Native Hawaiian and Other Pacific Islander alone (%)
Races - Native Hawaiian and Other Pacific Islander alone (% change since 2000)
Races - Two or more races(%)
Races - Two or more races(% change since 2000)
Races - Other race alone (%)
Races - Other race alone (% change since 2000)
Racial diversity
Place of birth - Born in state of residence (%)
Place of birth - Born in state of residence (%) - White
Place of birth - Born in state of residence (%) - Black or African American
Place of birth - Born in state of residence (%) - Asian
Place of birth - Born in state of residence (%) - Hispanic or Latino
Place of birth - Born in state of residence (%) - American Indian and Alaska Native
Place of birth - Born in state of residence (%) - Multirace
Place of birth - Born in state of residence (%) - Other Race
Place of birth - Born in other state (%)
Place of birth - Born in other state (%) - White
Place of birth - Born in other state (%) - Black or African American
Place of birth - Born in other state (%) - Asian
Place of birth - Born in other state (%) - Hispanic or Latino
Place of birth - Born in other state (%) - American Indian and Alaska Native
Place of birth - Born in other state (%) - Multirace
Place of birth - Born in other state (%) - Other Race
Place of birth - Native, outside of US (%)
Place of birth - Native, outside of US (%) - White
Place of birth - Native, outside of US (%) - Black or African American
Place of birth - Native, outside of US (%) - Asian
Place of birth - Native, outside of US (%) - Hispanic or Latino
Place of birth - Native, outside of US (%) - American Indian and Alaska Native
Place of birth - Native, outside of US (%) - Multirace
Place of birth - Native, outside of US (%) - Other Race
Place of birth - Foreign born (%)
Place of birth - Foreign born (%) - White
Place of birth - Foreign born (%) - Black or African American
Place of birth - Foreign born (%) - Asian
Place of birth - Foreign born (%) - Hispanic or Latino
Place of birth - Foreign born (%) - American Indian and Alaska Native
Place of birth - Foreign born (%) - Multirace
Place of birth - Foreign born (%) - Other Race
Residents speaking English at home (%)
Residents speaking English at home - Born in the United States (%)
Residents speaking English at home - Native, born elsewhere (%)
Residents speaking English at home - Foreign born (%)
Residents speaking Spanish at home (%)
Residents speaking Spanish at home - Born in the United States (%)
Residents speaking Spanish at home - Native, born elsewhere (%)
Residents speaking Spanish at home - Foreign born (%)
Residents speaking other language at home (%)
Residents speaking other language at home - Born in the United States (%)
Residents speaking other language at home - Native, born elsewhere (%)
Residents speaking other language at home - Foreign born (%)
Marital status - Never married (%)
Marital status - Now married (%)
Marital status - Separated (%)
Marital status - Widowed (%)
Marital status - Divorced (%)
Ancestries Reported - Arab (%)
Ancestries Reported - Czech (%)
Ancestries Reported - Danish (%)
Ancestries Reported - Dutch (%)
Ancestries Reported - English (%)
Ancestries Reported - French (%)
Ancestries Reported - French Canadian (%)
Ancestries Reported - German (%)
Ancestries Reported - Greek (%)
Ancestries Reported - Hungarian (%)
Ancestries Reported - Irish (%)
Ancestries Reported - Italian (%)
Ancestries Reported - Lithuanian (%)
Ancestries Reported - Norwegian (%)
Ancestries Reported - Polish (%)
Ancestries Reported - Portuguese (%)
Ancestries Reported - Russian (%)
Ancestries Reported - Scotch-Irish (%)
Ancestries Reported - Scottish (%)
Ancestries Reported - Slovak (%)
Ancestries Reported - Subsaharan African (%)
Ancestries Reported - Swedish (%)
Ancestries Reported - Swiss (%)
Ancestries Reported - Ukrainian (%)
Ancestries Reported - United States (%)
Ancestries Reported - Welsh (%)
Ancestries Reported - West Indian (%)
Ancestries Reported - Other (%)
Geographical mobility - Same house 1 year ago (%)
Geographical mobility - Same house 1 year ago (%) - White
Geographical mobility - Same house 1 year ago (%) - Black or African American
Geographical mobility - Same house 1 year ago (%) - Asian
Geographical mobility - Same house 1 year ago (%) - Hispanic or Latino
Geographical mobility - Same house 1 year ago (%) - American Indian and Alaska Native
Geographical mobility - Same house 1 year ago (%) - Multirace
Geographical mobility - Same house 1 year ago (%) - Other Race
Geographical mobility - Moved within same county (%)
Geographical mobility - Moved within same county (%) - White
Geographical mobility - Moved within same county (%) - Black or African American
Geographical mobility - Moved within same county (%) - Asian
Geographical mobility - Moved within same county (%) - Hispanic or Latino
Geographical mobility - Moved within same county (%) - American Indian and Alaska Native
Geographical mobility - Moved within same county (%) - Multirace
Geographical mobility - Moved within same county (%) - Other Race
Geographical mobility - Moved from different county within same state (%)
Geographical mobility - Moved from different county within same state (%) - White
Geographical mobility - Moved from different county within same state (%) - Black or African American
Geographical mobility - Moved from different county within same state (%) - Asian
Geographical mobility - Moved from different county within same state (%) - Hispanic or Latino
Geographical mobility - Moved from different county within same state (%) - American Indian and Alaska Native
Geographical mobility - Moved from different county within same state (%) - Multirace
Geographical mobility - Moved from different county within same state (%) - Other Race
Geographical mobility - Moved from different state (%)
Geographical mobility - Moved from different state (%) - White
Geographical mobility - Moved from different state (%) - Black or African American
Geographical mobility - Moved from different state (%) - Asian
Geographical mobility - Moved from different state (%) - Hispanic or Latino
Geographical mobility - Moved from different state (%) - American Indian and Alaska Native
Geographical mobility - Moved from different state (%) - Multirace
Geographical mobility - Moved from different state (%) - Other Race
Geographical mobility - Moved from abroad (%)
Geographical mobility - Moved from abroad (%) - White
Geographical mobility - Moved from abroad (%) - Black or African American
Geographical mobility - Moved from abroad (%) - Asian
Geographical mobility - Moved from abroad (%) - Hispanic or Latino
Geographical mobility - Moved from abroad (%) - American Indian and Alaska Native
Geographical mobility - Moved from abroad (%) - Multirace
Geographical mobility - Moved from abroad (%) - Other Race
Place of birth for the foreign-born population - Ireland (%)
Place of birth for the foreign-born population - Denmark (%)
Place of birth for the foreign-born population - Norway (%)
Place of birth for the foreign-born population - Sweden (%)
Place of birth for the foreign-born population - United Kingdom (%)
Place of birth for the foreign-born population - England (%)
Place of birth for the foreign-born population - Scotland (%)
Place of birth for the foreign-born population - Other Northern Europe (%)
Place of birth for the foreign-born population - Austria (%)
Place of birth for the foreign-born population - Belgium (%)
Place of birth for the foreign-born population - France (%)
Place of birth for the foreign-born population - Germany (%)
Place of birth for the foreign-born population - Netherlands (%)
Place of birth for the foreign-born population - Switzerland (%)
Place of birth for the foreign-born population - Other Western Europe (%)
Place of birth for the foreign-born population - Greece (%)
Place of birth for the foreign-born population - Italy (%)
Place of birth for the foreign-born population - Portugal (%)
Place of birth for the foreign-born population - Spain (%)
Place of birth for the foreign-born population - Other Southern Europe (%)
Place of birth for the foreign-born population - Albania (%)
Place of birth for the foreign-born population - Belarus (%)
Place of birth for the foreign-born population - Bosnia and Herzegovina (%)
Place of birth for the foreign-born population - Bulgaria (%)
Place of birth for the foreign-born population - Croatia (%)
Place of birth for the foreign-born population - Czechoslovakia (%)
Place of birth for the foreign-born population - Hungary (%)
Place of birth for the foreign-born population - Latvia (%)
Place of birth for the foreign-born population - Lithuania (%)
Place of birth for the foreign-born population - North Macedonia (Macedonia) (%)
Place of birth for the foreign-born population - Moldova (%)
Place of birth for the foreign-born population - Poland (%)
Place of birth for the foreign-born population - Romania (%)
Place of birth for the foreign-born population - Russia (%)
Place of birth for the foreign-born population - Serbia (%)
Place of birth for the foreign-born population - Ukraine (%)
Place of birth for the foreign-born population - Other Eastern Europe (%)
Place of birth for the foreign-born population - China (%)
Place of birth for the foreign-born population - Hong Kong (%)
Place of birth for the foreign-born population - Taiwan (%)
Place of birth for the foreign-born population - Japan (%)
Place of birth for the foreign-born population - Korea (%)
Place of birth for the foreign-born population - Other Eastern Asia (%)
Place of birth for the foreign-born population - Afghanistan (%)
Place of birth for the foreign-born population - Bangladesh (%)
Place of birth for the foreign-born population - India (%)
Place of birth for the foreign-born population - Iran (%)
Place of birth for the foreign-born population - Kazakhstan (%)
Place of birth for the foreign-born population - Nepal (%)
Place of birth for the foreign-born population - Pakistan (%)
Place of birth for the foreign-born population - Sri Lanka (%)
Place of birth for the foreign-born population - Uzbekistan (%)
Place of birth for the foreign-born population - Other South Central Asia (%)
Place of birth for the foreign-born population - Burma (%)
Place of birth for the foreign-born population - Cambodia (%)
Place of birth for the foreign-born population - Indonesia (%)
Place of birth for the foreign-born population - Laos (%)
Place of birth for the foreign-born population - Malaysia (%)
Place of birth for the foreign-born population - Philippines (%)
Place of birth for the foreign-born population - Singapore (%)
Place of birth for the foreign-born population - Thailand (%)
Place of birth for the foreign-born population - Vietnam (%)
Place of birth for the foreign-born population - Other South Eastern Asia (%)
Place of birth for the foreign-born population - Armenia (%)
Place of birth for the foreign-born population - Iraq (%)
Place of birth for the foreign-born population - Israel (%)
Place of birth for the foreign-born population - Jordan (%)
Place of birth for the foreign-born population - Kuwait (%)
Place of birth for the foreign-born population - Lebanon (%)
Place of birth for the foreign-born population - Saudi Arabia (%)
Place of birth for the foreign-born population - Syria (%)
Place of birth for the foreign-born population - Turkey (%)
Place of birth for the foreign-born population - Yemen (%)
Place of birth for the foreign-born population - Other Western Asia (%)
Place of birth for the foreign-born population - Eritrea (%)
Place of birth for the foreign-born population - Ethiopia (%)
Place of birth for the foreign-born population - Kenya (%)
Place of birth for the foreign-born population - Somalia (%)
Place of birth for the foreign-born population - Uganda (%)
Place of birth for the foreign-born population - Zimbabwe (%)
Place of birth for the foreign-born population - Other Eastern Africa (%)
Place of birth for the foreign-born population - Cameroon (%)
Place of birth for the foreign-born population - Congo (%)
Place of birth for the foreign-born population - Democratic Republic of Congo (Zaire) (%)
Place of birth for the foreign-born population - Other Middle Africa (%)
Place of birth for the foreign-born population - Egypt (%)
Place of birth for the foreign-born population - Morocco (%)
Place of birth for the foreign-born population - Sudan (%)
Place of birth for the foreign-born population - Other Northern Africa (%)
Place of birth for the foreign-born population - South Africa (%)
Place of birth for the foreign-born population - Other Southern Africa (%)
Place of birth for the foreign-born population - Cabo Verde (%)
Place of birth for the foreign-born population - Ghana (%)
Place of birth for the foreign-born population - Liberia (%)
Place of birth for the foreign-born population - Nigeria (%)
Place of birth for the foreign-born population - Senegal (%)
Place of birth for the foreign-born population - Sierra Leone (%)
Place of birth for the foreign-born population - Other Western Africa (%)
Place of birth for the foreign-born population - Australia (%)
Place of birth for the foreign-born population - New Zealand (%)
Place of birth for the foreign-born population - Fiji (%)
Place of birth for the foreign-born population - Micronesia (%)
Place of birth for the foreign-born population - Bahamas (%)
Place of birth for the foreign-born population - Barbados (%)
Place of birth for the foreign-born population - Cuba (%)
Place of birth for the foreign-born population - Dominica (%)
Place of birth for the foreign-born population - Dominican Republic (%)
Place of birth for the foreign-born population - Grenada (%)
Place of birth for the foreign-born population - Haiti (%)
Place of birth for the foreign-born population - Jamaica (%)
Place of birth for the foreign-born population - St. Vincent and the Grenadines (%)
Place of birth for the foreign-born population - Trinidad and Tobago (%)
Place of birth for the foreign-born population - West Indies (%)
Place of birth for the foreign-born population - Other Caribbean (%)
Place of birth for the foreign-born population - Belize (%)
Place of birth for the foreign-born population - Costa Rica (%)
Place of birth for the foreign-born population - El Salvador (%)
Place of birth for the foreign-born population - Guatemala (%)
Place of birth for the foreign-born population - Honduras (%)
Place of birth for the foreign-born population - Mexico (%)
Place of birth for the foreign-born population - Nicaragua (%)
Place of birth for the foreign-born population - Panama (%)
Place of birth for the foreign-born population - Other Central America (%)
Place of birth for the foreign-born population - Argentina (%)
Place of birth for the foreign-born population - Bolivia (%)
Place of birth for the foreign-born population - Brazil (%)
Place of birth for the foreign-born population - Chile (%)
Place of birth for the foreign-born population - Colombia (%)
Place of birth for the foreign-born population - Ecuador (%)
Place of birth for the foreign-born population - Guyana (%)
Place of birth for the foreign-born population - Peru (%)
Place of birth for the foreign-born population - Uruguay (%)
Place of birth for the foreign-born population - Venezuela (%)
Place of birth for the foreign-born population - Other South America (%)
Place of birth for the foreign-born population - Canada (%)
Place of birth for the foreign-born population - Other Northern America (%)
Place of birth for the foreign-born population - Other (%)
Latest news about races in Pflugerville, TX collected exclusively by city-data.com from local newspapers, TV, and radio stations
According to 2022 data, the most numerous races in Pflugerville, TX are Hispanic (19,795 residents), White alone (18,799 residents), and Black alone (14,866 residents). 74.7% of Pflugerville residents speak English at home. 16.0% of Pflugerville, TX residents are foreign-born (8.5% born in Latin America, 4.8% born in Asia), which is 6.5% less than the foreign-born rate of 17.0% across the entire state of Texas.
Race distribution in Pflugerville
2000 2022
10,933,313 52.4% White alone 6,669,666 32.0% Hispanic 2,364,255 11.3% Black alone 554,445 2.7% Asian alone 230,567 1.1% Two or more races 68,859 0.3% American Indian alone 19,958 0.10% Other race alone 10,757 0.05% Native Hawaiian and Other
12,070,642 40.2% Hispanic 11,683,430 38.9% White alone 3,508,706 11.7% Black alone 1,608,173 5.4% Asian alone 956,560 3.2% Two or more races 125,763 0.4% Other race alone 47,023 0.2% American Indian alone 29,275 0.10% Native Hawaiian and Other
Income and house value in Pflugerville Median household income in 2022 $121,770 White non-Hispanic householders$101,787 Black householders$129,690 Asian householders$81,989 Some other race householders$117,447 Two or more races householders$101,911 Hispanic or Latino race householdersMedian 2022 house value $409,535 White Non-Hispanic householders$445,362 Black or African American householders$535,546 American Indian or Alaska Native householders $435,478 Asian householders$400,887 Some other race householders$446,597 Two or more races householders$421,271 Hispanic or Latino householders
Median age by race in Pflugerville
46.1 Median age for White residents40.8 48.4 29.0 Median age for Black or African American residents33.1 20.0 -666,666,666.0 Median age for American Indian / Alaska Native residents-666,666,666.0 -666,666,666.0 36.4 Median age for Asian residents39.7 34.8 -666,666,666.0 Median age for Native Hawaiian / Pacific Islander residents-666,666,666.0 -666,666,666.0 32.9 Median age for Other race residents27.8 35.6 35.9 Median age for Two or more races residents34.8 36.7 48.1 Median age for White alone residents46.5 48.6 32.9 Median age for Hispanic or Latino residents31.7 35.8
Owner/renter occupied households by race in Pflugerville
House owners and renters - White residents 8,248 73.8% Owner occupied2,931 26.2% Renter occupiedHouse owners and renters - Black or African American residents 2,021 46.9% Owner occupied2,292 53.1% Renter occupiedHouse owners and renters - American Indian / Alaska Native residents 36 57.6% Owner occupied26 42.4% Renter occupiedHouse owners and renters - Asian residents 2,120 83.4% Owner occupied422 16.6% Renter occupiedHouse owners and renters - Native Hawaiian / Pacific Islander residents 55 100.0% Renter occupiedHouse owners and renters - Other race residents 1,138 61.1% Owner occupied726 38.9% Renter occupiedHouse owners and renters - Two or more races residents 2,652 63.2% Owner occupied1,541 36.8% Renter occupiedHouse owners and renters - White alone residents 7,141 74.3% Owner occupied2,466 25.7% Renter occupiedHouse owners and renters - Hispanic or Latino residents 3,818 59.0% Owner occupied2,650 41.0% Renter occupied
Language usage in Pflugerville
English speakers - Total 74.7% of residents of Pflugerville speak English at home.
13.4% of residents speak Spanish at home 5,669 68.6% Speak English very well2,597 31.4% Speak English less than very well11.9% of residents speak other language at home 4,617 62.9% Speak English very well2,726 37.1% Speak English less than very well
English speakers - Born in the United States 91.2% of residents of Pflugerville speak English at home.
5.5% of residents speak Spanish at home 573 60.5% Speak English very well374 39.5% Speak English less than very well3.3% of residents speak other language at home 577 100.0% Speak English very well
English speakers - Native, born elsewhere 64.3% of residents of Pflugerville speak English at home.
35.7% of residents speak Spanish at home 290 81.5% Speak English very well66 18.5% Speak English less than very well
English speakers - Foreign-born 27.8% of residents of Pflugerville speak English at home.
23.7% of residents speak Spanish at home 1,385 47.2% Speak English very well1,548 52.8% Speak English less than very well48.5% of residents speak other language at home 3,285 54.6% Speak English very well2,726 45.4% Speak English less than very well
White (Caucasian) - Speak only English Native:
93.5% (18,926)Foreign-born:
39.9% (773)
White (Caucasian) - Speak another language Native:
6.5% (1,310)Foreign-born:
60.1% (1,163)
Black or African American - Speak only English Native:
94.3% (9,424)Foreign-born:
26.0% (179)
Black or African American - Speak another language Native:
5.7% (570)Foreign-born:
74.0% (509)
Asian - Speak only English Native:
50.8% (1,024)Foreign-born:
8.0% (386)
Asian - Speak another language Native:
49.2% (991)Foreign-born:
92.0% (4,425)
Native Hawaiian / Pacific Islander - Speak only English Native:
98.9% (56)Foreign-born:
51.5% (10)
Other race - Speak only English Native:
57.2% (2,915)Foreign-born:
24.7% (220)
Other race - Speak another language Native:
42.8% (2,181)Foreign-born:
75.3% (670)
Two or more races - Speak only English Native:
77.6% (6,470)Foreign-born:
45.5% (1,806)
Two or more races - Speak another language Native:
22.4% (1,871)Foreign-born:
54.5% (2,165)
White alone - Speak only English Native:
99.0% (16,694)Foreign-born:
45.2% (700)
White alone - Speak another language Native:
1.0% (173)Foreign-born:
54.8% (847)
Hispanic or Latino - Speak only English Native:
61.6% (8,469)Foreign-born:
38.8% (1,859)
Hispanic or Latino - Speak another language Native:
38.4% (5,285)Foreign-born:
61.2% (2,933)
Foreign-born residents in Pflugerville 10,603 residents are foreign born (8.5% Latin America , 4.8% Asia ).
This city:
16.0%Texas:
17.1%
Marital status for residents in Pflugerville Marital status - White (Caucasian) population 15 years and over
Males 29.6% Never married54.6% Now married0.6% Separated3.2% Widowed12.1% DivorcedFemales 19.7% Never married49.0% Now married0.5% Separated9.2% Widowed21.6% DivorcedWomen who gave birth in the past 12 months Now married:
100.0% (136)Unmarried:
0.0% (0)
Women who did not give birth in the past 12 months Now married:
43.6% (2,123)Unmarried:
56.4% (2,749)
Marital status - Black or African American population 15 years and over
Males 42.2% Never married46.6% Now married3.3% Separated6.9% Widowed1.0% DivorcedFemales 52.2% Never married29.5% Now married0.5% Separated4.8% Widowed13.0% DivorcedWomen who gave birth in the past 12 months Now married:
100.0% (576)Unmarried:
0.0% (0)
Women who did not give birth in the past 12 months Now married:
22.6% (888)Unmarried:
77.4% (3,035)
Marital status - American Indian / Alaska Native population 15 years and over
Males 0.0% Never married68.3% Now married0.0% Separated0.0% Widowed31.7% DivorcedFemales 68.4% Never married31.6% Now married0.0% Separated0.0% Widowed0.0% DivorcedWomen who did not give birth in the past 12 months Now married:
31.6% (9)Unmarried:
68.4% (19)
Marital status - Asian population 15 years and over
Males 16.5% Never married81.6% Now married0.0% Separated0.0% Widowed1.9% DivorcedFemales 25.6% Never married63.4% Now married0.6% Separated7.2% Widowed3.3% DivorcedWomen who gave birth in the past 12 months Now married:
69.9% (135)Unmarried:
30.1% (58)
Women who did not give birth in the past 12 months Now married:
64.4% (1,270)Unmarried:
35.6% (703)
Marital status - Native Hawaiian / Pacific Islander population 15 years and over
Males 100.0% Never married0.0% Now married0.0% Separated0.0% Widowed0.0% DivorcedFemales 0.0% Never married100.0% Now married0.0% Separated0.0% Widowed0.0% DivorcedMarital status - Other race population 15 years and over
Males 36.5% Never married57.4% Now married0.0% Separated0.0% Widowed6.0% DivorcedFemales 32.7% Never married47.3% Now married10.5% Separated0.8% Widowed8.8% DivorcedWomen who gave birth in the past 12 months Now married:
65.7% (51)Unmarried:
34.3% (27)
Women who did not give birth in the past 12 months Now married:
48.8% (772)Unmarried:
51.2% (810)
Marital status - Two or more races population 15 years and over
Males 31.0% Never married57.5% Now married0.4% Separated1.7% Widowed9.3% DivorcedFemales 27.7% Never married47.2% Now married4.0% Separated2.4% Widowed18.8% DivorcedWomen who gave birth in the past 12 months Now married:
100.0% (253)Unmarried:
0.0% (0)
Women who did not give birth in the past 12 months Now married:
40.2% (1,362)Unmarried:
59.8% (2,027)
Marital status - White alone, not Hispanic / Latino population 15 years and over
Males 27.8% Never married55.7% Now married0.7% Separated3.2% Widowed12.6% DivorcedFemales 19.1% Never married50.3% Now married0.5% Separated9.7% Widowed20.3% DivorcedWomen who gave birth in the past 12 months Now married:
100.0% (136)Unmarried:
0.0% (0)
Women who did not give birth in the past 12 months Now married:
41.4% (1,728)Unmarried:
58.6% (2,444)
Marital status - Hispanic or Latino population 15 years and over
Males 41.0% Never married55.7% Now married0.0% Separated1.4% Widowed1.9% DivorcedFemales 30.5% Never married53.0% Now married3.0% Separated2.2% Widowed11.3% DivorcedWomen who gave birth in the past 12 months Now married:
93.3% (323)Unmarried:
6.7% (23)
Women who did not give birth in the past 12 months Now married:
50.4% (2,832)Unmarried:
49.6% (2,783)
Ancestries in Pflugerville
2,371 7.0% English1,843 5.4% American1,198 3.5% German1,024 3.0% Jordanian771 2.3% European573 1.7% Irish501 1.5% Italian355 1.0% Scottish349 1.0% African333 1.0% Eastern European165 0.5% French Canadian161 0.5% Norwegian156 0.5% French140 0.4% Polish130 0.4% Nigerian116 0.3% British115 0.3% Lebanese105 0.3% Swedish82 0.2% Scotch-Irish76 0.2% Belizean71 0.2% Welsh65 0.2% Czech61 0.2% Brazilian58 0.2% Icelander57 0.2% Arab51 0.2% Moroccan50 0.1% Northern European50 0.1% Portuguese47 0.1% Czechoslovakian43 0.1% Russian39 0.1% Haitian32 0.09% Turkish31 0.09% Palestinian29 0.09% Ukrainian28 0.08% Slovene22 0.06% Yugoslavian19 0.06% Slavic13 0.04% Dutch10 0.03% Finnish9 0.03% Iranian9 0.03% Scandinavian9 0.03% Serbian9 0.03% Hungarian9 0.03% Greek3 0.01% Canadian
Geographical mobility in Pflugerville Same house 1 year ago 21,285 92.5% White (Caucasian)10,268 92.6% Black or African American152 100.0% American Indian / Alaska Native4,945 84.5% Asian21 27.4% Native Hawaiian / Pacific Islander3,806 84.8% Other race13,267 87.3% Two or more races17,493 93.3% White alone, not Hispanic / Latino18,722 86.8% Hispanic or LatinoMoved within same county 569 2.5% White / Caucasian487 4.4% Black or African American271 4.6% Asian25 32.0% Native Hawaiian / Pacific Islander482 10.8% Other race1,716 11.3% Two or more races401 2.1% White alone, not Hispanic / Latino1,665 7.7% Hispanic or LatinoMoved within same state 527 2.3% White / Caucasian273 2.5% Black or African American35 0.6% Asian60 1.3% Other race124 0.8% Two or more races527 2.8% White alone, not Hispanic / Latino824 3.8% Hispanic or LatinoMoved from different state 640 2.8% White / Caucasian321 2.9% Black or African American631 10.8% Asian105 0.7% Two or more races328 1.7% White alone, not Hispanic / Latino335 1.6% Hispanic or LatinoMoved from abroad 13 0.2% Asian34 0.7% Other race75 0.3% Hispanic or Latino
Children Nativity (place of birth) in Pflugerville
Children under 6 years - Living with two parents Both parents native 1,536 100.0% NativeBoth parents foreign-born 242 80.7% Native58 19.3% Foreign-bornOne native, one foreign-born parent 968 100.0% NativeChildren under 6 years - Living with one parent Native parent 1,333 100.0% NativeForeign-born parent 207 100.0% NativeChildren 6 to 17 years - Living with two parents Both parents native 6,610 100.0% NativeBoth parents foreign-born 983 91.3% Native94 8.7% Foreign-bornOne native, one foreign-born parent 792 100.0% NativeChildren 6 to 17 years - Living with one parent Native parent 3,373 100.0% NativeForeign-born parent 669 50.0% Native669 50.0% Foreign-born
Grandparents responsible for own grandchildren in Pflugerville
Grandparents (30 to 59 years) White / Caucasian 93 59.5% Responsible for grandchildren63 40.5% Not responsible for grandchildrenBlack or African American 30 34.0% Responsible for grandchildren58 66.0% Not responsible for grandchildrenAsian 7 100.0% Not responsible for grandchildrenOther race 84 97.4% Responsible for grandchildren2 2.6% Not responsible for grandchildrenTwo or more races 31 100.0% Not responsible for grandchildrenWhite alone, not Hispanic / Latino 149 74.3% Responsible for grandchildren52 25.7% Not responsible for grandchildrenHispanic or Latino 114 88.7% Responsible for grandchildren14 11.3% Not responsible for grandchildrenGrandparents (60 years and over) White / Caucasian 131 26.5% Responsible for grandchildren365 73.5% Not responsible for grandchildrenBlack or African American 15 100.0% Not responsible for grandchildrenAsian 12 17.5% Responsible for grandchildren58 82.5% Not responsible for grandchildrenOther race 55 100.0% Not responsible for grandchildrenTwo or more races 49 100.0% Not responsible for grandchildrenWhite alone, not Hispanic / Latino 102 27.8% Responsible for grandchildren265 72.2% Not responsible for grandchildrenHispanic or Latino 81 23.0% Responsible for grandchildren273 77.0% Not responsible for grandchildren