Races in Reading, Ohio (OH) Detailed Stats
Ancestries, Foreign-born residents, place of birth
Settings
X


Recent posts about races in Reading, Ohio on our local forum with over 2,400,000 registered users:
 | Ticks / Lyme Disease in NE Ohio (24 replies) |
| Where would be a good place for an African to live in Cincinnati (13 replies) |
| Seafood Restaurant in North Avondale (6 replies) |
| North Avondale - nice on the prime streets or still too dangerous? (113 replies) |
| Anyone know the history of Reading Rd.? (22 replies) |
| Commercial building on Reading Road (9 replies) |
Latest news about races in Reading, OH collected exclusively by city-data.com from local newspapers, TV, and radio stations
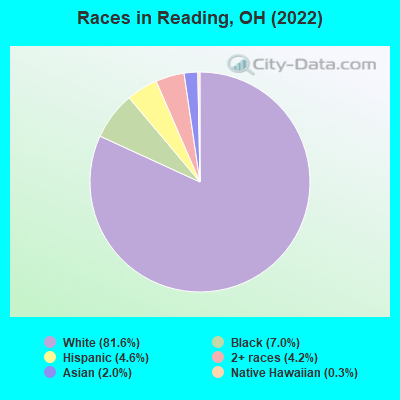
According to 2022 data, the most numerous races in Reading, OH are White alone (8,567 residents), Black alone (736 residents), and Two or more races (440 residents). 93.6% of Reading residents speak English at home. 5.1% of Reading, OH residents are foreign-born (2.5% born in Latin America, 1.1% born in Africa, 0.8% born in Asia), which is 20.8% greater than the foreign-born rate of 4.0% across the entire state of Ohio.
Race distribution in Reading
2000
2022

- 10,53993.3%White alone
- 3533.1%Black alone
- 1371.2%Two or more races
- 1331.2%Asian alone
- 890.8%Hispanic
- 230.2%Other race alone
- 160.1%American Indian alone
- 20.02%Native Hawaiian and Other
Pacific Islander alone

-
- 8,56781.6%White alone
- 7367.0%Black alone
- 4824.6%Hispanic
- 4404.2%Two or more races
- 2052.0%Asian alone
- 310.3%Native Hawaiian and Other
Pacific Islander alone - 60.06%American Indian alone
- 10.01%Other race alone
2000
2022
-
- 9,538,11184.0%White alone
- 1,290,66211.4%Black alone
- 217,1231.9%Hispanic
- 137,7701.2%Two or more races
- 131,6701.2%Asian alone
- 21,9850.2%American Indian alone
- 13,4830.1%Other race alone
- 2,3360.02%Native Hawaiian and Other
Pacific Islander alone

-
- 8,948,79376.1%White alone
- 1,401,40311.9%Black alone
- 529,2914.5%Two or more races
- 517,2324.4%Hispanic
- 293,3872.5%Asian alone
- 52,8050.4%Other race alone
- 9,7850.08%American Indian alone
- 3,3620.03%Native Hawaiian and Other
Pacific Islander alone

Income and house value in Reading
- Median household income in 2022
- $58,421White non-Hispanic householders
- $60,243Black householders
- $57,970Two or more races householders
- $118,148Hispanic or Latino race householders
- Median 2022 house value
- $192,427White Non-Hispanic householders
- $270,319American Indian or Alaska Native householders
- $275,325Asian householders
- $225,266Some other race householders
- $168,599Two or more races householders
- $237,880Hispanic or Latino householders
Household income for White non-Hispanic householders

Household income for Black householders

Household income for Asian householders

Household income for Two or more races householders

Household income for Hispanic or Latino race householders

Median age by race in Reading
- 46.8Median age for White residents
- 42.4Males
- 51.3Females
- 27.7Median age for Black or African American residents
- 26.9Males
- 34.7Females
- -666,666,666.0Median age for American Indian / Alaska Native residents
- -622,116,148.9Males
- -871,212,120.3Females
- 11.0Median age for Asian residents
- 17.0Males
- 10.5Females
- -800,387,596.1Median age for Native Hawaiian / Pacific Islander residents
- -750,242,953.6Males
- -805,394,989.6Females
- 37.4Median age for Other race residents
- -583,333,332.8Males
- 22.7Females
- 18.0Median age for Two or more races residents
- 29.8Males
- 16.7Females
- 47.3Median age for White alone residents
- 42.5Males
- 51.6Females
- 28.0Median age for Hispanic or Latino residents
- 47.3Males
- 27.4Females
Owner/renter occupied households by race in Reading
- House owners and renters - White residents
- 2,79964.9%Owner occupied
- 1,51135.1%Renter occupied
- House owners and renters - Black or African American residents
- 307.9%Owner occupied
- 34792.1%Renter occupied
- House owners and renters - Asian residents
- 2561.4%Owner occupied
- 1638.6%Renter occupied
- House owners and renters - Native Hawaiian / Pacific Islander residents
- 43100.0%Renter occupied
- House owners and renters - Other race residents
- 43100.0%Owner occupied
- House owners and renters - Two or more races residents
- 6540.4%Owner occupied
- 9659.6%Renter occupied
- House owners and renters - White alone residents
- 2,75364.6%Owner occupied
- 1,50635.4%Renter occupied
- House owners and renters - Hispanic or Latino residents
- 12982.8%Owner occupied
- 2717.2%Renter occupied
Language usage in Reading
- English speakers - Total
- 93.6% of residents of Reading speak English at home.
- 3.0% of residents speak Spanish at home
- 16053.9%Speak English very well
- 13746.1%Speak English less than very well
- 3.4% of residents speak other language at home
- 26477.9%Speak English very well
- 7522.1%Speak English less than very well
- English speakers - Born in the United States
- 99.8% of residents of Reading speak English at home.
- 0.1% of residents speak other language at home
- 1100.0%Speak English very well
- English speakers - Native, born elsewhere
- 96.8% of residents of Reading speak English at home.
- 7.1% of residents speak other language at home
- 11100.0%Speak English very well
- English speakers - Foreign-born
- 16.8% of residents of Reading speak English at home.
- 52.3% of residents speak Spanish at home
- 12646.0%Speak English very well
- 14854.0%Speak English less than very well
- 31.7% of residents speak other language at home
- 10060.2%Speak English very well
- 6639.8%Speak English less than very well
White (Caucasian) - Speak only English
| Native: | 99.2% (8,166) |
| Foreign-born: | 28.1% (23) |
White (Caucasian) - Speak another language
| Native: | 0.8% (65) |
| Foreign-born: | 70.2% (58) |
Black or African American - Speak only English
| Native: | 100.0% (562) |
| Foreign-born: | 29.0% (28) |
Asian - Speak only English
| Native: | 24.9% (25) |
| Foreign-born: | 25.8% (19) |
Asian - Speak another language
| Native: | 64.1% (64) |
| Foreign-born: | 75.0% (56) |
Two or more races - Speak only English
| Native: | 91.7% (349) |
| Foreign-born: | 50.0% (21) |
Two or more races - Speak another language
| Native: | 7.1% (27) |
| Foreign-born: | 55.1% (23) |
White alone - Speak only English
| Native: | 99.0% (8,086) |
| Foreign-born: | 50.5% (25) |
White alone - Speak another language
| Native: | 0.9% (74) |
| Foreign-born: | 49.3% (24) |
Foreign-born residents in Reading
530 residents are foreign born (2.5% Latin America, 1.1% Africa, 0.8% Asia).
| This city: | 5.1% |
| Ohio: | 4.9% |


Marital status for residents in Reading
Marital status - White (Caucasian) population 15 years and over
- Males
- 32.5%Never married
- 47.9%Now married
- 3.2%Separated
- 1.7%Widowed
- 14.7%Divorced
- Females
- 27.3%Never married
- 46.4%Now married
- 3.3%Separated
- 4.7%Widowed
- 18.3%Divorced
Women who gave birth in the past 12 months
| Now married: | 57.4% (38) |
| Unmarried: | 42.6% (28) |
Women who did not give birth in the past 12 months
| Now married: | 39.1% (630) |
| Unmarried: | 60.9% (981) |
Marital status - Black or African American population 15 years and over
- Males
- 64.2%Never married
- 29.4%Now married
- 0.0%Separated
- 0.0%Widowed
- 6.4%Divorced
- Females
- 55.3%Never married
- 17.5%Now married
- 0.0%Separated
- 0.0%Widowed
- 27.3%Divorced
Women who did not give birth in the past 12 months
| Now married: | 21.9% (48) |
| Unmarried: | 78.1% (169) |
Marital status - Asian population 15 years and over
- Males
- 47.1%Never married
- 52.9%Now married
- 0.0%Separated
- 0.0%Widowed
- 0.0%Divorced
- Females
- 41.0%Never married
- 59.0%Now married
- 0.0%Separated
- 0.0%Widowed
- 0.0%Divorced
Women who did not give birth in the past 12 months
| Now married: | 59.0% (23) |
| Unmarried: | 41.0% (16) |
Marital status - Other race population 15 years and over
- Males
- 1.5%Never married
- 98.5%Now married
- 0.0%Separated
- 0.0%Widowed
- 0.0%Divorced
- Females
- 66.2%Never married
- 33.8%Now married
- 0.0%Separated
- 0.0%Widowed
- 0.0%Divorced
Women who did not give birth in the past 12 months
| Now married: | 31.5% (60) |
| Unmarried: | 68.5% (131) |
Marital status - Two or more races population 15 years and over
- Males
- 28.4%Never married
- 45.1%Now married
- 0.0%Separated
- 0.0%Widowed
- 26.5%Divorced
- Females
- 49.6%Never married
- 49.6%Now married
- 0.0%Separated
- 0.0%Widowed
- 0.8%Divorced
Women who did not give birth in the past 12 months
| Now married: | 53.3% (72) |
| Unmarried: | 46.7% (63) |
Marital status - White alone, not Hispanic / Latino population 15 years and over
- Males
- 32.7%Never married
- 47.8%Now married
- 3.3%Separated
- 1.8%Widowed
- 14.5%Divorced
- Females
- 27.1%Never married
- 47.1%Now married
- 3.4%Separated
- 4.8%Widowed
- 17.6%Divorced
Women who gave birth in the past 12 months
| Now married: | 57.4% (38) |
| Unmarried: | 42.6% (28) |
Women who did not give birth in the past 12 months
| Now married: | 39.5% (618) |
| Unmarried: | 60.5% (946) |
Marital status - Hispanic or Latino population 15 years and over
- Males
- 0.0%Never married
- 88.5%Now married
- 0.0%Separated
- 0.0%Widowed
- 11.5%Divorced
- Females
- 54.7%Never married
- 27.9%Now married
- 0.0%Separated
- 0.0%Widowed
- 17.4%Divorced
Women who did not give birth in the past 12 months
| Now married: | 30.8% (71) |
| Unmarried: | 69.2% (160) |
Ancestries in Reading

- 1,34827.9%German
- 82117.0%American
- 4419.1%English
- 4098.5%Irish
- 1443.0%Senegalese
- 1252.6%European
- 1242.6%Greek
- 992.0%Italian
- 380.8%Lebanese
- 280.6%Scottish
- 270.6%French
- 230.5%African
- 190.4%Israeli
- 130.3%Scotch-Irish
- 100.2%Hungarian
- 90.2%British
- 90.2%Czechoslovakian
- 90.2%Swedish
- 70.1%Russian

Geographical mobility in Reading

- Same house 1 year ago
- 7,35285.4%White (Caucasian)
- 59080.1%Black or African American
- 7100.0%American Indian / Alaska Native
- 211100.0%Asian
- 35100.0%Native Hawaiian / Pacific Islander
- 26898.9%Other race
- 532100.0%Two or more races
- 7,22984.9%White alone, not Hispanic / Latino
- 492100.0%Hispanic or Latino

-
- Moved within same county
- 7688.9%White / Caucasian
- 577.7%Black or African American
- 122.4%Two or more races
- 7879.2%White alone, not Hispanic / Latino
- 10.2%Hispanic or Latino

-
- Moved within same state
- 2222.6%White / Caucasian
- 10414.1%Black or African American
- 2272.7%White alone, not Hispanic / Latino

-
- Moved from different state
- 1311.5%White / Caucasian
- 1311.5%White alone, not Hispanic / Latino

-
- Moved from abroad
- 140.2%White
- 330.4%White alone, not Hispanic / Latino

Children Nativity (place of birth) in Reading
Place of birth for residents in Reading
![Place of birth for the foreign-born population - Regions]()
- 271Americas
- 271Latin America
- 231Central America
- 123Africa
- 90Western Africa
- 82Asia
- 52Europe
- 51South Central Asia
- 41Eastern Europe
- 28South America
- 23Middle Africa
- 16Eastern Asia
- 15Western Asia
- 11Caribbean
- 10Southern Europe
- 10Southern Africa

![Place of birth for the foreign-born population - Countries]()
- 218Mexico
- 90Senegal
- 28Peru
- 27Afghanistan
- 23Pakistan
- 23Cameroon
- 16Korea
- 15Russia
- 15Lebanon
- 13Belarus
- 13Croatia
- 12El Salvador
- 11Dominican Republic
- 10Greece
- 10South Africa
- 1Guatemala

Grandparents responsible for own grandchildren in Reading
Zip codes: 45215.