Races in Rosaryville, Maryland (MD) Detailed Stats
Data:
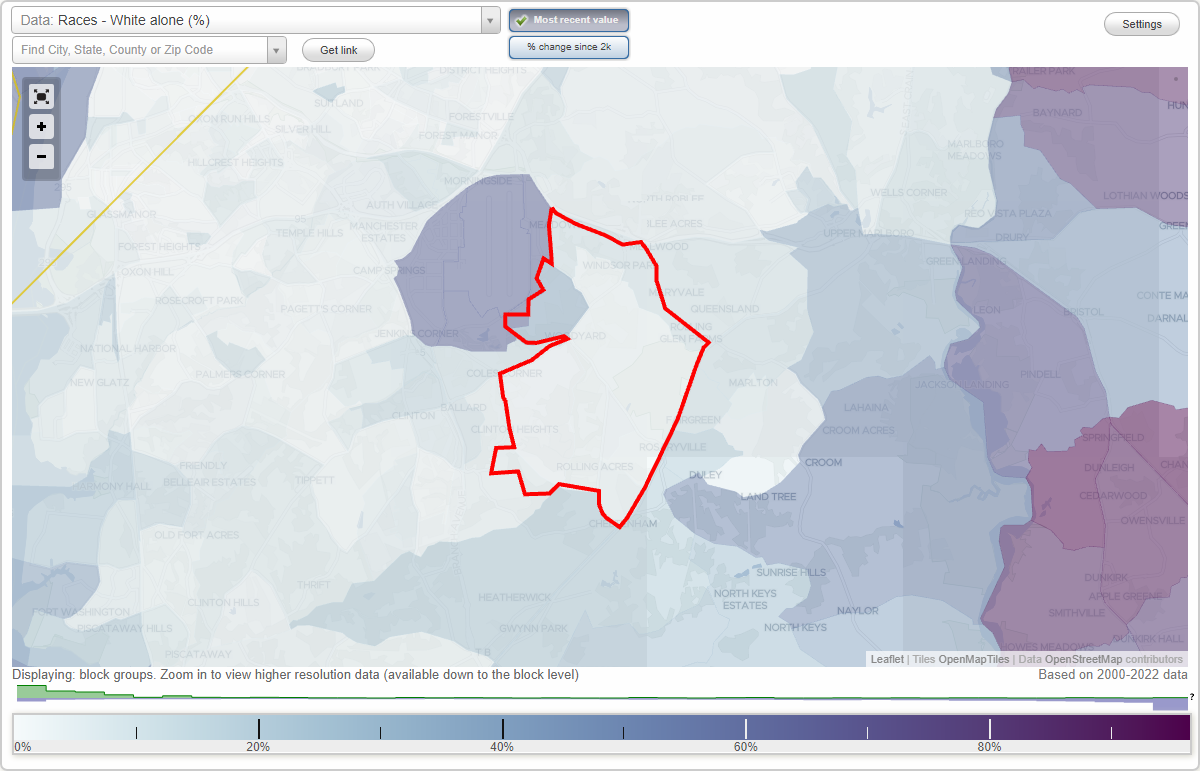
Races - White alone (%)
Races - White alone (% change since 2000)
Races - Black alone (%)
Races - Black alone (% change since 2000)
Races - American Indian alone (%)
Races - American Indian alone (% change since 2000)
Races - Asian alone (%)
Races - Asian alone (% change since 2000)
Races - Hispanic (%)
Races - Hispanic (% change since 2000)
Races - Native Hawaiian and Other Pacific Islander alone (%)
Races - Native Hawaiian and Other Pacific Islander alone (% change since 2000)
Races - Two or more races(%)
Races - Two or more races(% change since 2000)
Races - Other race alone (%)
Races - Other race alone (% change since 2000)
Racial diversity
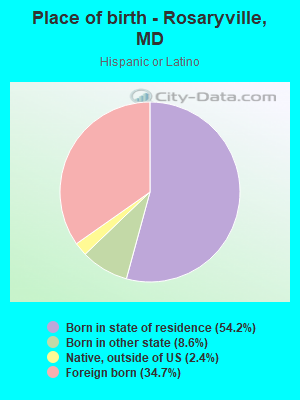
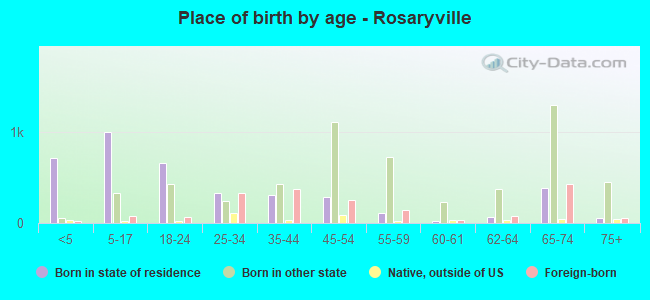
Place of birth - Born in state of residence (%)
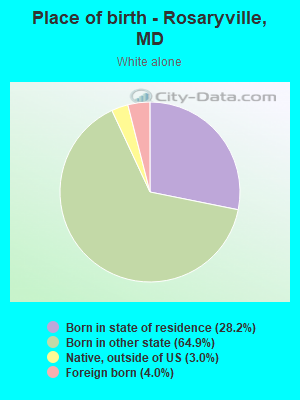
Place of birth - Born in state of residence (%) - White
Place of birth - Born in state of residence (%) - Black or African American
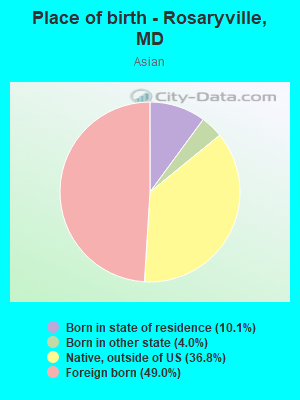
Place of birth - Born in state of residence (%) - Asian
Place of birth - Born in state of residence (%) - Hispanic or Latino
Place of birth - Born in state of residence (%) - American Indian and Alaska Native
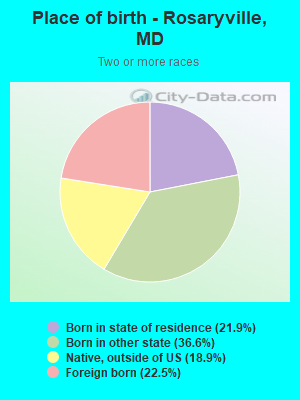
Place of birth - Born in state of residence (%) - Multirace
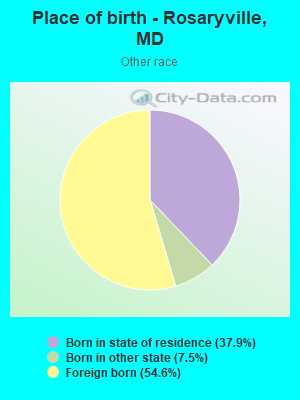
Place of birth - Born in state of residence (%) - Other Race
Place of birth - Born in other state (%)
Place of birth - Born in other state (%) - White
Place of birth - Born in other state (%) - Black or African American
Place of birth - Born in other state (%) - Asian
Place of birth - Born in other state (%) - Hispanic or Latino
Place of birth - Born in other state (%) - American Indian and Alaska Native
Place of birth - Born in other state (%) - Multirace
Place of birth - Born in other state (%) - Other Race
Place of birth - Native, outside of US (%)
Place of birth - Native, outside of US (%) - White
Place of birth - Native, outside of US (%) - Black or African American
Place of birth - Native, outside of US (%) - Asian
Place of birth - Native, outside of US (%) - Hispanic or Latino
Place of birth - Native, outside of US (%) - American Indian and Alaska Native
Place of birth - Native, outside of US (%) - Multirace
Place of birth - Native, outside of US (%) - Other Race
Place of birth - Foreign born (%)
Place of birth - Foreign born (%) - White
Place of birth - Foreign born (%) - Black or African American
Place of birth - Foreign born (%) - Asian
Place of birth - Foreign born (%) - Hispanic or Latino
Place of birth - Foreign born (%) - American Indian and Alaska Native
Place of birth - Foreign born (%) - Multirace
Place of birth - Foreign born (%) - Other Race
Residents speaking English at home (%)
Residents speaking English at home - Born in the United States (%)
Residents speaking English at home - Native, born elsewhere (%)
Residents speaking English at home - Foreign born (%)
Residents speaking Spanish at home (%)
Residents speaking Spanish at home - Born in the United States (%)
Residents speaking Spanish at home - Native, born elsewhere (%)
Residents speaking Spanish at home - Foreign born (%)
Residents speaking other language at home (%)
Residents speaking other language at home - Born in the United States (%)
Residents speaking other language at home - Native, born elsewhere (%)
Residents speaking other language at home - Foreign born (%)
Marital status - Never married (%)
Marital status - Now married (%)
Marital status - Separated (%)
Marital status - Widowed (%)
Marital status - Divorced (%)
Ancestries Reported - Arab (%)
Ancestries Reported - Czech (%)
Ancestries Reported - Danish (%)
Ancestries Reported - Dutch (%)
Ancestries Reported - English (%)
Ancestries Reported - French (%)
Ancestries Reported - French Canadian (%)
Ancestries Reported - German (%)
Ancestries Reported - Greek (%)
Ancestries Reported - Hungarian (%)
Ancestries Reported - Irish (%)
Ancestries Reported - Italian (%)
Ancestries Reported - Lithuanian (%)
Ancestries Reported - Norwegian (%)
Ancestries Reported - Polish (%)
Ancestries Reported - Portuguese (%)
Ancestries Reported - Russian (%)
Ancestries Reported - Scotch-Irish (%)
Ancestries Reported - Scottish (%)
Ancestries Reported - Slovak (%)
Ancestries Reported - Subsaharan African (%)
Ancestries Reported - Swedish (%)
Ancestries Reported - Swiss (%)
Ancestries Reported - Ukrainian (%)
Ancestries Reported - United States (%)
Ancestries Reported - Welsh (%)
Ancestries Reported - West Indian (%)
Ancestries Reported - Other (%)
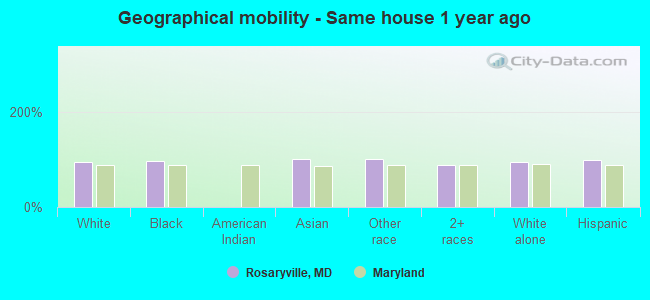
Geographical mobility - Same house 1 year ago (%)
Geographical mobility - Same house 1 year ago (%) - White
Geographical mobility - Same house 1 year ago (%) - Black or African American
Geographical mobility - Same house 1 year ago (%) - Asian
Geographical mobility - Same house 1 year ago (%) - Hispanic or Latino
Geographical mobility - Same house 1 year ago (%) - American Indian and Alaska Native
Geographical mobility - Same house 1 year ago (%) - Multirace
Geographical mobility - Same house 1 year ago (%) - Other Race
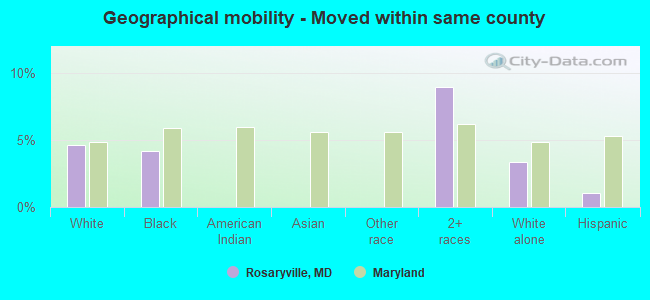
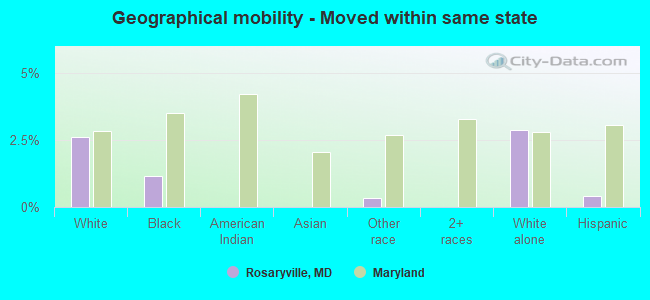
Geographical mobility - Moved within same county (%)
Geographical mobility - Moved within same county (%) - White
Geographical mobility - Moved within same county (%) - Black or African American
Geographical mobility - Moved within same county (%) - Asian
Geographical mobility - Moved within same county (%) - Hispanic or Latino
Geographical mobility - Moved within same county (%) - American Indian and Alaska Native
Geographical mobility - Moved within same county (%) - Multirace
Geographical mobility - Moved within same county (%) - Other Race
Geographical mobility - Moved from different county within same state (%)
Geographical mobility - Moved from different county within same state (%) - White
Geographical mobility - Moved from different county within same state (%) - Black or African American
Geographical mobility - Moved from different county within same state (%) - Asian
Geographical mobility - Moved from different county within same state (%) - Hispanic or Latino
Geographical mobility - Moved from different county within same state (%) - American Indian and Alaska Native
Geographical mobility - Moved from different county within same state (%) - Multirace
Geographical mobility - Moved from different county within same state (%) - Other Race
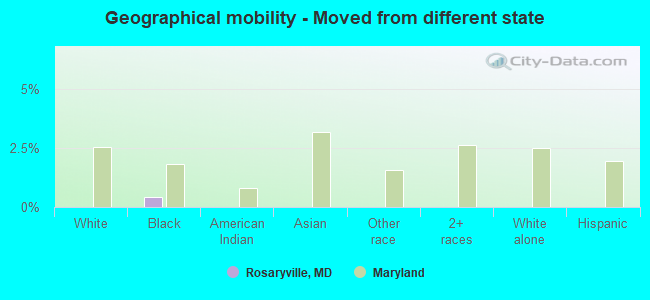
Geographical mobility - Moved from different state (%)
Geographical mobility - Moved from different state (%) - White
Geographical mobility - Moved from different state (%) - Black or African American
Geographical mobility - Moved from different state (%) - Asian
Geographical mobility - Moved from different state (%) - Hispanic or Latino
Geographical mobility - Moved from different state (%) - American Indian and Alaska Native
Geographical mobility - Moved from different state (%) - Multirace
Geographical mobility - Moved from different state (%) - Other Race
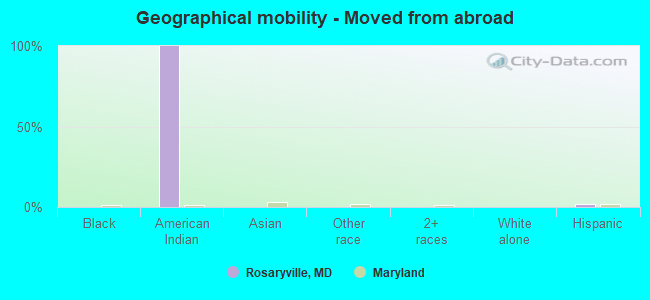
Geographical mobility - Moved from abroad (%)
Geographical mobility - Moved from abroad (%) - White
Geographical mobility - Moved from abroad (%) - Black or African American
Geographical mobility - Moved from abroad (%) - Asian
Geographical mobility - Moved from abroad (%) - Hispanic or Latino
Geographical mobility - Moved from abroad (%) - American Indian and Alaska Native
Geographical mobility - Moved from abroad (%) - Multirace
Geographical mobility - Moved from abroad (%) - Other Race
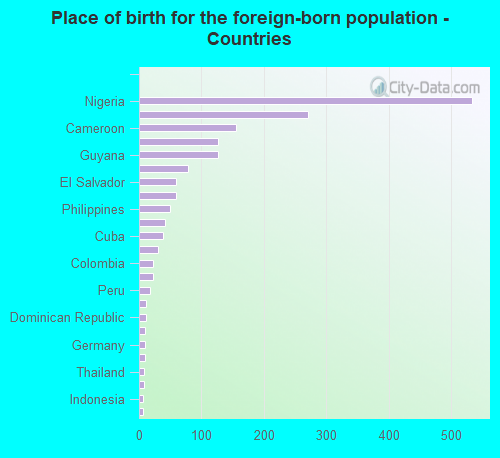
Place of birth for the foreign-born population - Ireland (%)
Place of birth for the foreign-born population - Denmark (%)
Place of birth for the foreign-born population - Norway (%)
Place of birth for the foreign-born population - Sweden (%)
Place of birth for the foreign-born population - United Kingdom (%)
Place of birth for the foreign-born population - England (%)
Place of birth for the foreign-born population - Scotland (%)
Place of birth for the foreign-born population - Other Northern Europe (%)
Place of birth for the foreign-born population - Austria (%)
Place of birth for the foreign-born population - Belgium (%)
Place of birth for the foreign-born population - France (%)
Place of birth for the foreign-born population - Germany (%)
Place of birth for the foreign-born population - Netherlands (%)
Place of birth for the foreign-born population - Switzerland (%)
Place of birth for the foreign-born population - Other Western Europe (%)
Place of birth for the foreign-born population - Greece (%)
Place of birth for the foreign-born population - Italy (%)
Place of birth for the foreign-born population - Portugal (%)
Place of birth for the foreign-born population - Spain (%)
Place of birth for the foreign-born population - Other Southern Europe (%)
Place of birth for the foreign-born population - Albania (%)
Place of birth for the foreign-born population - Belarus (%)
Place of birth for the foreign-born population - Bosnia and Herzegovina (%)
Place of birth for the foreign-born population - Bulgaria (%)
Place of birth for the foreign-born population - Croatia (%)
Place of birth for the foreign-born population - Czechoslovakia (%)
Place of birth for the foreign-born population - Hungary (%)
Place of birth for the foreign-born population - Latvia (%)
Place of birth for the foreign-born population - Lithuania (%)
Place of birth for the foreign-born population - North Macedonia (Macedonia) (%)
Place of birth for the foreign-born population - Moldova (%)
Place of birth for the foreign-born population - Poland (%)
Place of birth for the foreign-born population - Romania (%)
Place of birth for the foreign-born population - Russia (%)
Place of birth for the foreign-born population - Serbia (%)
Place of birth for the foreign-born population - Ukraine (%)
Place of birth for the foreign-born population - Other Eastern Europe (%)
Place of birth for the foreign-born population - China (%)
Place of birth for the foreign-born population - Hong Kong (%)
Place of birth for the foreign-born population - Taiwan (%)
Place of birth for the foreign-born population - Japan (%)
Place of birth for the foreign-born population - Korea (%)
Place of birth for the foreign-born population - Other Eastern Asia (%)
Place of birth for the foreign-born population - Afghanistan (%)
Place of birth for the foreign-born population - Bangladesh (%)
Place of birth for the foreign-born population - India (%)
Place of birth for the foreign-born population - Iran (%)
Place of birth for the foreign-born population - Kazakhstan (%)
Place of birth for the foreign-born population - Nepal (%)
Place of birth for the foreign-born population - Pakistan (%)
Place of birth for the foreign-born population - Sri Lanka (%)
Place of birth for the foreign-born population - Uzbekistan (%)
Place of birth for the foreign-born population - Other South Central Asia (%)
Place of birth for the foreign-born population - Burma (%)
Place of birth for the foreign-born population - Cambodia (%)
Place of birth for the foreign-born population - Indonesia (%)
Place of birth for the foreign-born population - Laos (%)
Place of birth for the foreign-born population - Malaysia (%)
Place of birth for the foreign-born population - Philippines (%)
Place of birth for the foreign-born population - Singapore (%)
Place of birth for the foreign-born population - Thailand (%)
Place of birth for the foreign-born population - Vietnam (%)
Place of birth for the foreign-born population - Other South Eastern Asia (%)
Place of birth for the foreign-born population - Armenia (%)
Place of birth for the foreign-born population - Iraq (%)
Place of birth for the foreign-born population - Israel (%)
Place of birth for the foreign-born population - Jordan (%)
Place of birth for the foreign-born population - Kuwait (%)
Place of birth for the foreign-born population - Lebanon (%)
Place of birth for the foreign-born population - Saudi Arabia (%)
Place of birth for the foreign-born population - Syria (%)
Place of birth for the foreign-born population - Turkey (%)
Place of birth for the foreign-born population - Yemen (%)
Place of birth for the foreign-born population - Other Western Asia (%)
Place of birth for the foreign-born population - Eritrea (%)
Place of birth for the foreign-born population - Ethiopia (%)
Place of birth for the foreign-born population - Kenya (%)
Place of birth for the foreign-born population - Somalia (%)
Place of birth for the foreign-born population - Uganda (%)
Place of birth for the foreign-born population - Zimbabwe (%)
Place of birth for the foreign-born population - Other Eastern Africa (%)
Place of birth for the foreign-born population - Cameroon (%)
Place of birth for the foreign-born population - Congo (%)
Place of birth for the foreign-born population - Democratic Republic of Congo (Zaire) (%)
Place of birth for the foreign-born population - Other Middle Africa (%)
Place of birth for the foreign-born population - Egypt (%)
Place of birth for the foreign-born population - Morocco (%)
Place of birth for the foreign-born population - Sudan (%)
Place of birth for the foreign-born population - Other Northern Africa (%)
Place of birth for the foreign-born population - South Africa (%)
Place of birth for the foreign-born population - Other Southern Africa (%)
Place of birth for the foreign-born population - Cabo Verde (%)
Place of birth for the foreign-born population - Ghana (%)
Place of birth for the foreign-born population - Liberia (%)
Place of birth for the foreign-born population - Nigeria (%)
Place of birth for the foreign-born population - Senegal (%)
Place of birth for the foreign-born population - Sierra Leone (%)
Place of birth for the foreign-born population - Other Western Africa (%)
Place of birth for the foreign-born population - Australia (%)
Place of birth for the foreign-born population - New Zealand (%)
Place of birth for the foreign-born population - Fiji (%)
Place of birth for the foreign-born population - Micronesia (%)
Place of birth for the foreign-born population - Bahamas (%)
Place of birth for the foreign-born population - Barbados (%)
Place of birth for the foreign-born population - Cuba (%)
Place of birth for the foreign-born population - Dominica (%)
Place of birth for the foreign-born population - Dominican Republic (%)
Place of birth for the foreign-born population - Grenada (%)
Place of birth for the foreign-born population - Haiti (%)
Place of birth for the foreign-born population - Jamaica (%)
Place of birth for the foreign-born population - St. Vincent and the Grenadines (%)
Place of birth for the foreign-born population - Trinidad and Tobago (%)
Place of birth for the foreign-born population - West Indies (%)
Place of birth for the foreign-born population - Other Caribbean (%)
Place of birth for the foreign-born population - Belize (%)
Place of birth for the foreign-born population - Costa Rica (%)
Place of birth for the foreign-born population - El Salvador (%)
Place of birth for the foreign-born population - Guatemala (%)
Place of birth for the foreign-born population - Honduras (%)
Place of birth for the foreign-born population - Mexico (%)
Place of birth for the foreign-born population - Nicaragua (%)
Place of birth for the foreign-born population - Panama (%)
Place of birth for the foreign-born population - Other Central America (%)
Place of birth for the foreign-born population - Argentina (%)
Place of birth for the foreign-born population - Bolivia (%)
Place of birth for the foreign-born population - Brazil (%)
Place of birth for the foreign-born population - Chile (%)
Place of birth for the foreign-born population - Colombia (%)
Place of birth for the foreign-born population - Ecuador (%)
Place of birth for the foreign-born population - Guyana (%)
Place of birth for the foreign-born population - Peru (%)
Place of birth for the foreign-born population - Uruguay (%)
Place of birth for the foreign-born population - Venezuela (%)
Place of birth for the foreign-born population - Other South America (%)
Place of birth for the foreign-born population - Canada (%)
Place of birth for the foreign-born population - Other Northern America (%)
Place of birth for the foreign-born population - Other (%)
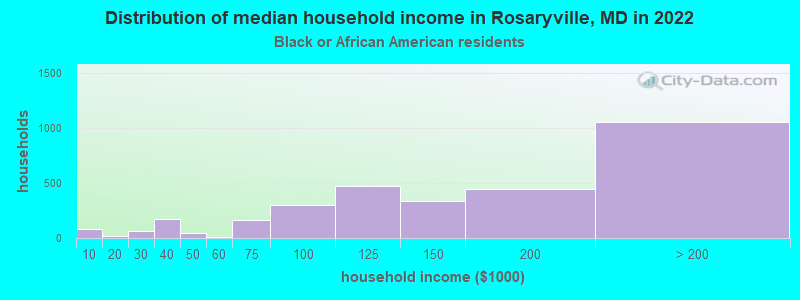
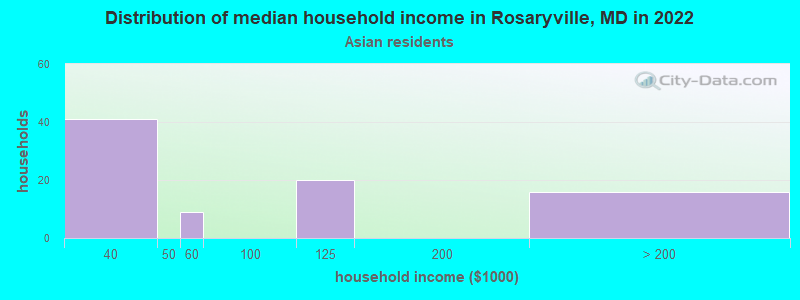
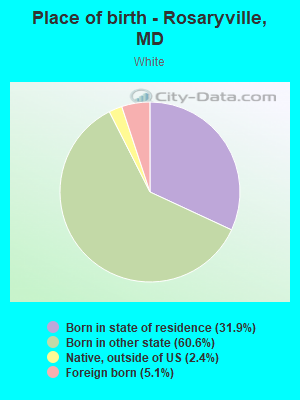
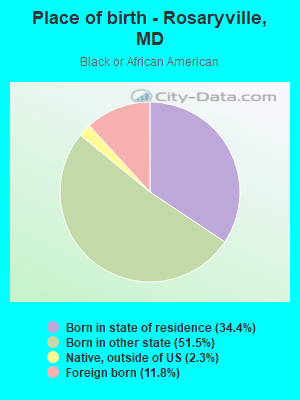
According to 2022 data, the most numerous races in Rosaryville, MD are White alone (480 residents), Black alone (9,527 residents), and Hispanic (701 residents). 79.1% of Rosaryville residents speak English at home. 15.5% of Rosaryville, MD residents are foreign-born (6.5% born in Latin America, 6.2% born in Africa), which is 3.0% less than the foreign-born rate of 16.0% across the entire state of Maryland.
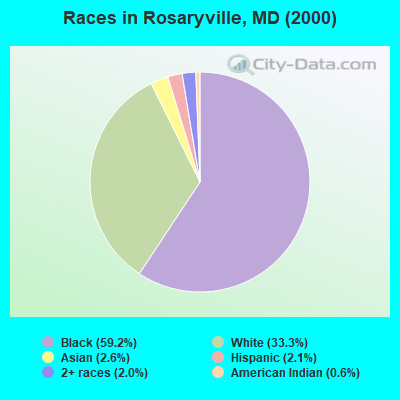
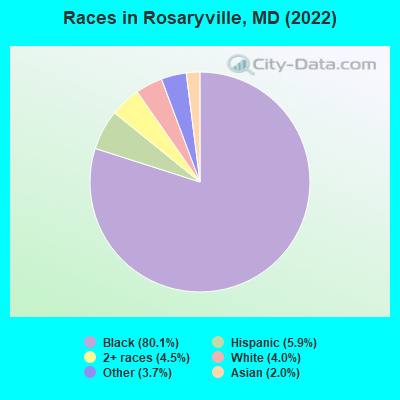
Race distribution in Rosaryville
2000 2022
3,286,547 62.1% White alone 1,464,735 27.7% Black alone 227,916 4.3% Hispanic 209,738 4.0% Asian alone 82,946 1.6% Two or more races 13,312 0.3% American Indian alone 9,379 0.2% Other race alone 1,913 0.04% Native Hawaiian and Other
2,906,492 47.1% White alone 1,800,914 29.2% Black alone 705,842 11.4% Hispanic 401,818 6.5% Asian alone 291,317 4.7% Two or more races 46,930 0.8% Other race alone 8,930 0.1% American Indian alone 2,417 0.04% Native Hawaiian and Other
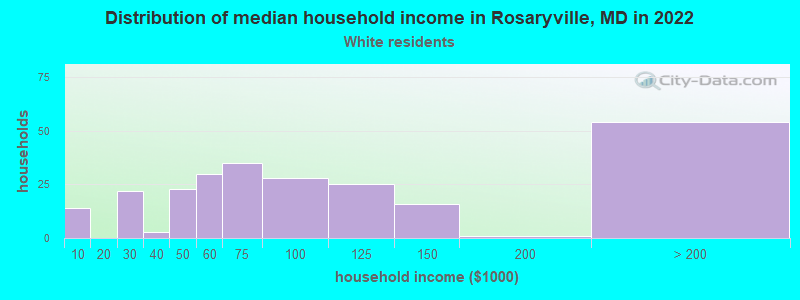
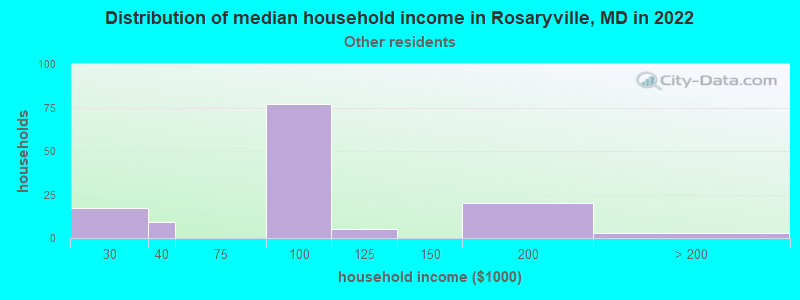
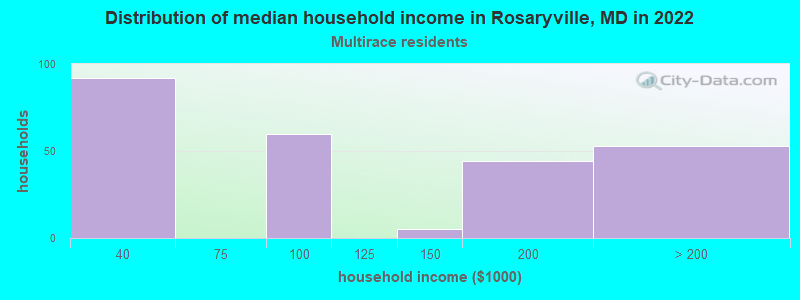
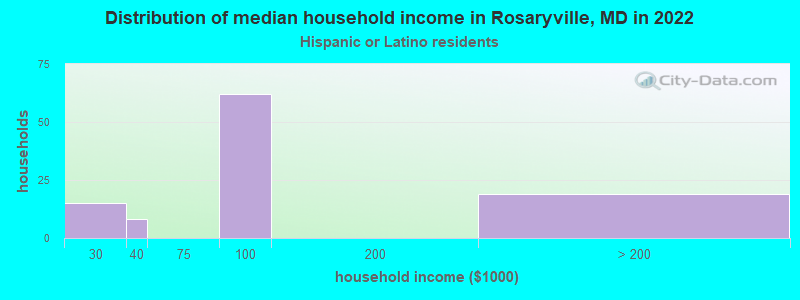
Income and house value in Rosaryville Median household income in 2022 $76,953 White non-Hispanic householders$142,681 Black householders$78,289 Some other race householders$81,216 Hispanic or Latino race householdersMedian 2022 house value $457,658 White Non-Hispanic householders$487,065 Black or African American householders $342,601 Asian householders$642,377 Some other race householders$642,377 Two or more races householders$425,682 Hispanic or Latino householders
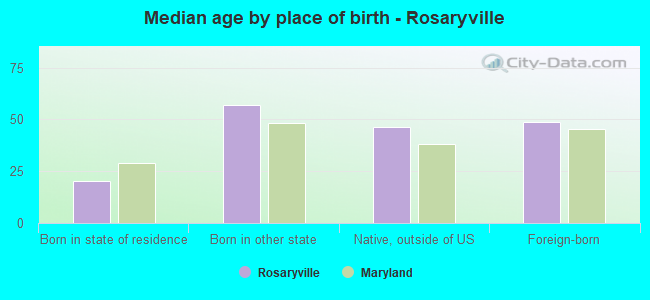
Median age by race in Rosaryville
65.2 Median age for White residents66.4 64.9 50.0 Median age for Black or African American residents48.2 50.0 -780,410,741.7 Median age for American Indian / Alaska Native residents-888,297,871.5 -689,905,591.2 45.7 Median age for Asian residents37.4 69.1 -571,600,480.8 Median age for Native Hawaiian / Pacific Islander residents-720,061,021.4 -760,942,760.2 26.3 Median age for Other race residents8.9 68.8 34.7 Median age for Two or more races residents34.0 35.3 65.4 Median age for White alone residents68.1 63.7 14.0 Median age for Hispanic or Latino residents9.8 15.0
Owner/renter occupied households by race in Rosaryville
House owners and renters - White residents 226 93.7% Owner occupied15 6.3% Renter occupiedHouse owners and renters - Black or African American residents 2,834 90.2% Owner occupied308 9.8% Renter occupiedHouse owners and renters - Asian residents 89 100.0% Owner occupiedHouse owners and renters - Other race residents 110 100.0% Owner occupiedHouse owners and renters - Two or more races residents 259 100.0% Owner occupiedHouse owners and renters - White alone residents 227 93.6% Owner occupied16 6.4% Renter occupiedHouse owners and renters - Hispanic or Latino residents 95 100.0% Owner occupied
Language usage in Rosaryville
English speakers - Total 79.1% of residents of Rosaryville speak English at home.
4.1% of residents speak Spanish at home 278 61.5% Speak English very well174 38.5% Speak English less than very well16.2% of residents speak other language at home 1,295 72.1% Speak English very well501 27.9% Speak English less than very well
English speakers - Born in the United States 96.3% of residents of Rosaryville speak English at home.
0.8% of residents speak Spanish at home 22 46.8% Speak English very well25 53.2% Speak English less than very well2.3% of residents speak other language at home 129 100.0% Speak English very well
English speakers - Native, born elsewhere 89.7% of residents of Rosaryville speak English at home.
5.3% of residents speak other language at home 20 100.0% Speak English very well
English speakers - Foreign-born 28.4% of residents of Rosaryville speak English at home.
8.7% of residents speak Spanish at home 27 16.7% Speak English very well135 83.3% Speak English less than very well63.5% of residents speak other language at home 722 60.7% Speak English very well467 39.3% Speak English less than very well
White (Caucasian) - Speak only English Native:
96.3% (472)Foreign-born:
36.6% (9)
White (Caucasian) - Speak another language Native:
4.2% (21)Foreign-born:
68.0% (17)
Black or African American - Speak only English Native:
95.5% (7,305)Foreign-born:
34.2% (385)
Black or African American - Speak another language Native:
4.6% (352)Foreign-born:
66.3% (746)
Asian - Speak only English Native:
22.6% (25)Foreign-born:
6.3% (8)
Asian - Speak another language Native:
87.1% (96)Foreign-born:
92.1% (119)
Other race - Speak only English Native:
20.3% (66)Foreign-born:
10.9% (53)
Other race - Speak another language Native:
80.3% (261)Foreign-born:
87.7% (426)
Two or more races - Speak only English Native:
71.6% (329)Foreign-born:
48.5% (78)
Two or more races - Speak another language Native:
29.0% (133)Foreign-born:
44.8% (72)
White alone - Speak only English Native:
98.8% (459)Foreign-born:
54.8% (10)
White alone - Speak another language Native:
0.2% (1)Foreign-born:
46.5% (9)
Hispanic or Latino - Speak only English Native:
14.7% (61)Foreign-born:
21.0% (51)
Hispanic or Latino - Speak another language Native:
84.7% (354)Foreign-born:
75.4% (182)
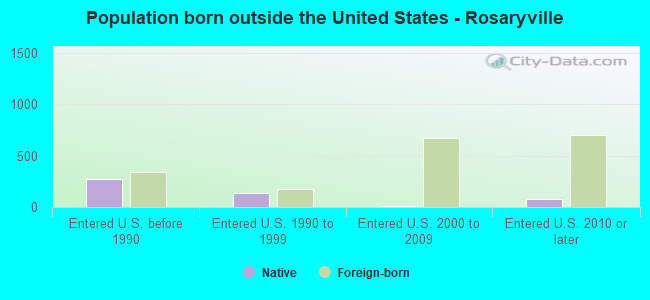
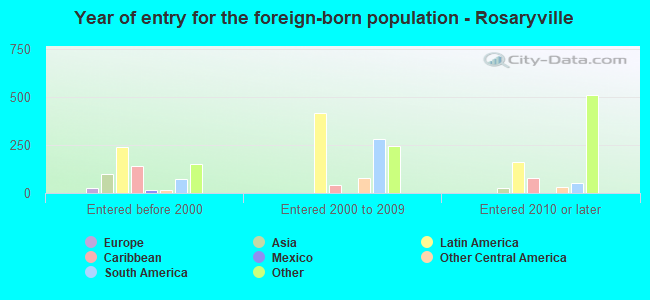
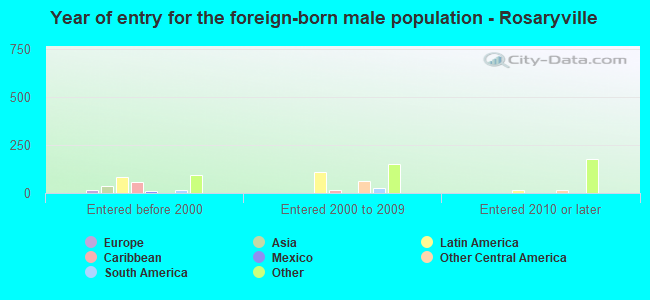
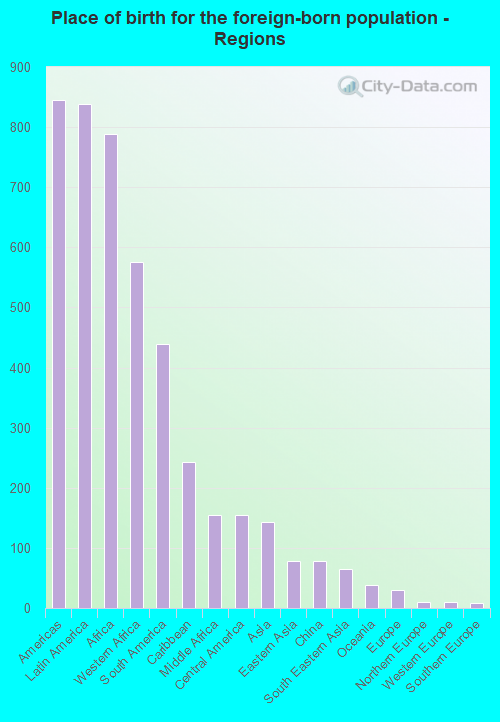
Foreign-born residents in Rosaryville 1,848 residents are foreign born (6.5% Latin America , 6.2% Africa ).
This city:
15.5%Maryland:
15.7%
Marital status for residents in Rosaryville Marital status - White (Caucasian) population 15 years and over
Males 21.4% Never married65.3% Now married0.0% Separated6.1% Widowed7.3% DivorcedFemales 12.9% Never married66.1% Now married0.0% Separated13.2% Widowed7.9% DivorcedWomen who gave birth in the past 12 months Now married:
100.0% (5)Unmarried:
0.0% (0)
Women who did not give birth in the past 12 months Now married:
46.3% (27)Unmarried:
53.7% (31)
Marital status - Black or African American population 15 years and over
Males 39.0% Never married51.1% Now married2.6% Separated2.3% Widowed5.0% DivorcedFemales 34.0% Never married45.0% Now married2.4% Separated5.3% Widowed13.2% DivorcedWomen who gave birth in the past 12 months Now married:
59.2% (42)Unmarried:
40.8% (29)
Women who did not give birth in the past 12 months Now married:
32.9% (619)Unmarried:
67.1% (1,264)
Marital status - Asian population 15 years and over
Males 75.9% Never married24.1% Now married0.0% Separated0.0% Widowed0.0% DivorcedFemales 34.3% Never married35.2% Now married0.0% Separated0.0% Widowed30.5% DivorcedWomen who did not give birth in the past 12 months Now married:
16.3% (7)Unmarried:
83.7% (34)
Marital status - Other race population 15 years and over
Males 11.8% Never married88.2% Now married0.0% Separated0.0% Widowed0.0% DivorcedFemales 11.1% Never married19.9% Now married0.0% Separated0.0% Widowed69.0% DivorcedWomen who gave birth in the past 12 months Now married:
50.0% (6)Unmarried:
50.0% (6)
Women who did not give birth in the past 12 months Now married:
47.9% (64)Unmarried:
52.1% (70)
Marital status - Two or more races population 15 years and over
Males 39.5% Never married43.3% Now married0.0% Separated12.6% Widowed4.6% DivorcedFemales 35.3% Never married14.4% Now married0.0% Separated44.9% Widowed5.4% DivorcedWomen who gave birth in the past 12 months Now married:
100.0% (12)Unmarried:
0.0% (0)
Women who did not give birth in the past 12 months Now married:
0.0% (0)Unmarried:
100.0% (71)
Marital status - White alone, not Hispanic / Latino population 15 years and over
Males 19.2% Never married66.2% Now married0.0% Separated6.7% Widowed7.9% DivorcedFemales 13.3% Never married64.9% Now married0.0% Separated13.7% Widowed8.1% DivorcedWomen who gave birth in the past 12 months Now married:
100.0% (6)Unmarried:
0.0% (0)
Women who did not give birth in the past 12 months Now married:
37.9% (21)Unmarried:
62.1% (34)
Marital status - Hispanic or Latino population 15 years and over
Males 14.5% Never married77.1% Now married0.0% Separated8.4% Widowed0.0% DivorcedFemales 28.3% Never married49.0% Now married0.0% Separated9.0% Widowed13.8% DivorcedWomen who gave birth in the past 12 months Now married:
100.0% (16)Unmarried:
0.0% (0)
Women who did not give birth in the past 12 months Now married:
47.4% (57)Unmarried:
52.6% (63)
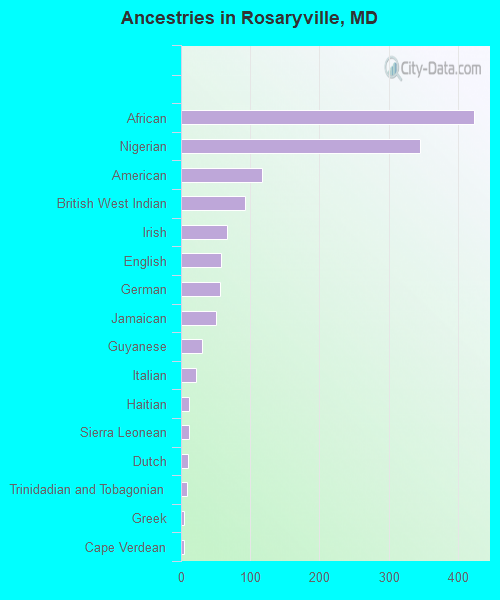
Ancestries in Rosaryville
424 5.8% African345 4.7% Nigerian117 1.6% American93 1.3% British West Indian66 0.9% Irish58 0.8% English56 0.8% German51 0.7% Jamaican31 0.4% Guyanese21 0.3% Italian12 0.2% Haitian11 0.2% Sierra Leonean10 0.1% Dutch9 0.1% Trinidadian and Tobagonian4 0.05% Greek4 0.05% Cape Verdean
Children Nativity (place of birth) in Rosaryville
Children under 6 years - Living with two parents Both parents native 120 100.0% NativeBoth parents foreign-born 463 100.0% NativeOne native, one foreign-born parent 32 100.0% NativeChildren under 6 years - Living with one parent Native parent 168 100.0% NativeForeign-born parent 66 100.0% NativeChildren 6 to 17 years - Living with two parents Both parents native 266 100.0% NativeBoth parents foreign-born 428 100.0% NativeOne native, one foreign-born parent 15 100.0% NativeChildren 6 to 17 years - Living with one parent Native parent 403 94.9% Native22 5.1% Foreign-bornForeign-born parent 117 69.0% Native53 31.0% Foreign-born
Grandparents responsible for own grandchildren in Rosaryville
Grandparents (30 to 59 years) White / Caucasian 6 100.0% Responsible for grandchildrenBlack or African American 107 41.9% Responsible for grandchildren149 58.1% Not responsible for grandchildrenTwo or more races 99 100.0% Not responsible for grandchildrenWhite alone, not Hispanic / Latino 6 100.0% Responsible for grandchildrenHispanic or Latino 4 100.0% Responsible for grandchildrenGrandparents (60 years and over) Black or African American 50 20.0% Responsible for grandchildren201 80.0% Not responsible for grandchildren