Races in Sidney, Ohio (OH) Detailed Stats
Ancestries, Foreign-born residents, place of birth
Settings
X


Recent posts about races in Sidney, Ohio on our local forum with over 2,400,000 registered users:
 | Suggest Apartment communities in Dayton for rental (work location will be Sidney) (16 replies) |
| Where all we can go on weekends (preferably saturdays only) for some time out, myself in Sidney (12 replies) |
| Dayton Development Thread (1673 replies) |
| Maybe relocating to Piqua (14 replies) |
| Does Ohio have traditionally southern cultural elements? (45 replies) |
| Tipp or Troy (8 replies) |
Latest news about races in Sidney, OH collected exclusively by city-data.com from local newspapers, TV, and radio stations
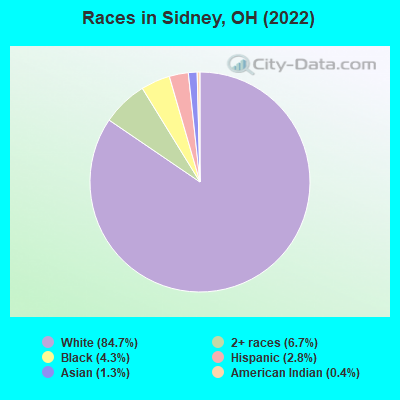
According to 2022 data, the most numerous races in Sidney, OH are White alone (17,203 residents), Black alone (878 residents), and Two or more races (1,369 residents). 96.3% of Sidney residents speak English at home. 2.5% of Sidney, OH residents are foreign-born (1.3% born in Asia, 0.5% born in Africa, 0.5% born in Latin America), which is 61.3% less than the foreign-born rate of 4.0% across the entire state of Ohio.
Race distribution in Sidney
2000
2022

- 18,54491.8%White alone
- 6143.0%Black alone
- 3741.9%Asian alone
- 3251.6%Two or more races
- 2621.3%Hispanic
- 420.2%American Indian alone
- 290.1%Other race alone
- 210.1%Native Hawaiian and Other
Pacific Islander alone

-
- 17,20384.7%White alone
- 1,3696.7%Two or more races
- 8784.3%Black alone
- 5642.8%Hispanic
- 2641.3%Asian alone
- 880.4%American Indian alone
2000
2022
-
- 9,538,11184.0%White alone
- 1,290,66211.4%Black alone
- 217,1231.9%Hispanic
- 137,7701.2%Two or more races
- 131,6701.2%Asian alone
- 21,9850.2%American Indian alone
- 13,4830.1%Other race alone
- 2,3360.02%Native Hawaiian and Other
Pacific Islander alone

-
- 8,948,79376.1%White alone
- 1,401,40311.9%Black alone
- 529,2914.5%Two or more races
- 517,2324.4%Hispanic
- 293,3872.5%Asian alone
- 52,8050.4%Other race alone
- 9,7850.08%American Indian alone
- 3,3620.03%Native Hawaiian and Other
Pacific Islander alone

Income and house value in Sidney
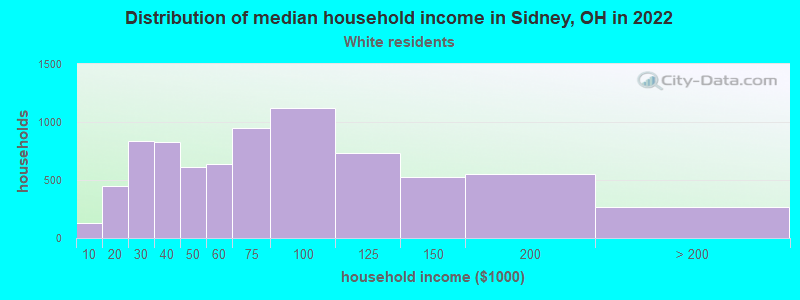
- Median household income in 2022
- $63,968White non-Hispanic householders
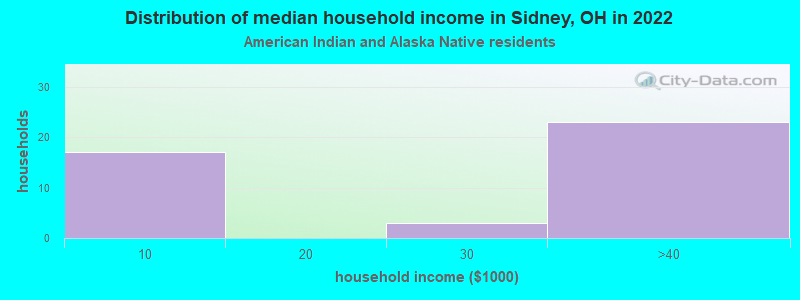
- $23,775American Indian and Alaska Native householders
- $69,012Two or more races householders
- $69,566Hispanic or Latino race householders
- Median 2022 house value
- $164,632White Non-Hispanic householders
- $153,368Black or African American householders
- $140,228American Indian or Alaska Native householders
- $239,721Asian householders
- $101,369Two or more races householders
- $159,563Hispanic or Latino householders
Household income for White non-Hispanic householders
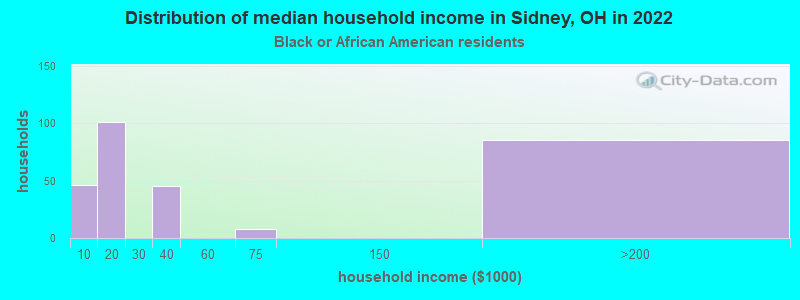
Household income for Black householders
Household income for American Indian and Alaska Native householders
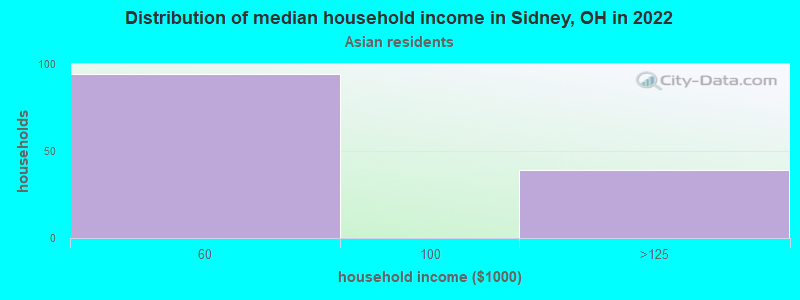
Household income for Asian householders
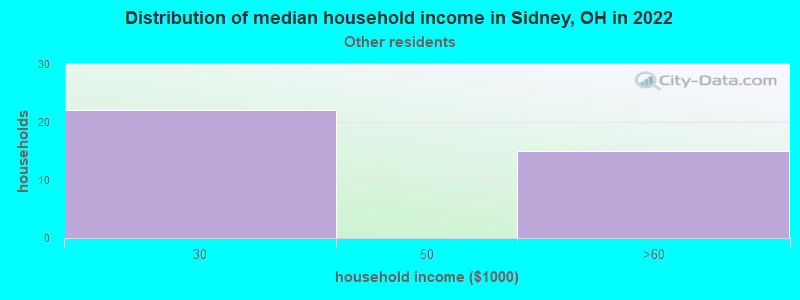
Household income for Some other race householders
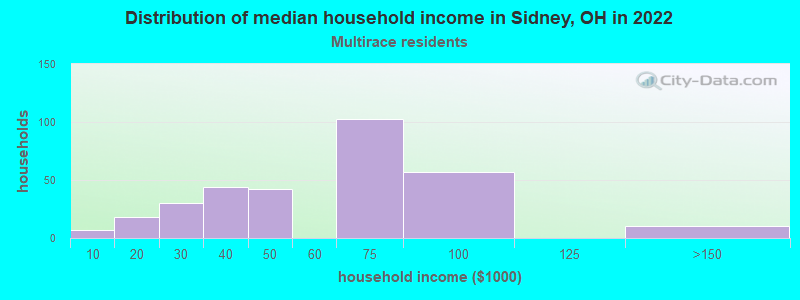
Household income for Two or more races householders
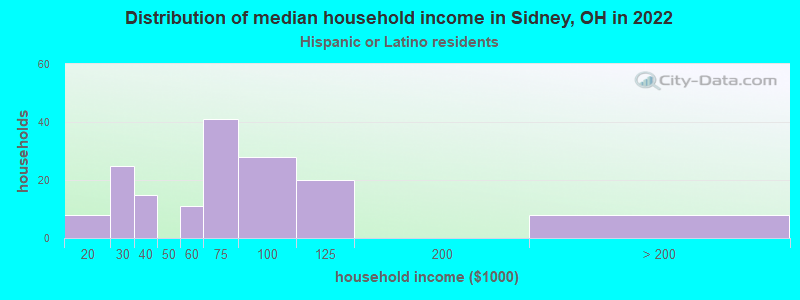
Household income for Hispanic or Latino race householders
Median age by race in Sidney
- 42.1Median age for White residents
- 41.9Males
- 42.2Females
- 38.9Median age for Black or African American residents
- 34.9Males
- 54.5Females
- 49.8Median age for American Indian / Alaska Native residents
- 42.7Males
- 48.5Females
- 41.6Median age for Asian residents
- 41.8Males
- 41.3Females
- -800,387,596.1Median age for Native Hawaiian / Pacific Islander residents
- -750,242,953.6Males
- -805,394,989.6Females
- 28.8Median age for Other race residents
- -691,275,167.1Males
- 26.6Females
- 23.5Median age for Two or more races residents
- 17.3Males
- 25.5Females
- 42.0Median age for White alone residents
- 42.2Males
- 42.0Females
- 28.2Median age for Hispanic or Latino residents
- 38.3Males
- 21.7Females
Owner/renter occupied households by race in Sidney
- House owners and renters - White residents
- 5,16167.5%Owner occupied
- 2,48632.5%Renter occupied
- House owners and renters - Black or African American residents
- 9231.7%Owner occupied
- 19868.3%Renter occupied
- House owners and renters - American Indian / Alaska Native residents
- 41100.0%Renter occupied
- House owners and renters - Asian residents
- 2621.6%Owner occupied
- 9578.4%Renter occupied
- House owners and renters - Other race residents
- 44100.0%Renter occupied
- House owners and renters - Two or more races residents
- 12941.4%Owner occupied
- 18258.6%Renter occupied
- House owners and renters - White alone residents
- 5,17068.1%Owner occupied
- 2,42631.9%Renter occupied
- House owners and renters - Hispanic or Latino residents
- 85.3%Owner occupied
- 14494.7%Renter occupied
Language usage in Sidney
- English speakers - Total
- 96.3% of residents of Sidney speak English at home.
- 1.4% of residents speak Spanish at home
- 5420.4%Speak English very well
- 21179.6%Speak English less than very well
- 2.2% of residents speak other language at home
- 17241.0%Speak English very well
- 24859.0%Speak English less than very well
- English speakers - Born in the United States
- 98.4% of residents of Sidney speak English at home.
- 0.6% of residents speak Spanish at home
- 23100.0%Speak English very well
- 0.8% of residents speak other language at home
- 2379.3%Speak English very well
- 620.7%Speak English less than very well
- English speakers - Native, born elsewhere
- 65.3% of residents of Sidney speak English at home.
- 36.4% of residents speak Spanish at home
- 109.3%Speak English very well
- 9890.7%Speak English less than very well
- English speakers - Foreign-born
- 8.5% of residents of Sidney speak English at home.
- 22.4% of residents speak Spanish at home
- 108100.0%Speak English less than very well
- 69.2% of residents speak other language at home
- 9729.0%Speak English very well
- 23771.0%Speak English less than very well
White (Caucasian) - Speak only English
| Native: | 99.1% (16,211) |
| Foreign-born: | 24.4% (17) |
White (Caucasian) - Speak another language
| Native: | 1.0% (171) |
| Foreign-born: | 74.3% (51) |
Black or African American - Speak only English
| Native: | 98.2% (767) |
| Foreign-born: | 11.8% (9) |
Black or African American - Speak another language
| Native: | 1.7% (14) |
| Foreign-born: | 86.6% (68) |
Other race - Speak another language
| Native: | 23.9% (10) |
| Foreign-born: | 100.0% (87) |
Two or more races - Speak another language
| Native: | 1.0% (13) |
| Foreign-born: | 100.0% (18) |
White alone - Speak only English
| Native: | 99.4% (16,099) |
| Foreign-born: | 33.9% (17) |
White alone - Speak another language
| Native: | 0.5% (82) |
| Foreign-born: | 66.1% (34) |
Hispanic or Latino - Speak another language
| Native: | 32.5% (134) |
| Foreign-born: | 100.0% (105) |
Foreign-born residents in Sidney
504 residents are foreign born (1.3% Asia, 0.5% Africa, 0.5% Latin America).
| This city: | 2.5% |
| Ohio: | 4.9% |


Marital status for residents in Sidney
Marital status - White (Caucasian) population 15 years and over
- Males
- 26.0%Never married
- 50.8%Now married
- 2.0%Separated
- 3.5%Widowed
- 17.7%Divorced
- Females
- 26.9%Never married
- 45.7%Now married
- 3.0%Separated
- 10.6%Widowed
- 13.8%Divorced
Women who gave birth in the past 12 months
| Now married: | 47.9% (152) |
| Unmarried: | 52.1% (166) |
Women who did not give birth in the past 12 months
| Now married: | 42.4% (1,562) |
| Unmarried: | 57.6% (2,122) |
Marital status - Black or African American population 15 years and over
- Males
- 61.9%Never married
- 28.0%Now married
- 7.4%Separated
- 0.0%Widowed
- 2.7%Divorced
- Females
- 20.1%Never married
- 28.7%Now married
- 0.0%Separated
- 31.5%Widowed
- 19.7%Divorced
Women who did not give birth in the past 12 months
| Now married: | 0.0% (0) |
| Unmarried: | 100.0% (65) |
Marital status - American Indian / Alaska Native population 15 years and over
- Males
- 50.0%Never married
- 50.0%Now married
- 0.0%Separated
- 0.0%Widowed
- 0.0%Divorced
- Females
- 0.0%Never married
- 81.2%Now married
- 0.0%Separated
- 0.0%Widowed
- 18.8%Divorced
Women who did not give birth in the past 12 months
| Now married: | 100.0% (48) |
| Unmarried: | 0.0% (0) |
Marital status - Asian population 15 years and over
- Males
- 53.0%Never married
- 47.0%Now married
- 0.0%Separated
- 0.0%Widowed
- 0.0%Divorced
- Females
- 0.0%Never married
- 100.0%Now married
- 0.0%Separated
- 0.0%Widowed
- 0.0%Divorced
Women who did not give birth in the past 12 months
| Now married: | 100.0% (69) |
| Unmarried: | 0.0% (0) |
Marital status - Other race population 15 years and over
- Males
- 0.0%Never married
- 100.0%Now married
- 0.0%Separated
- 0.0%Widowed
- 0.0%Divorced
- Females
- 71.4%Never married
- 19.8%Now married
- 0.0%Separated
- 8.8%Widowed
- 0.0%Divorced
Women who gave birth in the past 12 months
| Now married: | 0.0% (0) |
| Unmarried: | 100.0% (36) |
Women who did not give birth in the past 12 months
| Now married: | 0.0% (0) |
| Unmarried: | 100.0% (50) |
Marital status - Two or more races population 15 years and over
- Males
- 35.1%Never married
- 55.7%Now married
- 7.2%Separated
- 0.0%Widowed
- 2.0%Divorced
- Females
- 75.5%Never married
- 15.7%Now married
- 5.8%Separated
- 0.0%Widowed
- 3.0%Divorced
Women who gave birth in the past 12 months
| Now married: | 0.0% (0) |
| Unmarried: | 100.0% (180) |
Women who did not give birth in the past 12 months
| Now married: | 18.4% (61) |
| Unmarried: | 81.6% (273) |
Marital status - White alone, not Hispanic / Latino population 15 years and over
- Males
- 25.8%Never married
- 51.7%Now married
- 1.8%Separated
- 3.6%Widowed
- 17.1%Divorced
- Females
- 27.0%Never married
- 45.6%Now married
- 3.0%Separated
- 10.6%Widowed
- 13.8%Divorced
Women who gave birth in the past 12 months
| Now married: | 47.9% (154) |
| Unmarried: | 52.1% (168) |
Women who did not give birth in the past 12 months
| Now married: | 42.4% (1,578) |
| Unmarried: | 57.6% (2,144) |
Marital status - Hispanic or Latino population 15 years and over
- Males
- 30.8%Never married
- 31.2%Now married
- 6.8%Separated
- 0.0%Widowed
- 31.2%Divorced
- Females
- 76.8%Never married
- 15.3%Now married
- 3.4%Separated
- 4.5%Widowed
- 0.0%Divorced
Women who gave birth in the past 12 months
| Now married: | 0.0% (0) |
| Unmarried: | 100.0% (29) |
Women who did not give birth in the past 12 months
| Now married: | 0.0% (0) |
| Unmarried: | 100.0% (116) |
Ancestries in Sidney

- 2,70231.8%German
- 1,21014.2%American
- 8339.8%Irish
- 5886.9%English
- 3884.6%European
- 1391.6%Italian
- 1221.4%Welsh
- 971.1%French
- 851.0%Scottish
- 670.8%Polish
- 640.8%Scotch-Irish
- 600.7%Dutch
- 600.7%Slavic
- 300.4%Norwegian
- 290.3%Danish
- 190.2%Turkish
- 180.2%Portuguese
- 170.2%Lithuanian
- 150.2%Hungarian
- 140.2%French Canadian
- 130.2%Canadian
- 120.1%Jamaican
- 100.1%British
- 100.1%Czech
- 80.09%Swedish
- 60.07%Macedonian
- 30.04%Arab

Geographical mobility in Sidney

- Same house 1 year ago
- 14,81086.5%White (Caucasian)
- 73180.9%Black or African American
- 9688.2%American Indian / Alaska Native
- 17767.1%Asian
- 4231.3%Other race
- 1,07675.2%Two or more races
- 14,65086.4%White alone, not Hispanic / Latino
- 40671.9%Hispanic or Latino

-
- Moved within same county
- 1,4278.3%White / Caucasian
- 647.0%Black or African American
- 43.9%American Indian / Alaska Native
- 2922.2%Other race
- 30321.2%Two or more races
- 1,4198.4%White alone, not Hispanic / Latino
- 9416.7%Hispanic or Latino

-
- Moved within same state
- 5863.4%White / Caucasian
- 10111.2%Black or African American
- 87.3%American Indian / Alaska Native
- 10038.0%Asian
- 120.8%Two or more races
- 5853.4%White alone, not Hispanic / Latino

-
- Moved from different state
- 2201.3%White / Caucasian
- 192.1%Black or African American
- 2241.3%White alone, not Hispanic / Latino

-
- Moved from abroad
- 10175.8%Other race
- 7012.4%Hispanic or Latino

Children Nativity (place of birth) in Sidney
Place of birth for residents in Sidney
![Place of birth for the foreign-born population - Regions]()
- 266Asia
- 126Eastern Asia
- 110Africa
- 109Americas
- 109Latin America
- 93South Central Asia
- 73South America
- 56Western Africa
- 39South Eastern Asia
- 30Northern Africa
- 27Central America
- 23Middle Africa
- 18Europe
- 12Western Europe
- 8Caribbean
- 6Eastern Europe
- 6Western Asia

![Place of birth for the foreign-born population - Countries]()
- 89Japan
- 73Venezuela
- 57India
- 39Philippines
- 37Korea
- 35Nepal
- 27Mexico
- 23Congo
- 12France
- 8Jamaica
- 6Jordan

Grandparents responsible for own grandchildren in Sidney
Zip codes: 45365.