Races in South Tulsa, Oklahoma (OK) Detailed Stats
Ancestries, Foreign-born residents, place of birth
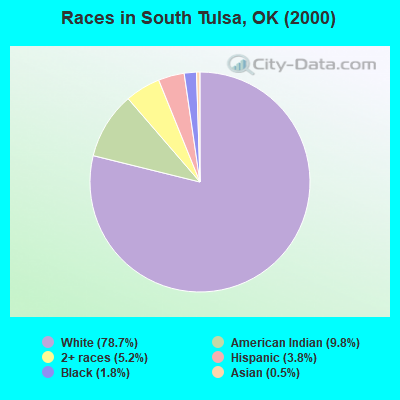
Race distribution in South Tulsa

- 13,18178.7%White alone
- 1,6459.8%American Indian alone
- 8725.2%Two or more races
- 6323.8%Hispanic
- 3031.8%Black alone
- 890.5%Asian alone
- 140.08%Other race alone
- 20.01%Native Hawaiian and Other
Pacific Islander alone
2000
2022
-
- 2,556,36874.1%White alone
- 266,1587.7%American Indian alone
- 257,9817.5%Black alone
- 179,3045.2%Hispanic
- 140,2494.1%Two or more races
- 46,1721.3%Asian alone
- 2,3220.07%Other race alone
- 2,1000.06%Native Hawaiian and Other
Pacific Islander alone

-
- 2,517,40362.6%White alone
- 486,69212.1%Hispanic
- 364,4539.1%Two or more races
- 273,6506.8%American Indian alone
- 268,5436.7%Black alone
- 92,6722.3%Asian alone
- 10,7860.3%Other race alone
- 5,6010.1%Native Hawaiian and Other
Pacific Islander alone

Income and house value in South Tulsa
- Median household income in 2022
- $76,494White non-Hispanic householders
- $108,394Black householders
- $68,558American Indian and Alaska Native householders
- $18,216Asian householders
- $51,462Some other race householders
- $77,287Two or more races householders
- $51,601Hispanic or Latino race householders
- Median 2022 house value
- $201,851White Non-Hispanic householders
- $210,435Black or African American householders
- $184,163American Indian or Alaska Native householders
- $357,661Asian householders
- $158,671Some other race householders
- $200,030Two or more races householders
- $148,267Hispanic or Latino householders
Household income for White non-Hispanic householders

Household income for Black householders

Household income for American Indian and Alaska Native householders

Household income for Asian householders

Household income for Two or more races householders

Household income for Hispanic or Latino race householders

Zip code: 74008