Races in Southwest Comanche, Oklahoma (OK) Detailed Stats
Ancestries, Foreign-born residents, place of birth
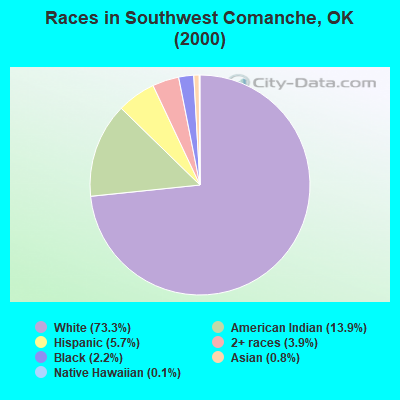
Race distribution in Southwest Comanche

- 6,38173.3%White alone
- 1,21013.9%American Indian alone
- 4985.7%Hispanic
- 3403.9%Two or more races
- 1952.2%Black alone
- 660.8%Asian alone
- 110.1%Native Hawaiian and Other
Pacific Islander alone - 40.05%Other race alone
2000
2022
-
- 2,556,36874.1%White alone
- 266,1587.7%American Indian alone
- 257,9817.5%Black alone
- 179,3045.2%Hispanic
- 140,2494.1%Two or more races
- 46,1721.3%Asian alone
- 2,3220.07%Other race alone
- 2,1000.06%Native Hawaiian and Other
Pacific Islander alone

-
- 2,517,40362.6%White alone
- 486,69212.1%Hispanic
- 364,4539.1%Two or more races
- 273,6506.8%American Indian alone
- 268,5436.7%Black alone
- 92,6722.3%Asian alone
- 10,7860.3%Other race alone
- 5,6010.1%Native Hawaiian and Other
Pacific Islander alone

Income and house value in Southwest Comanche
- Median household income in 2022
- $63,495White non-Hispanic householders
- $121,159Black householders
- $42,230American Indian and Alaska Native householders
- $95,119Asian householders
- $76,648Some other race householders
- $68,719Two or more races householders
- $86,246Hispanic or Latino race householders
- Median 2022 house value
- $152,097White Non-Hispanic householders
- $381,582Black or African American householders
- $113,610American Indian or Alaska Native householders
- $92,617Asian householders
- $210,960Native Hawaiian and other Pacific Islander householders
- $265,090Some other race householders
- $186,674Two or more races householders
- $215,077Hispanic or Latino householders
Household income for White non-Hispanic householders

Household income for Black householders

Household income for American Indian and Alaska Native householders

Household income for Asian householders

Household income for Native Hawaiian and other Pacific Islander householders

Household income for Two or more races householders

Household income for Hispanic or Latino race householders

Zip code: 73527