Races in St. Bethlehem, Tennessee (TN) Detailed Stats
Ancestries, Foreign-born residents, place of birth
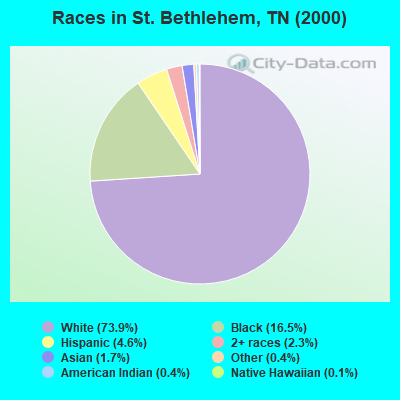
Race distribution in St. Bethlehem

- 16,84673.9%White alone
- 3,77216.5%Black alone
- 1,0434.6%Hispanic
- 5352.3%Two or more races
- 3851.7%Asian alone
- 970.4%Other race alone
- 830.4%American Indian alone
- 310.1%Native Hawaiian and Other
Pacific Islander alone
2000
2022
-
- 4,505,93079.2%White alone
- 928,20416.3%Black alone
- 123,8382.2%Hispanic
- 54,8241.0%Two or more races
- 56,0771.0%Asian alone
- 13,8200.2%American Indian alone
- 4,7800.08%Other race alone
- 1,8100.03%Native Hawaiian and Other
Pacific Islander alone

-
- 5,070,02671.9%White alone
- 1,089,73815.5%Black alone
- 442,6296.3%Hispanic
- 279,3814.0%Two or more races
- 131,8171.9%Asian alone
- 26,9720.4%Other race alone
- 6,3870.09%American Indian alone
- 4,3890.06%Native Hawaiian and Other
Pacific Islander alone

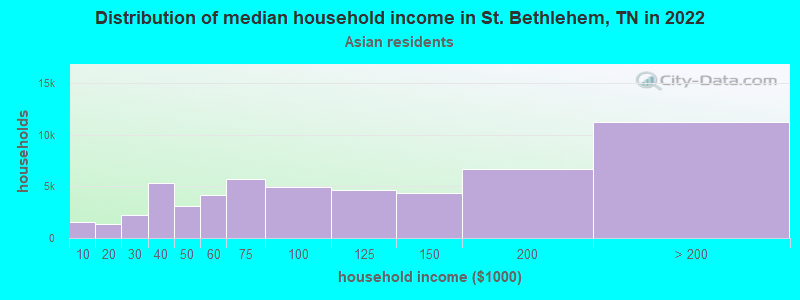
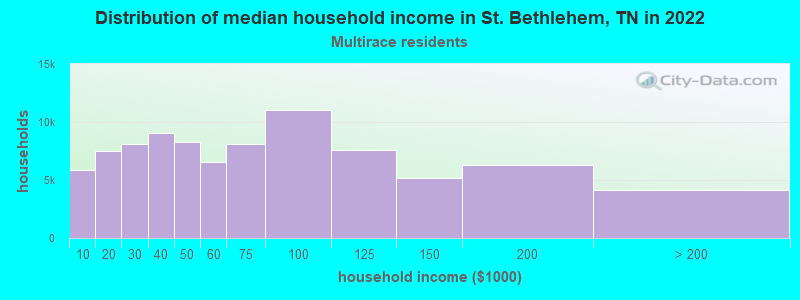
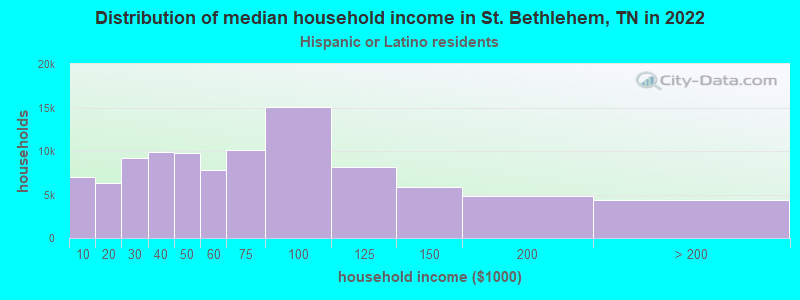
Income and house value in St. Bethlehem
- Median household income in 2022
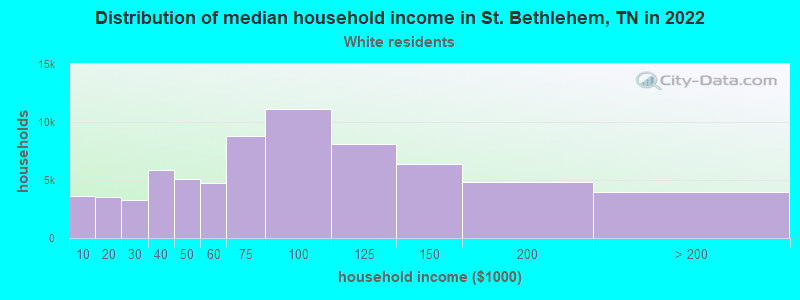
- $86,646White non-Hispanic householders
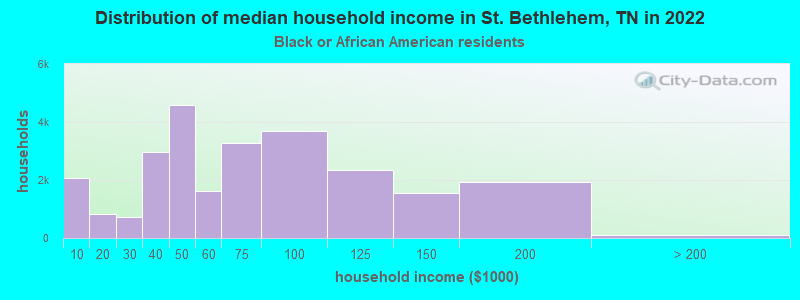
- $79,995Black householders
- $120,339Asian householders
- $77,630Some other race householders
- $60,322Two or more races householders
- $79,080Hispanic or Latino race householders
- Median 2022 house value
- $313,126White Non-Hispanic householders
- $300,892Black or African American householders
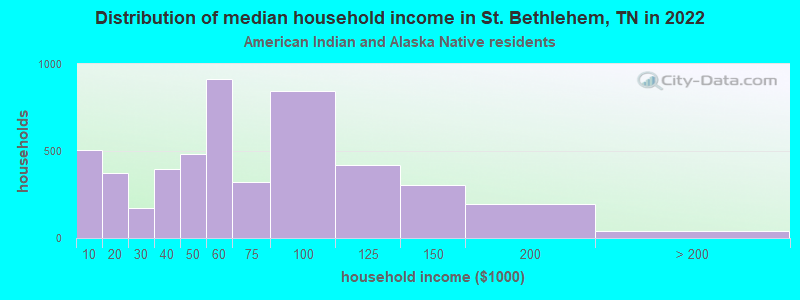
- $505,234American Indian or Alaska Native householders
- $442,410Asian householders
- $314,118Some other race householders
- $314,118Two or more races householders
- $329,328Hispanic or Latino householders
Household income for White non-Hispanic householders
Household income for Black householders
Household income for American Indian and Alaska Native householders
Household income for Asian householders
Household income for Two or more races householders
Household income for Hispanic or Latino race householders
Zip code: 37040