Races in Starkville, Mississippi (MS) Detailed Stats
Data:
Races - White alone (%)
Races - White alone (% change since 2000)
Races - Black alone (%)
Races - Black alone (% change since 2000)
Races - American Indian alone (%)
Races - American Indian alone (% change since 2000)
Races - Asian alone (%)
Races - Asian alone (% change since 2000)
Races - Hispanic (%)
Races - Hispanic (% change since 2000)
Races - Native Hawaiian and Other Pacific Islander alone (%)
Races - Native Hawaiian and Other Pacific Islander alone (% change since 2000)
Races - Two or more races(%)
Races - Two or more races(% change since 2000)
Races - Other race alone (%)
Races - Other race alone (% change since 2000)
Racial diversity
Place of birth - Born in state of residence (%)
Place of birth - Born in state of residence (%) - White
Place of birth - Born in state of residence (%) - Black or African American
Place of birth - Born in state of residence (%) - Asian
Place of birth - Born in state of residence (%) - Hispanic or Latino
Place of birth - Born in state of residence (%) - American Indian and Alaska Native
Place of birth - Born in state of residence (%) - Multirace
Place of birth - Born in state of residence (%) - Other Race
Place of birth - Born in other state (%)
Place of birth - Born in other state (%) - White
Place of birth - Born in other state (%) - Black or African American
Place of birth - Born in other state (%) - Asian
Place of birth - Born in other state (%) - Hispanic or Latino
Place of birth - Born in other state (%) - American Indian and Alaska Native
Place of birth - Born in other state (%) - Multirace
Place of birth - Born in other state (%) - Other Race
Place of birth - Native, outside of US (%)
Place of birth - Native, outside of US (%) - White
Place of birth - Native, outside of US (%) - Black or African American
Place of birth - Native, outside of US (%) - Asian
Place of birth - Native, outside of US (%) - Hispanic or Latino
Place of birth - Native, outside of US (%) - American Indian and Alaska Native
Place of birth - Native, outside of US (%) - Multirace
Place of birth - Native, outside of US (%) - Other Race
Place of birth - Foreign born (%)
Place of birth - Foreign born (%) - White
Place of birth - Foreign born (%) - Black or African American
Place of birth - Foreign born (%) - Asian
Place of birth - Foreign born (%) - Hispanic or Latino
Place of birth - Foreign born (%) - American Indian and Alaska Native
Place of birth - Foreign born (%) - Multirace
Place of birth - Foreign born (%) - Other Race
Residents speaking English at home (%)
Residents speaking English at home - Born in the United States (%)
Residents speaking English at home - Native, born elsewhere (%)
Residents speaking English at home - Foreign born (%)
Residents speaking Spanish at home (%)
Residents speaking Spanish at home - Born in the United States (%)
Residents speaking Spanish at home - Native, born elsewhere (%)
Residents speaking Spanish at home - Foreign born (%)
Residents speaking other language at home (%)
Residents speaking other language at home - Born in the United States (%)
Residents speaking other language at home - Native, born elsewhere (%)
Residents speaking other language at home - Foreign born (%)
Marital status - Never married (%)
Marital status - Now married (%)
Marital status - Separated (%)
Marital status - Widowed (%)
Marital status - Divorced (%)
Ancestries Reported - Arab (%)
Ancestries Reported - Czech (%)
Ancestries Reported - Danish (%)
Ancestries Reported - Dutch (%)
Ancestries Reported - English (%)
Ancestries Reported - French (%)
Ancestries Reported - French Canadian (%)
Ancestries Reported - German (%)
Ancestries Reported - Greek (%)
Ancestries Reported - Hungarian (%)
Ancestries Reported - Irish (%)
Ancestries Reported - Italian (%)
Ancestries Reported - Lithuanian (%)
Ancestries Reported - Norwegian (%)
Ancestries Reported - Polish (%)
Ancestries Reported - Portuguese (%)
Ancestries Reported - Russian (%)
Ancestries Reported - Scotch-Irish (%)
Ancestries Reported - Scottish (%)
Ancestries Reported - Slovak (%)
Ancestries Reported - Subsaharan African (%)
Ancestries Reported - Swedish (%)
Ancestries Reported - Swiss (%)
Ancestries Reported - Ukrainian (%)
Ancestries Reported - United States (%)
Ancestries Reported - Welsh (%)
Ancestries Reported - West Indian (%)
Ancestries Reported - Other (%)
Geographical mobility - Same house 1 year ago (%)
Geographical mobility - Same house 1 year ago (%) - White
Geographical mobility - Same house 1 year ago (%) - Black or African American
Geographical mobility - Same house 1 year ago (%) - Asian
Geographical mobility - Same house 1 year ago (%) - Hispanic or Latino
Geographical mobility - Same house 1 year ago (%) - American Indian and Alaska Native
Geographical mobility - Same house 1 year ago (%) - Multirace
Geographical mobility - Same house 1 year ago (%) - Other Race
Geographical mobility - Moved within same county (%)
Geographical mobility - Moved within same county (%) - White
Geographical mobility - Moved within same county (%) - Black or African American
Geographical mobility - Moved within same county (%) - Asian
Geographical mobility - Moved within same county (%) - Hispanic or Latino
Geographical mobility - Moved within same county (%) - American Indian and Alaska Native
Geographical mobility - Moved within same county (%) - Multirace
Geographical mobility - Moved within same county (%) - Other Race
Geographical mobility - Moved from different county within same state (%)
Geographical mobility - Moved from different county within same state (%) - White
Geographical mobility - Moved from different county within same state (%) - Black or African American
Geographical mobility - Moved from different county within same state (%) - Asian
Geographical mobility - Moved from different county within same state (%) - Hispanic or Latino
Geographical mobility - Moved from different county within same state (%) - American Indian and Alaska Native
Geographical mobility - Moved from different county within same state (%) - Multirace
Geographical mobility - Moved from different county within same state (%) - Other Race
Geographical mobility - Moved from different state (%)
Geographical mobility - Moved from different state (%) - White
Geographical mobility - Moved from different state (%) - Black or African American
Geographical mobility - Moved from different state (%) - Asian
Geographical mobility - Moved from different state (%) - Hispanic or Latino
Geographical mobility - Moved from different state (%) - American Indian and Alaska Native
Geographical mobility - Moved from different state (%) - Multirace
Geographical mobility - Moved from different state (%) - Other Race
Geographical mobility - Moved from abroad (%)
Geographical mobility - Moved from abroad (%) - White
Geographical mobility - Moved from abroad (%) - Black or African American
Geographical mobility - Moved from abroad (%) - Asian
Geographical mobility - Moved from abroad (%) - Hispanic or Latino
Geographical mobility - Moved from abroad (%) - American Indian and Alaska Native
Geographical mobility - Moved from abroad (%) - Multirace
Geographical mobility - Moved from abroad (%) - Other Race
Place of birth for the foreign-born population - Ireland (%)
Place of birth for the foreign-born population - Denmark (%)
Place of birth for the foreign-born population - Norway (%)
Place of birth for the foreign-born population - Sweden (%)
Place of birth for the foreign-born population - United Kingdom (%)
Place of birth for the foreign-born population - England (%)
Place of birth for the foreign-born population - Scotland (%)
Place of birth for the foreign-born population - Other Northern Europe (%)
Place of birth for the foreign-born population - Austria (%)
Place of birth for the foreign-born population - Belgium (%)
Place of birth for the foreign-born population - France (%)
Place of birth for the foreign-born population - Germany (%)
Place of birth for the foreign-born population - Netherlands (%)
Place of birth for the foreign-born population - Switzerland (%)
Place of birth for the foreign-born population - Other Western Europe (%)
Place of birth for the foreign-born population - Greece (%)
Place of birth for the foreign-born population - Italy (%)
Place of birth for the foreign-born population - Portugal (%)
Place of birth for the foreign-born population - Spain (%)
Place of birth for the foreign-born population - Other Southern Europe (%)
Place of birth for the foreign-born population - Albania (%)
Place of birth for the foreign-born population - Belarus (%)
Place of birth for the foreign-born population - Bosnia and Herzegovina (%)
Place of birth for the foreign-born population - Bulgaria (%)
Place of birth for the foreign-born population - Croatia (%)
Place of birth for the foreign-born population - Czechoslovakia (%)
Place of birth for the foreign-born population - Hungary (%)
Place of birth for the foreign-born population - Latvia (%)
Place of birth for the foreign-born population - Lithuania (%)
Place of birth for the foreign-born population - North Macedonia (Macedonia) (%)
Place of birth for the foreign-born population - Moldova (%)
Place of birth for the foreign-born population - Poland (%)
Place of birth for the foreign-born population - Romania (%)
Place of birth for the foreign-born population - Russia (%)
Place of birth for the foreign-born population - Serbia (%)
Place of birth for the foreign-born population - Ukraine (%)
Place of birth for the foreign-born population - Other Eastern Europe (%)
Place of birth for the foreign-born population - China (%)
Place of birth for the foreign-born population - Hong Kong (%)
Place of birth for the foreign-born population - Taiwan (%)
Place of birth for the foreign-born population - Japan (%)
Place of birth for the foreign-born population - Korea (%)
Place of birth for the foreign-born population - Other Eastern Asia (%)
Place of birth for the foreign-born population - Afghanistan (%)
Place of birth for the foreign-born population - Bangladesh (%)
Place of birth for the foreign-born population - India (%)
Place of birth for the foreign-born population - Iran (%)
Place of birth for the foreign-born population - Kazakhstan (%)
Place of birth for the foreign-born population - Nepal (%)
Place of birth for the foreign-born population - Pakistan (%)
Place of birth for the foreign-born population - Sri Lanka (%)
Place of birth for the foreign-born population - Uzbekistan (%)
Place of birth for the foreign-born population - Other South Central Asia (%)
Place of birth for the foreign-born population - Burma (%)
Place of birth for the foreign-born population - Cambodia (%)
Place of birth for the foreign-born population - Indonesia (%)
Place of birth for the foreign-born population - Laos (%)
Place of birth for the foreign-born population - Malaysia (%)
Place of birth for the foreign-born population - Philippines (%)
Place of birth for the foreign-born population - Singapore (%)
Place of birth for the foreign-born population - Thailand (%)
Place of birth for the foreign-born population - Vietnam (%)
Place of birth for the foreign-born population - Other South Eastern Asia (%)
Place of birth for the foreign-born population - Armenia (%)
Place of birth for the foreign-born population - Iraq (%)
Place of birth for the foreign-born population - Israel (%)
Place of birth for the foreign-born population - Jordan (%)
Place of birth for the foreign-born population - Kuwait (%)
Place of birth for the foreign-born population - Lebanon (%)
Place of birth for the foreign-born population - Saudi Arabia (%)
Place of birth for the foreign-born population - Syria (%)
Place of birth for the foreign-born population - Turkey (%)
Place of birth for the foreign-born population - Yemen (%)
Place of birth for the foreign-born population - Other Western Asia (%)
Place of birth for the foreign-born population - Eritrea (%)
Place of birth for the foreign-born population - Ethiopia (%)
Place of birth for the foreign-born population - Kenya (%)
Place of birth for the foreign-born population - Somalia (%)
Place of birth for the foreign-born population - Uganda (%)
Place of birth for the foreign-born population - Zimbabwe (%)
Place of birth for the foreign-born population - Other Eastern Africa (%)
Place of birth for the foreign-born population - Cameroon (%)
Place of birth for the foreign-born population - Congo (%)
Place of birth for the foreign-born population - Democratic Republic of Congo (Zaire) (%)
Place of birth for the foreign-born population - Other Middle Africa (%)
Place of birth for the foreign-born population - Egypt (%)
Place of birth for the foreign-born population - Morocco (%)
Place of birth for the foreign-born population - Sudan (%)
Place of birth for the foreign-born population - Other Northern Africa (%)
Place of birth for the foreign-born population - South Africa (%)
Place of birth for the foreign-born population - Other Southern Africa (%)
Place of birth for the foreign-born population - Cabo Verde (%)
Place of birth for the foreign-born population - Ghana (%)
Place of birth for the foreign-born population - Liberia (%)
Place of birth for the foreign-born population - Nigeria (%)
Place of birth for the foreign-born population - Senegal (%)
Place of birth for the foreign-born population - Sierra Leone (%)
Place of birth for the foreign-born population - Other Western Africa (%)
Place of birth for the foreign-born population - Australia (%)
Place of birth for the foreign-born population - New Zealand (%)
Place of birth for the foreign-born population - Fiji (%)
Place of birth for the foreign-born population - Micronesia (%)
Place of birth for the foreign-born population - Bahamas (%)
Place of birth for the foreign-born population - Barbados (%)
Place of birth for the foreign-born population - Cuba (%)
Place of birth for the foreign-born population - Dominica (%)
Place of birth for the foreign-born population - Dominican Republic (%)
Place of birth for the foreign-born population - Grenada (%)
Place of birth for the foreign-born population - Haiti (%)
Place of birth for the foreign-born population - Jamaica (%)
Place of birth for the foreign-born population - St. Vincent and the Grenadines (%)
Place of birth for the foreign-born population - Trinidad and Tobago (%)
Place of birth for the foreign-born population - West Indies (%)
Place of birth for the foreign-born population - Other Caribbean (%)
Place of birth for the foreign-born population - Belize (%)
Place of birth for the foreign-born population - Costa Rica (%)
Place of birth for the foreign-born population - El Salvador (%)
Place of birth for the foreign-born population - Guatemala (%)
Place of birth for the foreign-born population - Honduras (%)
Place of birth for the foreign-born population - Mexico (%)
Place of birth for the foreign-born population - Nicaragua (%)
Place of birth for the foreign-born population - Panama (%)
Place of birth for the foreign-born population - Other Central America (%)
Place of birth for the foreign-born population - Argentina (%)
Place of birth for the foreign-born population - Bolivia (%)
Place of birth for the foreign-born population - Brazil (%)
Place of birth for the foreign-born population - Chile (%)
Place of birth for the foreign-born population - Colombia (%)
Place of birth for the foreign-born population - Ecuador (%)
Place of birth for the foreign-born population - Guyana (%)
Place of birth for the foreign-born population - Peru (%)
Place of birth for the foreign-born population - Uruguay (%)
Place of birth for the foreign-born population - Venezuela (%)
Place of birth for the foreign-born population - Other South America (%)
Place of birth for the foreign-born population - Canada (%)
Place of birth for the foreign-born population - Other Northern America (%)
Place of birth for the foreign-born population - Other (%)
Latest news about races in Starkville, MS collected exclusively by city-data.com from local newspapers, TV, and radio stations
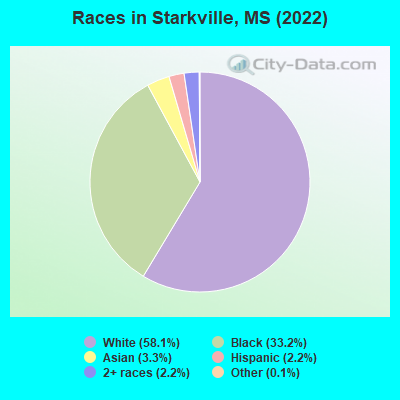
According to 2022 data, the most numerous races in Starkville, MS are White alone (14,005 residents), Black alone (8,004 residents), and Hispanic (526 residents). 94.9% of Starkville residents speak English at home. 5.0% of Starkville, MS residents are foreign-born (3.4% born in Asia), which is 59.8% greater than the foreign-born rate of 2.0% across the entire state of Mississippi.
Race distribution in Starkville
2000 2022
1,727,908 60.7% White alone 1,028,473 36.2% Black alone 39,569 1.4% Hispanic 17,272 0.6% Two or more races 18,349 0.6% Asian alone 11,224 0.4% American Indian alone 1,294 0.05% Other race alone 569 0.02% Native Hawaiian and Other
1,625,979 55.3% White alone 1,072,962 36.5% Black alone 97,177 3.3% Hispanic 96,367 3.3% Two or more races 25,217 0.9% Asian alone 12,457 0.4% American Indian alone 9,501 0.3% Other race alone 397 0.01% Native Hawaiian and Other
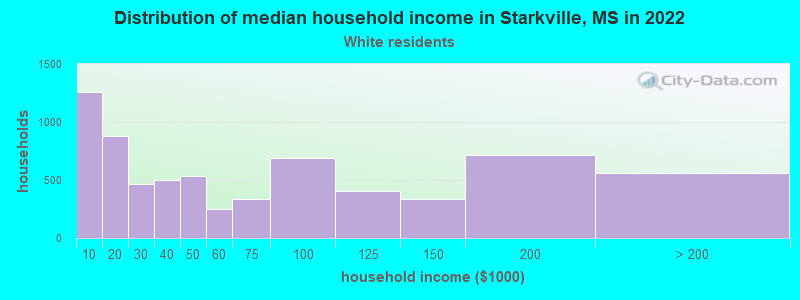
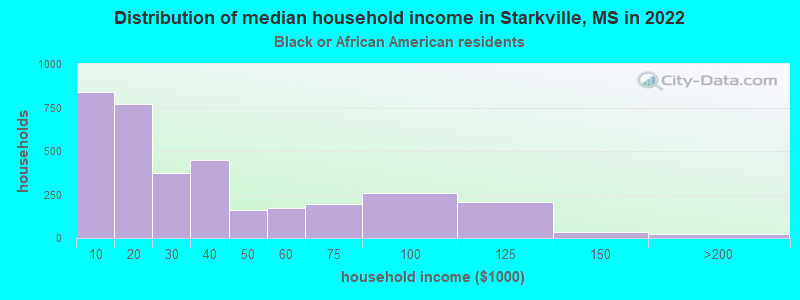
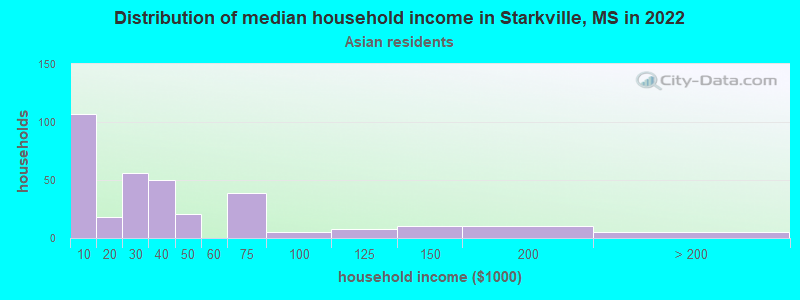
Income and house value in Starkville Median household income in 2022 $46,244 White non-Hispanic householders$23,687 Black householders$20,537 Asian householders$45,147 Some other race householders$32,344 Hispanic or Latino race householdersMedian 2022 house value $299,935 White Non-Hispanic householders$171,431 Black or African American householders$294,639 American Indian or Alaska Native householders $374,640 Asian householders$132,963 Two or more races householders$383,281 Hispanic or Latino householders
Median age by race in Starkville
27.2 Median age for White residents24.9 33.7 30.4 Median age for Black or African American residents25.5 34.9 -703,818,368.7 Median age for American Indian / Alaska Native residents-751,111,110.4 -710,601,718.5 32.7 Median age for Asian residents32.0 32.8 -666,666,666.0 Median age for Native Hawaiian / Pacific Islander residents-668,724,279.2 -670,599,802.7 27.2 Median age for Other race residents31.2 21.3 21.2 Median age for Two or more races residents21.0 21.9 27.2 Median age for White alone residents24.8 33.6 23.3 Median age for Hispanic or Latino residents24.2 20.8
Owner/renter occupied households by race in Starkville
House owners and renters - White residents 3,082 43.9% Owner occupied3,937 56.1% Renter occupiedHouse owners and renters - Black or African American residents 936 28.1% Owner occupied2,392 71.9% Renter occupiedHouse owners and renters - Asian residents 78 22.3% Owner occupied271 77.7% Renter occupiedHouse owners and renters - Other race residents 21 60.1% Owner occupied14 39.9% Renter occupiedHouse owners and renters - Two or more races residents 80 35.6% Owner occupied144 64.4% Renter occupiedHouse owners and renters - White alone residents 3,067 43.6% Owner occupied3,962 56.4% Renter occupiedHouse owners and renters - Hispanic or Latino residents 82 33.3% Owner occupied164 66.7% Renter occupied
Language usage in Starkville
English speakers - Total 94.9% of residents of Starkville speak English at home.
1.0% of residents speak Spanish at home 179 76.8% Speak English very well54 23.2% Speak English less than very well4.4% of residents speak other language at home 575 56.1% Speak English very well450 43.9% Speak English less than very well
English speakers - Born in the United States 97.4% of residents of Starkville speak English at home.
1.6% of residents speak Spanish at home 111 100.0% Speak English very well1.0% of residents speak other language at home 49 70.0% Speak English very well21 30.0% Speak English less than very well
English speakers - Native, born elsewhere 93.2% of residents of Starkville speak English at home.
5.7% of residents speak other language at home 5 100.0% Speak English very well
English speakers - Foreign-born 20.6% of residents of Starkville speak English at home.
7.5% of residents speak Spanish at home 34 41.0% Speak English very well49 59.0% Speak English less than very well74.5% of residents speak other language at home 464 56.2% Speak English very well362 43.8% Speak English less than very well
White (Caucasian) - Speak only English Native:
99.5% (13,253)Foreign-born:
47.0% (80)
White (Caucasian) - Speak another language Native:
0.6% (82)Foreign-born:
54.7% (93)
Black or African American - Speak only English Native:
99.8% (7,702)Foreign-born:
67.9% (88)
Black or African American - Speak another language Native:
0.2% (12)Foreign-born:
28.4% (37)
Asian - Speak only English Native:
43.1% (40)Foreign-born:
11.5% (79)
Asian - Speak another language Native:
58.2% (54)Foreign-born:
86.7% (594)
Other race - Speak another language Native:
32.0% (38)Foreign-born:
100.0% (32)
Two or more races - Speak another language Native:
9.5% (69)Foreign-born:
100.0% (18)
White alone - Speak only English Native:
99.3% (13,186)Foreign-born:
38.0% (84)
White alone - Speak another language Native:
0.7% (92)Foreign-born:
63.1% (140)
Hispanic or Latino - Speak only English Native:
79.8% (329)Foreign-born:
14.0% (13)
Hispanic or Latino - Speak another language Native:
21.4% (88)Foreign-born:
78.0% (75)
Foreign-born residents in Starkville 1,201 residents are foreign born (3.4% Asia ).
This city:
5.0%Mississippi:
2.3%
Marital status for residents in Starkville Marital status - White (Caucasian) population 15 years and over
Males 55.7% Never married40.3% Now married0.1% Separated1.8% Widowed2.1% DivorcedFemales 37.3% Never married45.3% Now married0.2% Separated10.3% Widowed6.9% DivorcedWomen who gave birth in the past 12 months Now married:
72.4% (74)Unmarried:
27.6% (28)
Women who did not give birth in the past 12 months Now married:
38.6% (1,269)Unmarried:
61.4% (2,021)
Marital status - Black or African American population 15 years and over
Males 67.0% Never married25.6% Now married3.1% Separated1.2% Widowed3.2% DivorcedFemales 58.9% Never married15.1% Now married8.1% Separated8.3% Widowed9.7% DivorcedWomen who gave birth in the past 12 months Now married:
0.0% (0)Unmarried:
100.0% (31)
Women who did not give birth in the past 12 months Now married:
22.0% (570)Unmarried:
78.0% (2,025)
Marital status - Asian population 15 years and over
Males 54.7% Never married45.3% Now married0.0% Separated0.0% Widowed0.0% DivorcedFemales 19.7% Never married55.1% Now married0.0% Separated25.2% Widowed0.0% DivorcedWomen who did not give birth in the past 12 months Now married:
66.3% (145)Unmarried:
33.7% (74)
Marital status - Other race population 15 years and over
Males 9.6% Never married90.4% Now married0.0% Separated0.0% Widowed0.0% DivorcedFemales 16.7% Never married83.3% Now married0.0% Separated0.0% Widowed0.0% DivorcedWomen who did not give birth in the past 12 months Now married:
78.8% (37)Unmarried:
21.2% (10)
Marital status - Two or more races population 15 years and over
Males 64.7% Never married26.7% Now married0.0% Separated0.0% Widowed8.6% DivorcedFemales 85.2% Never married12.4% Now married0.0% Separated2.4% Widowed0.0% DivorcedWomen who gave birth in the past 12 months Now married:
100.0% (5)Unmarried:
0.0% (0)
Women who did not give birth in the past 12 months Now married:
6.3% (20)Unmarried:
93.7% (303)
Marital status - White alone, not Hispanic / Latino population 15 years and over
Males 55.4% Never married40.7% Now married0.1% Separated1.8% Widowed2.0% DivorcedFemales 36.9% Never married45.7% Now married0.2% Separated10.4% Widowed6.8% DivorcedWomen who gave birth in the past 12 months Now married:
72.4% (75)Unmarried:
27.6% (29)
Women who did not give birth in the past 12 months Now married:
39.0% (1,276)Unmarried:
61.0% (1,998)
Marital status - Hispanic or Latino population 15 years and over
Males 63.5% Never married27.8% Now married0.0% Separated0.0% Widowed8.6% DivorcedFemales 64.8% Never married30.5% Now married0.0% Separated0.0% Widowed4.7% DivorcedWomen who gave birth in the past 12 months Now married:
100.0% (3)Unmarried:
0.0% (0)
Women who did not give birth in the past 12 months Now married:
24.2% (48)Unmarried:
75.8% (150)
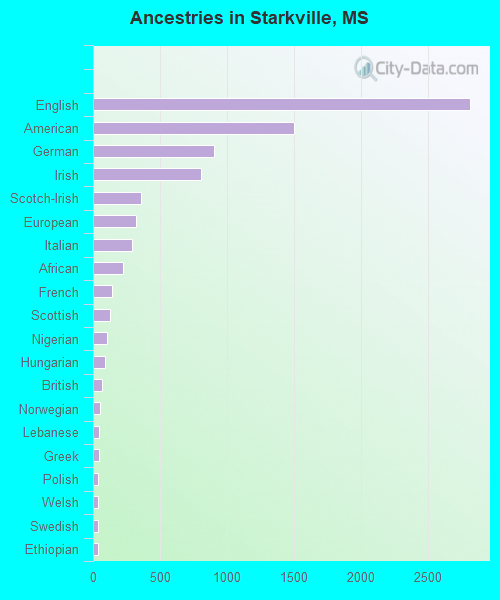
Ancestries in Starkville
2,816 17.8% English1,504 9.5% American907 5.7% German808 5.1% Irish355 2.2% Scotch-Irish323 2.0% European291 1.8% Italian221 1.4% African145 0.9% French127 0.8% Scottish104 0.7% Nigerian91 0.6% Hungarian67 0.4% British55 0.3% Norwegian47 0.3% Lebanese46 0.3% Greek39 0.2% Polish39 0.2% Welsh38 0.2% Swedish34 0.2% Ethiopian25 0.2% Ukrainian22 0.1% Slovak18 0.1% Turkish13 0.08% Dutch11 0.07% French Canadian10 0.06% Iranian10 0.06% Latvian9 0.06% Jamaican8 0.05% Northern European8 0.05% Brazilian6 0.04% Russian3 0.02% Portuguese1 0.01% Croatian
Geographical mobility in Starkville Same house 1 year ago 9,624 69.1% White (Caucasian)6,022 74.8% Black or African American20 99.4% American Indian / Alaska Native561 68.6% Asian34 100.0% Native Hawaiian / Pacific Islander85 48.2% Other race399 52.4% Two or more races9,638 69.2% White alone, not Hispanic / Latino329 64.5% Hispanic or LatinoMoved within same county 2,275 16.3% White / Caucasian1,128 14.0% Black or African American35 4.2% Asian30 17.1% Other race173 22.7% Two or more races2,313 16.6% White alone, not Hispanic / Latino55 10.8% Hispanic or LatinoMoved within same state 895 6.4% White / Caucasian703 8.7% Black or African American27 3.4% Asian53 30.0% Other race104 13.7% Two or more races889 6.4% White alone, not Hispanic / Latino61 11.9% Hispanic or LatinoMoved from different state 955 6.9% White / Caucasian44 0.6% Black or African American129 15.7% Asian39 5.1% Two or more races912 6.5% White alone, not Hispanic / Latino45 8.8% Hispanic or LatinoMoved from abroad 54 0.4% White63 7.7% Asian57 0.4% White alone, not Hispanic / Latino
Children Nativity (place of birth) in Starkville
Children under 6 years - Living with two parents Both parents native 727 96.5% Native26 3.5% Foreign-bornBoth parents foreign-born 50 100.0% NativeOne native, one foreign-born parent 18 100.0% NativeChildren under 6 years - Living with one parent Native parent 334 100.0% NativeChildren 6 to 17 years - Living with two parents Both parents native 1,676 98.3% Native29 1.7% Foreign-bornBoth parents foreign-born 79 91.7% Native7 8.3% Foreign-bornOne native, one foreign-born parent 48 100.0% NativeChildren 6 to 17 years - Living with one parent Native parent 1,065 100.0% NativeForeign-born parent 10 46.3% Native11 53.7% Foreign-born
Grandparents responsible for own grandchildren in Starkville
Grandparents (30 to 59 years) White / Caucasian 48 100.0% Responsible for grandchildrenBlack or African American 21 45.6% Responsible for grandchildren25 54.4% Not responsible for grandchildrenWhite alone, not Hispanic / Latino 49 100.0% Responsible for grandchildrenGrandparents (60 years and over) White / Caucasian 17 13.5% Responsible for grandchildren108 86.5% Not responsible for grandchildrenBlack or African American 3 8.1% Responsible for grandchildren37 91.9% Not responsible for grandchildrenWhite alone, not Hispanic / Latino 17 13.5% Responsible for grandchildren109 86.5% Not responsible for grandchildren