Races in Stillwater, Oklahoma (OK) Detailed Stats
Data:
Races - White alone (%)
Races - White alone (% change since 2000)
Races - Black alone (%)
Races - Black alone (% change since 2000)
Races - American Indian alone (%)
Races - American Indian alone (% change since 2000)
Races - Asian alone (%)
Races - Asian alone (% change since 2000)
Races - Hispanic (%)
Races - Hispanic (% change since 2000)
Races - Native Hawaiian and Other Pacific Islander alone (%)
Races - Native Hawaiian and Other Pacific Islander alone (% change since 2000)
Races - Two or more races(%)
Races - Two or more races(% change since 2000)
Races - Other race alone (%)
Races - Other race alone (% change since 2000)
Racial diversity
Place of birth - Born in state of residence (%)
Place of birth - Born in state of residence (%) - White
Place of birth - Born in state of residence (%) - Black or African American
Place of birth - Born in state of residence (%) - Asian
Place of birth - Born in state of residence (%) - Hispanic or Latino
Place of birth - Born in state of residence (%) - American Indian and Alaska Native
Place of birth - Born in state of residence (%) - Multirace
Place of birth - Born in state of residence (%) - Other Race
Place of birth - Born in other state (%)
Place of birth - Born in other state (%) - White
Place of birth - Born in other state (%) - Black or African American
Place of birth - Born in other state (%) - Asian
Place of birth - Born in other state (%) - Hispanic or Latino
Place of birth - Born in other state (%) - American Indian and Alaska Native
Place of birth - Born in other state (%) - Multirace
Place of birth - Born in other state (%) - Other Race
Place of birth - Native, outside of US (%)
Place of birth - Native, outside of US (%) - White
Place of birth - Native, outside of US (%) - Black or African American
Place of birth - Native, outside of US (%) - Asian
Place of birth - Native, outside of US (%) - Hispanic or Latino
Place of birth - Native, outside of US (%) - American Indian and Alaska Native
Place of birth - Native, outside of US (%) - Multirace
Place of birth - Native, outside of US (%) - Other Race
Place of birth - Foreign born (%)
Place of birth - Foreign born (%) - White
Place of birth - Foreign born (%) - Black or African American
Place of birth - Foreign born (%) - Asian
Place of birth - Foreign born (%) - Hispanic or Latino
Place of birth - Foreign born (%) - American Indian and Alaska Native
Place of birth - Foreign born (%) - Multirace
Place of birth - Foreign born (%) - Other Race
Residents speaking English at home (%)
Residents speaking English at home - Born in the United States (%)
Residents speaking English at home - Native, born elsewhere (%)
Residents speaking English at home - Foreign born (%)
Residents speaking Spanish at home (%)
Residents speaking Spanish at home - Born in the United States (%)
Residents speaking Spanish at home - Native, born elsewhere (%)
Residents speaking Spanish at home - Foreign born (%)
Residents speaking other language at home (%)
Residents speaking other language at home - Born in the United States (%)
Residents speaking other language at home - Native, born elsewhere (%)
Residents speaking other language at home - Foreign born (%)
Marital status - Never married (%)
Marital status - Now married (%)
Marital status - Separated (%)
Marital status - Widowed (%)
Marital status - Divorced (%)
Ancestries Reported - Arab (%)
Ancestries Reported - Czech (%)
Ancestries Reported - Danish (%)
Ancestries Reported - Dutch (%)
Ancestries Reported - English (%)
Ancestries Reported - French (%)
Ancestries Reported - French Canadian (%)
Ancestries Reported - German (%)
Ancestries Reported - Greek (%)
Ancestries Reported - Hungarian (%)
Ancestries Reported - Irish (%)
Ancestries Reported - Italian (%)
Ancestries Reported - Lithuanian (%)
Ancestries Reported - Norwegian (%)
Ancestries Reported - Polish (%)
Ancestries Reported - Portuguese (%)
Ancestries Reported - Russian (%)
Ancestries Reported - Scotch-Irish (%)
Ancestries Reported - Scottish (%)
Ancestries Reported - Slovak (%)
Ancestries Reported - Subsaharan African (%)
Ancestries Reported - Swedish (%)
Ancestries Reported - Swiss (%)
Ancestries Reported - Ukrainian (%)
Ancestries Reported - United States (%)
Ancestries Reported - Welsh (%)
Ancestries Reported - West Indian (%)
Ancestries Reported - Other (%)
Geographical mobility - Same house 1 year ago (%)
Geographical mobility - Same house 1 year ago (%) - White
Geographical mobility - Same house 1 year ago (%) - Black or African American
Geographical mobility - Same house 1 year ago (%) - Asian
Geographical mobility - Same house 1 year ago (%) - Hispanic or Latino
Geographical mobility - Same house 1 year ago (%) - American Indian and Alaska Native
Geographical mobility - Same house 1 year ago (%) - Multirace
Geographical mobility - Same house 1 year ago (%) - Other Race
Geographical mobility - Moved within same county (%)
Geographical mobility - Moved within same county (%) - White
Geographical mobility - Moved within same county (%) - Black or African American
Geographical mobility - Moved within same county (%) - Asian
Geographical mobility - Moved within same county (%) - Hispanic or Latino
Geographical mobility - Moved within same county (%) - American Indian and Alaska Native
Geographical mobility - Moved within same county (%) - Multirace
Geographical mobility - Moved within same county (%) - Other Race
Geographical mobility - Moved from different county within same state (%)
Geographical mobility - Moved from different county within same state (%) - White
Geographical mobility - Moved from different county within same state (%) - Black or African American
Geographical mobility - Moved from different county within same state (%) - Asian
Geographical mobility - Moved from different county within same state (%) - Hispanic or Latino
Geographical mobility - Moved from different county within same state (%) - American Indian and Alaska Native
Geographical mobility - Moved from different county within same state (%) - Multirace
Geographical mobility - Moved from different county within same state (%) - Other Race
Geographical mobility - Moved from different state (%)
Geographical mobility - Moved from different state (%) - White
Geographical mobility - Moved from different state (%) - Black or African American
Geographical mobility - Moved from different state (%) - Asian
Geographical mobility - Moved from different state (%) - Hispanic or Latino
Geographical mobility - Moved from different state (%) - American Indian and Alaska Native
Geographical mobility - Moved from different state (%) - Multirace
Geographical mobility - Moved from different state (%) - Other Race
Geographical mobility - Moved from abroad (%)
Geographical mobility - Moved from abroad (%) - White
Geographical mobility - Moved from abroad (%) - Black or African American
Geographical mobility - Moved from abroad (%) - Asian
Geographical mobility - Moved from abroad (%) - Hispanic or Latino
Geographical mobility - Moved from abroad (%) - American Indian and Alaska Native
Geographical mobility - Moved from abroad (%) - Multirace
Geographical mobility - Moved from abroad (%) - Other Race
Place of birth for the foreign-born population - Ireland (%)
Place of birth for the foreign-born population - Denmark (%)
Place of birth for the foreign-born population - Norway (%)
Place of birth for the foreign-born population - Sweden (%)
Place of birth for the foreign-born population - United Kingdom (%)
Place of birth for the foreign-born population - England (%)
Place of birth for the foreign-born population - Scotland (%)
Place of birth for the foreign-born population - Other Northern Europe (%)
Place of birth for the foreign-born population - Austria (%)
Place of birth for the foreign-born population - Belgium (%)
Place of birth for the foreign-born population - France (%)
Place of birth for the foreign-born population - Germany (%)
Place of birth for the foreign-born population - Netherlands (%)
Place of birth for the foreign-born population - Switzerland (%)
Place of birth for the foreign-born population - Other Western Europe (%)
Place of birth for the foreign-born population - Greece (%)
Place of birth for the foreign-born population - Italy (%)
Place of birth for the foreign-born population - Portugal (%)
Place of birth for the foreign-born population - Spain (%)
Place of birth for the foreign-born population - Other Southern Europe (%)
Place of birth for the foreign-born population - Albania (%)
Place of birth for the foreign-born population - Belarus (%)
Place of birth for the foreign-born population - Bosnia and Herzegovina (%)
Place of birth for the foreign-born population - Bulgaria (%)
Place of birth for the foreign-born population - Croatia (%)
Place of birth for the foreign-born population - Czechoslovakia (%)
Place of birth for the foreign-born population - Hungary (%)
Place of birth for the foreign-born population - Latvia (%)
Place of birth for the foreign-born population - Lithuania (%)
Place of birth for the foreign-born population - North Macedonia (Macedonia) (%)
Place of birth for the foreign-born population - Moldova (%)
Place of birth for the foreign-born population - Poland (%)
Place of birth for the foreign-born population - Romania (%)
Place of birth for the foreign-born population - Russia (%)
Place of birth for the foreign-born population - Serbia (%)
Place of birth for the foreign-born population - Ukraine (%)
Place of birth for the foreign-born population - Other Eastern Europe (%)
Place of birth for the foreign-born population - China (%)
Place of birth for the foreign-born population - Hong Kong (%)
Place of birth for the foreign-born population - Taiwan (%)
Place of birth for the foreign-born population - Japan (%)
Place of birth for the foreign-born population - Korea (%)
Place of birth for the foreign-born population - Other Eastern Asia (%)
Place of birth for the foreign-born population - Afghanistan (%)
Place of birth for the foreign-born population - Bangladesh (%)
Place of birth for the foreign-born population - India (%)
Place of birth for the foreign-born population - Iran (%)
Place of birth for the foreign-born population - Kazakhstan (%)
Place of birth for the foreign-born population - Nepal (%)
Place of birth for the foreign-born population - Pakistan (%)
Place of birth for the foreign-born population - Sri Lanka (%)
Place of birth for the foreign-born population - Uzbekistan (%)
Place of birth for the foreign-born population - Other South Central Asia (%)
Place of birth for the foreign-born population - Burma (%)
Place of birth for the foreign-born population - Cambodia (%)
Place of birth for the foreign-born population - Indonesia (%)
Place of birth for the foreign-born population - Laos (%)
Place of birth for the foreign-born population - Malaysia (%)
Place of birth for the foreign-born population - Philippines (%)
Place of birth for the foreign-born population - Singapore (%)
Place of birth for the foreign-born population - Thailand (%)
Place of birth for the foreign-born population - Vietnam (%)
Place of birth for the foreign-born population - Other South Eastern Asia (%)
Place of birth for the foreign-born population - Armenia (%)
Place of birth for the foreign-born population - Iraq (%)
Place of birth for the foreign-born population - Israel (%)
Place of birth for the foreign-born population - Jordan (%)
Place of birth for the foreign-born population - Kuwait (%)
Place of birth for the foreign-born population - Lebanon (%)
Place of birth for the foreign-born population - Saudi Arabia (%)
Place of birth for the foreign-born population - Syria (%)
Place of birth for the foreign-born population - Turkey (%)
Place of birth for the foreign-born population - Yemen (%)
Place of birth for the foreign-born population - Other Western Asia (%)
Place of birth for the foreign-born population - Eritrea (%)
Place of birth for the foreign-born population - Ethiopia (%)
Place of birth for the foreign-born population - Kenya (%)
Place of birth for the foreign-born population - Somalia (%)
Place of birth for the foreign-born population - Uganda (%)
Place of birth for the foreign-born population - Zimbabwe (%)
Place of birth for the foreign-born population - Other Eastern Africa (%)
Place of birth for the foreign-born population - Cameroon (%)
Place of birth for the foreign-born population - Congo (%)
Place of birth for the foreign-born population - Democratic Republic of Congo (Zaire) (%)
Place of birth for the foreign-born population - Other Middle Africa (%)
Place of birth for the foreign-born population - Egypt (%)
Place of birth for the foreign-born population - Morocco (%)
Place of birth for the foreign-born population - Sudan (%)
Place of birth for the foreign-born population - Other Northern Africa (%)
Place of birth for the foreign-born population - South Africa (%)
Place of birth for the foreign-born population - Other Southern Africa (%)
Place of birth for the foreign-born population - Cabo Verde (%)
Place of birth for the foreign-born population - Ghana (%)
Place of birth for the foreign-born population - Liberia (%)
Place of birth for the foreign-born population - Nigeria (%)
Place of birth for the foreign-born population - Senegal (%)
Place of birth for the foreign-born population - Sierra Leone (%)
Place of birth for the foreign-born population - Other Western Africa (%)
Place of birth for the foreign-born population - Australia (%)
Place of birth for the foreign-born population - New Zealand (%)
Place of birth for the foreign-born population - Fiji (%)
Place of birth for the foreign-born population - Micronesia (%)
Place of birth for the foreign-born population - Bahamas (%)
Place of birth for the foreign-born population - Barbados (%)
Place of birth for the foreign-born population - Cuba (%)
Place of birth for the foreign-born population - Dominica (%)
Place of birth for the foreign-born population - Dominican Republic (%)
Place of birth for the foreign-born population - Grenada (%)
Place of birth for the foreign-born population - Haiti (%)
Place of birth for the foreign-born population - Jamaica (%)
Place of birth for the foreign-born population - St. Vincent and the Grenadines (%)
Place of birth for the foreign-born population - Trinidad and Tobago (%)
Place of birth for the foreign-born population - West Indies (%)
Place of birth for the foreign-born population - Other Caribbean (%)
Place of birth for the foreign-born population - Belize (%)
Place of birth for the foreign-born population - Costa Rica (%)
Place of birth for the foreign-born population - El Salvador (%)
Place of birth for the foreign-born population - Guatemala (%)
Place of birth for the foreign-born population - Honduras (%)
Place of birth for the foreign-born population - Mexico (%)
Place of birth for the foreign-born population - Nicaragua (%)
Place of birth for the foreign-born population - Panama (%)
Place of birth for the foreign-born population - Other Central America (%)
Place of birth for the foreign-born population - Argentina (%)
Place of birth for the foreign-born population - Bolivia (%)
Place of birth for the foreign-born population - Brazil (%)
Place of birth for the foreign-born population - Chile (%)
Place of birth for the foreign-born population - Colombia (%)
Place of birth for the foreign-born population - Ecuador (%)
Place of birth for the foreign-born population - Guyana (%)
Place of birth for the foreign-born population - Peru (%)
Place of birth for the foreign-born population - Uruguay (%)
Place of birth for the foreign-born population - Venezuela (%)
Place of birth for the foreign-born population - Other South America (%)
Place of birth for the foreign-born population - Canada (%)
Place of birth for the foreign-born population - Other Northern America (%)
Place of birth for the foreign-born population - Other (%)
Latest news about races in Stillwater, OK collected exclusively by city-data.com from local newspapers, TV, and radio stations
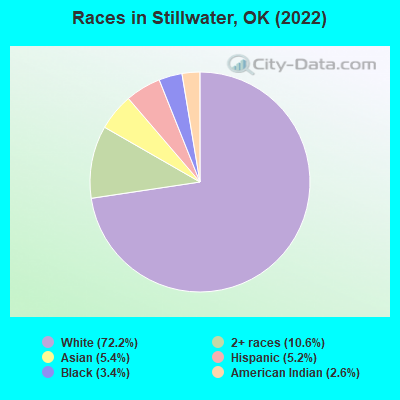
According to 2022 data, the most numerous races in Stillwater, OK are White alone (35,415 residents), Hispanic (2,548 residents), and Two or more races (5,212 residents). 90.1% of Stillwater residents speak English at home. 9.6% of Stillwater, OK residents are foreign-born (6.9% born in Asia), which is 37.5% greater than the foreign-born rate of 6.0% across the entire state of Oklahoma.
Race distribution in Stillwater
2000 2022
31,745 81.3% White alone 1,965 5.0% Asian alone 1,666 4.3% Black alone 1,469 3.8% American Indian alone 1,186 3.0% Two or more races 976 2.5% Hispanic 45 0.1% Other race alone 13 0.03% Native Hawaiian and Other
35,415 72.2% White alone 5,212 10.6% Two or more races 2,670 5.4% Asian alone 2,548 5.2% Hispanic 1,663 3.4% Black alone 1,295 2.6% American Indian alone 36 0.07% Native Hawaiian and Other 29 0.06% Other race alone
2000 2022
2,556,368 74.1% White alone 266,158 7.7% American Indian alone 257,981 7.5% Black alone 179,304 5.2% Hispanic 140,249 4.1% Two or more races 46,172 1.3% Asian alone 2,322 0.07% Other race alone 2,100 0.06% Native Hawaiian and Other
2,517,403 62.6% White alone 486,692 12.1% Hispanic 364,453 9.1% Two or more races 273,650 6.8% American Indian alone 268,543 6.7% Black alone 92,672 2.3% Asian alone 10,786 0.3% Other race alone 5,601 0.1% Native Hawaiian and Other
Income and house value in Stillwater Median household income in 2022 $46,515 White non-Hispanic householders$25,729 Black householders$26,491 American Indian and Alaska Native householders$26,961 Asian householders$60,929 Some other race householders$17,086 Two or more races householders$29,416 Hispanic or Latino race householdersMedian 2022 house value $256,304 White Non-Hispanic householders$196,955 Black or African American householders$254,466 American Indian or Alaska Native householders $341,389 Asian householders$245,800 Some other race householders$244,749 Two or more races householders$223,215 Hispanic or Latino householders
Median age by race in Stillwater
24.2 Median age for White residents24.1 24.4 27.6 Median age for Black or African American residents34.1 18.9 26.7 Median age for American Indian / Alaska Native residents26.1 23.8 29.2 Median age for Asian residents27.2 31.4 23.5 Median age for Native Hawaiian / Pacific Islander residents-675,324,674.6 -767,251,461.2 36.9 Median age for Other race residents24.8 32.9 22.0 Median age for Two or more races residents21.8 21.5 24.1 Median age for White alone residents23.9 25.1 19.5 Median age for Hispanic or Latino residents19.3 19.5
Owner/renter occupied households by race in Stillwater
House owners and renters - White residents 6,325 41.8% Owner occupied8,809 58.2% Renter occupiedHouse owners and renters - Black or African American residents 122 20.1% Owner occupied484 79.9% Renter occupiedHouse owners and renters - American Indian / Alaska Native residents 96 24.7% Owner occupied294 75.3% Renter occupiedHouse owners and renters - Asian residents 109 7.4% Owner occupied1,367 92.6% Renter occupiedHouse owners and renters - Native Hawaiian / Pacific Islander residents 35 100.0% Renter occupiedHouse owners and renters - Other race residents 88 69.1% Owner occupied39 30.9% Renter occupiedHouse owners and renters - Two or more races residents 419 19.6% Owner occupied1,716 80.4% Renter occupiedHouse owners and renters - White alone residents 6,241 42.2% Owner occupied8,565 57.8% Renter occupiedHouse owners and renters - Hispanic or Latino residents 172 27.6% Owner occupied451 72.4% Renter occupied
Language usage in Stillwater
English speakers - Total 90.1% of residents of Stillwater speak English at home.
1.9% of residents speak Spanish at home 775 86.8% Speak English very well118 13.2% Speak English less than very well7.4% of residents speak other language at home 2,405 68.8% Speak English very well1,092 31.2% Speak English less than very well
English speakers - Born in the United States 97.9% of residents of Stillwater speak English at home.
1.1% of residents speak Spanish at home 188 92.2% Speak English very well16 7.8% Speak English less than very well1.4% of residents speak other language at home 217 80.1% Speak English very well54 19.9% Speak English less than very well
English speakers - Native, born elsewhere 97.3% of residents of Stillwater speak English at home.
7.3% of residents speak Spanish at home 16 100.0% Speak English very well38.6% of residents speak other language at home 85 100.0% Speak English very well
English speakers - Foreign-born 18.9% of residents of Stillwater speak English at home.
4.1% of residents speak Spanish at home 79 49.7% Speak English very well80 50.3% Speak English less than very well77.4% of residents speak other language at home 1,829 61.6% Speak English very well1,142 38.4% Speak English less than very well
White (Caucasian) - Speak only English Native:
99.0% (33,451)Foreign-born:
43.3% (598)
White (Caucasian) - Speak another language Native:
1.0% (344)Foreign-born:
57.1% (788)
Black or African American - Speak only English Native:
100.0% (1,614)Foreign-born:
4.5% (15)
American Indian / Alaska Native - Speak only English Native:
98.6% (1,554)Foreign-born:
10.4% (4)
American Indian / Alaska Native - Speak another language Native:
1.4% (22)Foreign-born:
90.3% (31)
Asian - Speak only English Native:
60.4% (351)Foreign-born:
8.1% (185)
Asian - Speak another language Native:
39.5% (230)Foreign-born:
92.4% (2,109)
Native Hawaiian / Pacific Islander - Speak only English Native:
100.0% (47)Foreign-born:
78.9% (3)
Other race - Speak only English Native:
47.5% (123)Foreign-born:
2.6% (7)
Other race - Speak another language Native:
51.9% (135)Foreign-born:
97.3% (265)
Two or more races - Speak only English Native:
85.0% (4,232)Foreign-born:
7.5% (41)
Two or more races - Speak another language Native:
15.0% (749)Foreign-born:
92.0% (495)
White alone - Speak only English Native:
99.1% (32,574)Foreign-born:
36.8% (518)
White alone - Speak another language Native:
0.9% (306)Foreign-born:
63.1% (890)
Hispanic or Latino - Speak only English Native:
66.9% (1,453)Foreign-born:
9.9% (21)
Hispanic or Latino - Speak another language Native:
31.7% (689)Foreign-born:
87.0% (181)
Foreign-born residents in Stillwater 4,715 residents are foreign born (6.9% Asia ).
This city:
9.6%Oklahoma:
6.1%
Marital status for residents in Stillwater Marital status - White (Caucasian) population 15 years and over
Males 61.5% Never married31.2% Now married0.4% Separated2.5% Widowed4.5% DivorcedFemales 53.1% Never married29.8% Now married0.8% Separated7.4% Widowed8.9% DivorcedWomen who gave birth in the past 12 months Now married:
73.1% (171)Unmarried:
26.9% (63)
Women who did not give birth in the past 12 months Now married:
23.0% (2,661)Unmarried:
77.0% (8,921)
Marital status - Black or African American population 15 years and over
Males 68.4% Never married28.2% Now married0.0% Separated0.0% Widowed3.3% DivorcedFemales 60.2% Never married25.9% Now married1.1% Separated11.2% Widowed1.6% DivorcedWomen who gave birth in the past 12 months Now married:
58.3% (69)Unmarried:
41.7% (50)
Women who did not give birth in the past 12 months Now married:
21.1% (94)Unmarried:
78.9% (350)
Marital status - American Indian / Alaska Native population 15 years and over
Males 80.2% Never married14.3% Now married0.0% Separated1.3% Widowed4.2% DivorcedFemales 72.5% Never married21.3% Now married1.0% Separated2.8% Widowed2.3% DivorcedWomen who gave birth in the past 12 months Now married:
0.0% (0)Unmarried:
100.0% (10)
Women who did not give birth in the past 12 months Now married:
21.6% (153)Unmarried:
78.4% (555)
Marital status - Asian population 15 years and over
Males 65.2% Never married34.8% Now married0.0% Separated0.0% Widowed0.0% DivorcedFemales 58.9% Never married33.5% Now married0.0% Separated3.1% Widowed4.5% DivorcedWomen who gave birth in the past 12 months Now married:
100.0% (18)Unmarried:
0.0% (0)
Women who did not give birth in the past 12 months Now married:
23.9% (240)Unmarried:
76.1% (763)
Marital status - Native Hawaiian / Pacific Islander population 15 years and over
Males 100.0% Never married0.0% Now married0.0% Separated0.0% Widowed0.0% DivorcedFemales 50.0% Never married50.0% Now married0.0% Separated0.0% Widowed0.0% DivorcedWomen who did not give birth in the past 12 months Now married:
50.0% (6)Unmarried:
50.0% (6)
Marital status - Other race population 15 years and over
Males 52.3% Never married21.2% Now married0.0% Separated0.0% Widowed26.4% DivorcedFemales 49.2% Never married20.5% Now married8.7% Separated0.0% Widowed21.7% DivorcedWomen who gave birth in the past 12 months Now married:
100.0% (3)Unmarried:
0.0% (0)
Women who did not give birth in the past 12 months Now married:
21.4% (57)Unmarried:
78.6% (209)
Marital status - Two or more races population 15 years and over
Males 76.6% Never married17.0% Now married0.1% Separated0.0% Widowed6.3% DivorcedFemales 81.3% Never married12.1% Now married0.0% Separated0.6% Widowed5.9% DivorcedWomen who gave birth in the past 12 months Now married:
0.0% (0)Unmarried:
100.0% (16)
Women who did not give birth in the past 12 months Now married:
7.6% (146)Unmarried:
92.4% (1,781)
Marital status - White alone, not Hispanic / Latino population 15 years and over
Males 61.1% Never married31.6% Now married0.4% Separated2.5% Widowed4.5% DivorcedFemales 53.1% Never married29.5% Now married0.8% Separated7.6% Widowed8.9% DivorcedWomen who gave birth in the past 12 months Now married:
74.7% (169)Unmarried:
25.3% (57)
Women who did not give birth in the past 12 months Now married:
22.8% (2,527)Unmarried:
77.2% (8,572)
Marital status - Hispanic or Latino population 15 years and over
Males 72.1% Never married19.9% Now married0.5% Separated0.0% Widowed7.5% DivorcedFemales 66.7% Never married23.3% Now married2.2% Separated0.1% Widowed7.8% DivorcedWomen who gave birth in the past 12 months Now married:
37.5% (3)Unmarried:
62.5% (5)
Women who did not give birth in the past 12 months Now married:
18.2% (179)Unmarried:
81.8% (804)
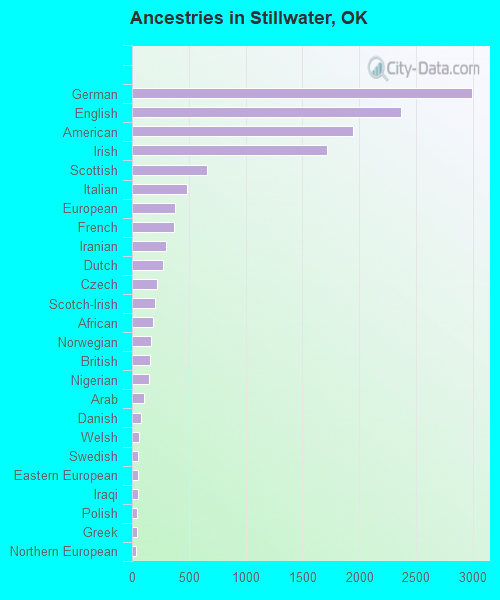
Ancestries in Stillwater
2,994 13.9% German2,369 11.0% English1,949 9.1% American1,718 8.0% Irish664 3.1% Scottish481 2.2% Italian380 1.8% European367 1.7% French302 1.4% Iranian270 1.3% Dutch222 1.0% Czech203 0.9% Scotch-Irish181 0.8% African170 0.8% Norwegian158 0.7% British149 0.7% Nigerian104 0.5% Arab82 0.4% Danish66 0.3% Welsh54 0.3% Swedish53 0.2% Eastern European51 0.2% Iraqi46 0.2% Polish43 0.2% Greek34 0.2% Northern European34 0.2% Turkish33 0.2% Afghan31 0.1% Egyptian24 0.1% Lebanese23 0.1% Czechoslovakian18 0.08% Swiss17 0.08% Finnish14 0.07% Basque13 0.06% Slovak13 0.06% Lithuanian13 0.06% Canadian12 0.06% Estonian8 0.04% Pennsylvania German7 0.03% French Canadian6 0.03% Ghanaian3 0.01% Belizean
Geographical mobility in Stillwater Same house 1 year ago 23,778 65.8% White (Caucasian)1,504 70.7% Black or African American1,103 67.5% American Indian / Alaska Native2,169 71.9% Asian7 16.0% Native Hawaiian / Pacific Islander397 70.7% Other race4,257 64.3% Two or more races23,022 65.5% White alone, not Hispanic / Latino1,764 68.7% Hispanic or LatinoMoved within same county 6,235 17.3% White / Caucasian170 8.0% Black or African American98 6.0% American Indian / Alaska Native288 9.5% Asian26 58.2% Native Hawaiian / Pacific Islander113 20.1% Other race956 14.5% Two or more races5,974 17.0% White alone, not Hispanic / Latino412 16.0% Hispanic or LatinoMoved within same state 2,290 6.3% White / Caucasian283 13.3% Black or African American375 22.9% American Indian / Alaska Native2 0.1% Asian17 3.0% Other race748 11.3% Two or more races2,302 6.6% White alone, not Hispanic / Latino195 7.6% Hispanic or LatinoMoved from different state 3,640 10.1% White / Caucasian111 5.2% Black or African American4 0.2% American Indian / Alaska Native27 0.9% Asian525 7.9% Two or more races3,639 10.4% White alone, not Hispanic / Latino305 11.9% Hispanic or LatinoMoved from abroad 171 0.5% White84 3.9% Black or African American35 2.2% American Indian / Alaska Native587 19.5% Asian23 4.1% Other race95 1.4% Two or more races171 0.5% White alone, not Hispanic / Latino16 0.6% Hispanic or Latino
Children Nativity (place of birth) in Stillwater
Children under 6 years - Living with two parents Both parents native 1,233 100.0% NativeBoth parents foreign-born 148 70.8% Native61 29.2% Foreign-bornOne native, one foreign-born parent 44 100.0% NativeChildren under 6 years - Living with one parent Native parent 746 100.0% NativeForeign-born parent 13 100.0% NativeChildren 6 to 17 years - Living with two parents Both parents native 2,396 98.1% Native47 1.9% Foreign-bornBoth parents foreign-born 217 77.6% Native63 22.4% Foreign-bornOne native, one foreign-born parent 242 100.0% NativeChildren 6 to 17 years - Living with one parent Native parent 1,602 100.0% NativeForeign-born parent 49 49.9% Native50 50.1% Foreign-born
Grandparents responsible for own grandchildren in Stillwater
Grandparents (30 to 59 years) White / Caucasian 8 100.0% Responsible for grandchildrenTwo or more races 4 100.0% Not responsible for grandchildrenWhite alone, not Hispanic / Latino 9 100.0% Responsible for grandchildren
Grandparents (60 years and over) White / Caucasian 27 100.0% Not responsible for grandchildrenTwo or more races 3 100.0% Not responsible for grandchildrenWhite alone, not Hispanic / Latino 28 100.0% Not responsible for grandchildren