Races in Trumbull, Connecticut (CT) Detailed Stats
Data:
Races - White alone (%)
Races - White alone (% change since 2000)
Races - Black alone (%)
Races - Black alone (% change since 2000)
Races - American Indian alone (%)
Races - American Indian alone (% change since 2000)
Races - Asian alone (%)
Races - Asian alone (% change since 2000)
Races - Hispanic (%)
Races - Hispanic (% change since 2000)
Races - Native Hawaiian and Other Pacific Islander alone (%)
Races - Native Hawaiian and Other Pacific Islander alone (% change since 2000)
Races - Two or more races(%)
Races - Two or more races(% change since 2000)
Races - Other race alone (%)
Races - Other race alone (% change since 2000)
Racial diversity
Place of birth - Born in state of residence (%)
Place of birth - Born in state of residence (%) - White
Place of birth - Born in state of residence (%) - Black or African American
Place of birth - Born in state of residence (%) - Asian
Place of birth - Born in state of residence (%) - Hispanic or Latino
Place of birth - Born in state of residence (%) - American Indian and Alaska Native
Place of birth - Born in state of residence (%) - Multirace
Place of birth - Born in state of residence (%) - Other Race
Place of birth - Born in other state (%)
Place of birth - Born in other state (%) - White
Place of birth - Born in other state (%) - Black or African American
Place of birth - Born in other state (%) - Asian
Place of birth - Born in other state (%) - Hispanic or Latino
Place of birth - Born in other state (%) - American Indian and Alaska Native
Place of birth - Born in other state (%) - Multirace
Place of birth - Born in other state (%) - Other Race
Place of birth - Native, outside of US (%)
Place of birth - Native, outside of US (%) - White
Place of birth - Native, outside of US (%) - Black or African American
Place of birth - Native, outside of US (%) - Asian
Place of birth - Native, outside of US (%) - Hispanic or Latino
Place of birth - Native, outside of US (%) - American Indian and Alaska Native
Place of birth - Native, outside of US (%) - Multirace
Place of birth - Native, outside of US (%) - Other Race
Place of birth - Foreign born (%)
Place of birth - Foreign born (%) - White
Place of birth - Foreign born (%) - Black or African American
Place of birth - Foreign born (%) - Asian
Place of birth - Foreign born (%) - Hispanic or Latino
Place of birth - Foreign born (%) - American Indian and Alaska Native
Place of birth - Foreign born (%) - Multirace
Place of birth - Foreign born (%) - Other Race
Residents speaking English at home (%)
Residents speaking English at home - Born in the United States (%)
Residents speaking English at home - Native, born elsewhere (%)
Residents speaking English at home - Foreign born (%)
Residents speaking Spanish at home (%)
Residents speaking Spanish at home - Born in the United States (%)
Residents speaking Spanish at home - Native, born elsewhere (%)
Residents speaking Spanish at home - Foreign born (%)
Residents speaking other language at home (%)
Residents speaking other language at home - Born in the United States (%)
Residents speaking other language at home - Native, born elsewhere (%)
Residents speaking other language at home - Foreign born (%)
Marital status - Never married (%)
Marital status - Now married (%)
Marital status - Separated (%)
Marital status - Widowed (%)
Marital status - Divorced (%)
Ancestries Reported - Arab (%)
Ancestries Reported - Czech (%)
Ancestries Reported - Danish (%)
Ancestries Reported - Dutch (%)
Ancestries Reported - English (%)
Ancestries Reported - French (%)
Ancestries Reported - French Canadian (%)
Ancestries Reported - German (%)
Ancestries Reported - Greek (%)
Ancestries Reported - Hungarian (%)
Ancestries Reported - Irish (%)
Ancestries Reported - Italian (%)
Ancestries Reported - Lithuanian (%)
Ancestries Reported - Norwegian (%)
Ancestries Reported - Polish (%)
Ancestries Reported - Portuguese (%)
Ancestries Reported - Russian (%)
Ancestries Reported - Scotch-Irish (%)
Ancestries Reported - Scottish (%)
Ancestries Reported - Slovak (%)
Ancestries Reported - Subsaharan African (%)
Ancestries Reported - Swedish (%)
Ancestries Reported - Swiss (%)
Ancestries Reported - Ukrainian (%)
Ancestries Reported - United States (%)
Ancestries Reported - Welsh (%)
Ancestries Reported - West Indian (%)
Ancestries Reported - Other (%)
Geographical mobility - Same house 1 year ago (%)
Geographical mobility - Same house 1 year ago (%) - White
Geographical mobility - Same house 1 year ago (%) - Black or African American
Geographical mobility - Same house 1 year ago (%) - Asian
Geographical mobility - Same house 1 year ago (%) - Hispanic or Latino
Geographical mobility - Same house 1 year ago (%) - American Indian and Alaska Native
Geographical mobility - Same house 1 year ago (%) - Multirace
Geographical mobility - Same house 1 year ago (%) - Other Race
Geographical mobility - Moved within same county (%)
Geographical mobility - Moved within same county (%) - White
Geographical mobility - Moved within same county (%) - Black or African American
Geographical mobility - Moved within same county (%) - Asian
Geographical mobility - Moved within same county (%) - Hispanic or Latino
Geographical mobility - Moved within same county (%) - American Indian and Alaska Native
Geographical mobility - Moved within same county (%) - Multirace
Geographical mobility - Moved within same county (%) - Other Race
Geographical mobility - Moved from different county within same state (%)
Geographical mobility - Moved from different county within same state (%) - White
Geographical mobility - Moved from different county within same state (%) - Black or African American
Geographical mobility - Moved from different county within same state (%) - Asian
Geographical mobility - Moved from different county within same state (%) - Hispanic or Latino
Geographical mobility - Moved from different county within same state (%) - American Indian and Alaska Native
Geographical mobility - Moved from different county within same state (%) - Multirace
Geographical mobility - Moved from different county within same state (%) - Other Race
Geographical mobility - Moved from different state (%)
Geographical mobility - Moved from different state (%) - White
Geographical mobility - Moved from different state (%) - Black or African American
Geographical mobility - Moved from different state (%) - Asian
Geographical mobility - Moved from different state (%) - Hispanic or Latino
Geographical mobility - Moved from different state (%) - American Indian and Alaska Native
Geographical mobility - Moved from different state (%) - Multirace
Geographical mobility - Moved from different state (%) - Other Race
Geographical mobility - Moved from abroad (%)
Geographical mobility - Moved from abroad (%) - White
Geographical mobility - Moved from abroad (%) - Black or African American
Geographical mobility - Moved from abroad (%) - Asian
Geographical mobility - Moved from abroad (%) - Hispanic or Latino
Geographical mobility - Moved from abroad (%) - American Indian and Alaska Native
Geographical mobility - Moved from abroad (%) - Multirace
Geographical mobility - Moved from abroad (%) - Other Race
Place of birth for the foreign-born population - Ireland (%)
Place of birth for the foreign-born population - Denmark (%)
Place of birth for the foreign-born population - Norway (%)
Place of birth for the foreign-born population - Sweden (%)
Place of birth for the foreign-born population - United Kingdom (%)
Place of birth for the foreign-born population - England (%)
Place of birth for the foreign-born population - Scotland (%)
Place of birth for the foreign-born population - Other Northern Europe (%)
Place of birth for the foreign-born population - Austria (%)
Place of birth for the foreign-born population - Belgium (%)
Place of birth for the foreign-born population - France (%)
Place of birth for the foreign-born population - Germany (%)
Place of birth for the foreign-born population - Netherlands (%)
Place of birth for the foreign-born population - Switzerland (%)
Place of birth for the foreign-born population - Other Western Europe (%)
Place of birth for the foreign-born population - Greece (%)
Place of birth for the foreign-born population - Italy (%)
Place of birth for the foreign-born population - Portugal (%)
Place of birth for the foreign-born population - Spain (%)
Place of birth for the foreign-born population - Other Southern Europe (%)
Place of birth for the foreign-born population - Albania (%)
Place of birth for the foreign-born population - Belarus (%)
Place of birth for the foreign-born population - Bosnia and Herzegovina (%)
Place of birth for the foreign-born population - Bulgaria (%)
Place of birth for the foreign-born population - Croatia (%)
Place of birth for the foreign-born population - Czechoslovakia (%)
Place of birth for the foreign-born population - Hungary (%)
Place of birth for the foreign-born population - Latvia (%)
Place of birth for the foreign-born population - Lithuania (%)
Place of birth for the foreign-born population - North Macedonia (Macedonia) (%)
Place of birth for the foreign-born population - Moldova (%)
Place of birth for the foreign-born population - Poland (%)
Place of birth for the foreign-born population - Romania (%)
Place of birth for the foreign-born population - Russia (%)
Place of birth for the foreign-born population - Serbia (%)
Place of birth for the foreign-born population - Ukraine (%)
Place of birth for the foreign-born population - Other Eastern Europe (%)
Place of birth for the foreign-born population - China (%)
Place of birth for the foreign-born population - Hong Kong (%)
Place of birth for the foreign-born population - Taiwan (%)
Place of birth for the foreign-born population - Japan (%)
Place of birth for the foreign-born population - Korea (%)
Place of birth for the foreign-born population - Other Eastern Asia (%)
Place of birth for the foreign-born population - Afghanistan (%)
Place of birth for the foreign-born population - Bangladesh (%)
Place of birth for the foreign-born population - India (%)
Place of birth for the foreign-born population - Iran (%)
Place of birth for the foreign-born population - Kazakhstan (%)
Place of birth for the foreign-born population - Nepal (%)
Place of birth for the foreign-born population - Pakistan (%)
Place of birth for the foreign-born population - Sri Lanka (%)
Place of birth for the foreign-born population - Uzbekistan (%)
Place of birth for the foreign-born population - Other South Central Asia (%)
Place of birth for the foreign-born population - Burma (%)
Place of birth for the foreign-born population - Cambodia (%)
Place of birth for the foreign-born population - Indonesia (%)
Place of birth for the foreign-born population - Laos (%)
Place of birth for the foreign-born population - Malaysia (%)
Place of birth for the foreign-born population - Philippines (%)
Place of birth for the foreign-born population - Singapore (%)
Place of birth for the foreign-born population - Thailand (%)
Place of birth for the foreign-born population - Vietnam (%)
Place of birth for the foreign-born population - Other South Eastern Asia (%)
Place of birth for the foreign-born population - Armenia (%)
Place of birth for the foreign-born population - Iraq (%)
Place of birth for the foreign-born population - Israel (%)
Place of birth for the foreign-born population - Jordan (%)
Place of birth for the foreign-born population - Kuwait (%)
Place of birth for the foreign-born population - Lebanon (%)
Place of birth for the foreign-born population - Saudi Arabia (%)
Place of birth for the foreign-born population - Syria (%)
Place of birth for the foreign-born population - Turkey (%)
Place of birth for the foreign-born population - Yemen (%)
Place of birth for the foreign-born population - Other Western Asia (%)
Place of birth for the foreign-born population - Eritrea (%)
Place of birth for the foreign-born population - Ethiopia (%)
Place of birth for the foreign-born population - Kenya (%)
Place of birth for the foreign-born population - Somalia (%)
Place of birth for the foreign-born population - Uganda (%)
Place of birth for the foreign-born population - Zimbabwe (%)
Place of birth for the foreign-born population - Other Eastern Africa (%)
Place of birth for the foreign-born population - Cameroon (%)
Place of birth for the foreign-born population - Congo (%)
Place of birth for the foreign-born population - Democratic Republic of Congo (Zaire) (%)
Place of birth for the foreign-born population - Other Middle Africa (%)
Place of birth for the foreign-born population - Egypt (%)
Place of birth for the foreign-born population - Morocco (%)
Place of birth for the foreign-born population - Sudan (%)
Place of birth for the foreign-born population - Other Northern Africa (%)
Place of birth for the foreign-born population - South Africa (%)
Place of birth for the foreign-born population - Other Southern Africa (%)
Place of birth for the foreign-born population - Cabo Verde (%)
Place of birth for the foreign-born population - Ghana (%)
Place of birth for the foreign-born population - Liberia (%)
Place of birth for the foreign-born population - Nigeria (%)
Place of birth for the foreign-born population - Senegal (%)
Place of birth for the foreign-born population - Sierra Leone (%)
Place of birth for the foreign-born population - Other Western Africa (%)
Place of birth for the foreign-born population - Australia (%)
Place of birth for the foreign-born population - New Zealand (%)
Place of birth for the foreign-born population - Fiji (%)
Place of birth for the foreign-born population - Micronesia (%)
Place of birth for the foreign-born population - Bahamas (%)
Place of birth for the foreign-born population - Barbados (%)
Place of birth for the foreign-born population - Cuba (%)
Place of birth for the foreign-born population - Dominica (%)
Place of birth for the foreign-born population - Dominican Republic (%)
Place of birth for the foreign-born population - Grenada (%)
Place of birth for the foreign-born population - Haiti (%)
Place of birth for the foreign-born population - Jamaica (%)
Place of birth for the foreign-born population - St. Vincent and the Grenadines (%)
Place of birth for the foreign-born population - Trinidad and Tobago (%)
Place of birth for the foreign-born population - West Indies (%)
Place of birth for the foreign-born population - Other Caribbean (%)
Place of birth for the foreign-born population - Belize (%)
Place of birth for the foreign-born population - Costa Rica (%)
Place of birth for the foreign-born population - El Salvador (%)
Place of birth for the foreign-born population - Guatemala (%)
Place of birth for the foreign-born population - Honduras (%)
Place of birth for the foreign-born population - Mexico (%)
Place of birth for the foreign-born population - Nicaragua (%)
Place of birth for the foreign-born population - Panama (%)
Place of birth for the foreign-born population - Other Central America (%)
Place of birth for the foreign-born population - Argentina (%)
Place of birth for the foreign-born population - Bolivia (%)
Place of birth for the foreign-born population - Brazil (%)
Place of birth for the foreign-born population - Chile (%)
Place of birth for the foreign-born population - Colombia (%)
Place of birth for the foreign-born population - Ecuador (%)
Place of birth for the foreign-born population - Guyana (%)
Place of birth for the foreign-born population - Peru (%)
Place of birth for the foreign-born population - Uruguay (%)
Place of birth for the foreign-born population - Venezuela (%)
Place of birth for the foreign-born population - Other South America (%)
Place of birth for the foreign-born population - Canada (%)
Place of birth for the foreign-born population - Other Northern America (%)
Place of birth for the foreign-born population - Other (%)
Latest news about races in Trumbull, CT collected exclusively by city-data.com from local newspapers, TV, and radio stations
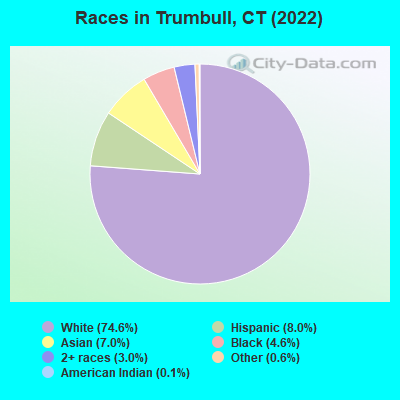
According to 2022 data, the most numerous races in Trumbull, CT are White alone (27,027 residents), Hispanic (2,898 residents), and Black alone (1,665 residents). 80.6% of Trumbull residents speak English at home. 14.3% of Trumbull, CT residents are foreign-born (5.3% born in Asia, 4.4% born in Europe, 3.6% born in Latin America), which is 4.6% less than the foreign-born rate of 15.0% across the entire state of Connecticut.
Race distribution in Trumbull
2000 2022
2,638,845 77.5% White alone 320,323 9.4% Hispanic 295,571 8.7% Black alone 81,564 2.4% Asian alone 52,896 1.6% Two or more races 8,141 0.2% Other race alone 7,267 0.2% American Indian alone 958 0.03% Native Hawaiian and Other
2,246,913 62.0% White alone 658,978 18.2% Hispanic 353,973 9.8% Black alone 172,929 4.8% Asian alone 159,631 4.4% Two or more races 29,761 0.8% Other race alone 3,428 0.09% American Indian alone 592 0.02% Native Hawaiian and Other
Income and house value in Trumbull Median household income in 2022 $142,485 White non-Hispanic householders$149,449 Black householders$165,126 Asian householders$155,386 Some other race householders$89,005 Two or more races householders$157,261 Hispanic or Latino race householdersMedian 2022 house value $562,308 White Non-Hispanic householders$508,261 Black or African American householders $701,318 Asian householders$513,449 Some other race householders$527,718 Two or more races householders$682,725 Hispanic or Latino householders
Median age by race in Trumbull
46.3 Median age for White residents44.3 48.6 39.8 Median age for Black or African American residents39.5 41.4 33.1 Median age for American Indian / Alaska Native residents34.4 Median age for Asian residents38.8 31.4 44.2 Median age for Other race residents37.2 44.5 13.1 Median age for Two or more races residents11.1 16.4 47.4 Median age for White alone residents45.1 49.3 28.1 Median age for Hispanic or Latino residents25.6 29.4
Owner/renter occupied households by race in Trumbull
House owners and renters - White residents 9,235 88.1% Owner occupied1,250 11.9% Renter occupiedHouse owners and renters - Black or African American residents 308 57.7% Owner occupied226 42.3% Renter occupiedHouse owners and renters - American Indian / Alaska Native residents 9 33.4% Owner occupied17 66.6% Renter occupiedHouse owners and renters - Asian residents 514 84.3% Owner occupied96 15.7% Renter occupiedHouse owners and renters - Other race residents 127 87.3% Owner occupied18 12.7% Renter occupiedHouse owners and renters - Two or more races residents 191 82.7% Owner occupied40 17.3% Renter occupiedHouse owners and renters - White alone residents 9,018 87.8% Owner occupied1,250 12.2% Renter occupiedHouse owners and renters - Hispanic or Latino residents 560 79.6% Owner occupied144 20.4% Renter occupied
Language usage in Trumbull
English speakers - Total 80.6% of residents of Trumbull speak English at home.
4.2% of residents speak Spanish at home 1,091 75.9% Speak English very well347 24.1% Speak English less than very well15.1% of residents speak other language at home 3,714 71.4% Speak English very well1,491 28.6% Speak English less than very well
English speakers - Born in the United States 92.6% of residents of Trumbull speak English at home.
3.1% of residents speak Spanish at home 260 92.2% Speak English very well22 7.8% Speak English less than very well3.9% of residents speak other language at home 353 98.1% Speak English very well7 1.9% Speak English less than very well
English speakers - Native, born elsewhere 56.7% of residents of Trumbull speak English at home.
39.3% of residents speak Spanish at home 138 65.1% Speak English very well74 34.9% Speak English less than very well9.8% of residents speak other language at home 53 100.0% Speak English very well
English speakers - Foreign-born 24.0% of residents of Trumbull speak English at home.
8.4% of residents speak Spanish at home 286 64.6% Speak English very well157 35.4% Speak English less than very well66.3% of residents speak other language at home 2,179 62.2% Speak English very well1,324 37.8% Speak English less than very well
White (Caucasian) - Speak only English Native:
94.5% (22,731)Foreign-born:
25.1% (625)
White (Caucasian) - Speak another language Native:
5.9% (1,422)Foreign-born:
74.5% (1,859)
Black or African American - Speak only English Native:
99.4% (1,412)Foreign-born:
71.5% (185)
Black or African American - Speak another language Native:
2.0% (29)Foreign-born:
27.2% (70)
American Indian / Alaska Native - Speak only English Native:
96.6% (42)Foreign-born:
87.5% (37)
Asian - Speak only English Native:
70.3% (430)Foreign-born:
22.7% (390)
Asian - Speak another language Native:
32.3% (198)Foreign-born:
77.4% (1,327)
Other race - Speak only English Native:
27.2% (167)Foreign-born:
39.4% (87)
Other race - Speak another language Native:
71.3% (437)Foreign-born:
53.1% (117)
Two or more races - Speak another language Native:
21.0% (270)Foreign-born:
100.0% (211)
White alone - Speak only English Native:
93.8% (21,950)Foreign-born:
20.5% (538)
White alone - Speak another language Native:
6.1% (1,416)Foreign-born:
79.7% (2,091)
Hispanic or Latino - Speak only English Native:
70.0% (1,395)Foreign-born:
22.8% (136)
Hispanic or Latino - Speak another language Native:
37.0% (737)Foreign-born:
80.2% (476)
Foreign-born residents in Trumbull 5,208 residents are foreign born (5.3% Asia , 4.4% Europe , 3.6% Latin America ).
This city:
14.3%Connecticut:
100.0%
Marital status for residents in Trumbull Marital status - White (Caucasian) population 15 years and over
Males 29.9% Never married62.8% Now married0.0% Separated2.7% Widowed4.5% DivorcedFemales 21.2% Never married59.8% Now married1.0% Separated10.9% Widowed7.1% DivorcedWomen who gave birth in the past 12 months Now married:
96.1% (169)Unmarried:
3.9% (7)
Women who did not give birth in the past 12 months Now married:
55.4% (2,863)Unmarried:
44.6% (2,308)
Marital status - Black or African American population 15 years and over
Males 27.9% Never married56.2% Now married1.9% Separated4.7% Widowed9.3% DivorcedFemales 20.0% Never married60.8% Now married6.7% Separated6.9% Widowed5.6% DivorcedWomen who gave birth in the past 12 months Now married:
58.7% (39)Unmarried:
41.3% (27)
Women who did not give birth in the past 12 months Now married:
67.3% (118)Unmarried:
32.7% (58)
Marital status - American Indian / Alaska Native population 15 years and over
Males 0.0% Never married100.0% Now married0.0% Separated0.0% Widowed0.0% DivorcedFemales 0.0% Never married100.0% Now married0.0% Separated0.0% Widowed0.0% DivorcedWomen who gave birth in the past 12 months Now married:
100.0% (20)Unmarried:
0.0% (0)
Women who did not give birth in the past 12 months Now married:
100.0% (20)Unmarried:
0.0% (0)
Marital status - Asian population 15 years and over
Males 22.7% Never married72.4% Now married0.0% Separated0.0% Widowed4.9% DivorcedFemales 25.9% Never married68.5% Now married0.0% Separated3.4% Widowed2.2% DivorcedWomen who gave birth in the past 12 months Now married:
53.4% (47)Unmarried:
46.6% (41)
Women who did not give birth in the past 12 months Now married:
67.9% (437)Unmarried:
32.1% (207)
Marital status - Other race population 15 years and over
Males 41.1% Never married58.9% Now married0.0% Separated0.0% Widowed0.0% DivorcedFemales 43.8% Never married23.4% Now married0.0% Separated11.7% Widowed21.1% DivorcedWomen who did not give birth in the past 12 months Now married:
24.1% (71)Unmarried:
75.9% (224)
Marital status - Two or more races population 15 years and over
Males 50.0% Never married50.0% Now married0.0% Separated0.0% Widowed0.0% DivorcedFemales 54.7% Never married28.7% Now married0.0% Separated14.4% Widowed2.2% DivorcedWomen who did not give birth in the past 12 months Now married:
37.4% (125)Unmarried:
62.6% (210)
Marital status - White alone, not Hispanic / Latino population 15 years and over
Males 30.1% Never married62.7% Now married0.0% Separated2.6% Widowed4.6% DivorcedFemales 21.0% Never married59.9% Now married1.0% Separated11.2% Widowed6.9% DivorcedWomen who gave birth in the past 12 months Now married:
95.3% (150)Unmarried:
4.7% (7)
Women who did not give birth in the past 12 months Now married:
54.9% (2,823)Unmarried:
45.1% (2,319)
Marital status - Hispanic or Latino population 15 years and over
Males 30.0% Never married65.2% Now married0.0% Separated3.2% Widowed1.6% DivorcedFemales 33.4% Never married46.5% Now married0.0% Separated4.8% Widowed15.2% DivorcedWomen who gave birth in the past 12 months Now married:
100.0% (34)Unmarried:
0.0% (0)
Women who did not give birth in the past 12 months Now married:
48.9% (305)Unmarried:
51.1% (319)
Ancestries in Trumbull
3,772 22.2% Italian1,427 8.4% Irish676 4.0% Polish675 4.0% American626 3.7% English531 3.1% Portuguese506 3.0% Brazilian427 2.5% German308 1.8% Greek286 1.7% Slovak254 1.5% European245 1.4% Hungarian218 1.3% Eastern European210 1.2% Syrian154 0.9% Ukrainian136 0.8% Albanian135 0.8% Russian128 0.8% Jamaican112 0.7% African104 0.6% Romanian100 0.6% South African99 0.6% Scottish89 0.5% Swedish77 0.5% British75 0.4% Haitian69 0.4% French Canadian68 0.4% Egyptian67 0.4% Austrian67 0.4% Turkish55 0.3% Lithuanian54 0.3% Canadian48 0.3% Iranian48 0.3% French39 0.2% Carpatho Rusyn39 0.2% Czechoslovakian32 0.2% Scotch-Irish26 0.2% Macedonian25 0.1% Dutch24 0.1% Scandinavian22 0.1% Yugoslavian18 0.1% Norwegian17 0.1% Northern European15 0.09% Welsh15 0.09% Slovene14 0.08% Croatian14 0.08% Czech14 0.08% Trinidadian and Tobagonian13 0.08% Armenian13 0.08% Danish11 0.06% Israeli10 0.06% Cape Verdean4 0.02% West Indian
Geographical mobility in Trumbull Same house 1 year ago 25,463 92.2% White (Caucasian)1,324 76.9% Black or African American58 89.8% American Indian / Alaska Native2,082 86.1% Asian31 100.0% Native Hawaiian / Pacific Islander773 91.2% Other race1,784 90.3% Two or more races25,562 93.1% White alone, not Hispanic / Latino2,287 83.7% Hispanic or LatinoMoved within same county 1,326 4.8% White / Caucasian300 17.4% Black or African American8 0.3% Asian9 1.1% Other race150 7.6% Two or more races1,258 4.6% White alone, not Hispanic / Latino146 5.3% Hispanic or LatinoMoved within same state 415 1.5% White / Caucasian6 0.3% Black or African American46 1.9% Asian187 0.7% White alone, not Hispanic / Latino265 9.7% Hispanic or LatinoMoved from different state 361 1.3% White / Caucasian13 0.7% Black or African American681 28.2% Asian78 9.2% Other race55 2.8% Two or more races368 1.3% White alone, not Hispanic / Latino98 3.6% Hispanic or LatinoMoved from abroad 11 0.0% White16 0.9% Black or African American6 0.2% Asian13 0.0% White alone, not Hispanic / Latino
Children Nativity (place of birth) in Trumbull
Children under 6 years - Living with two parents Both parents native 1,309 100.0% NativeBoth parents foreign-born 269 100.0% NativeOne native, one foreign-born parent 407 100.0% NativeChildren under 6 years - Living with one parent Native parent 118 99.7% Native0 0.3% Foreign-bornForeign-born parent 64 76.6% Native20 23.4% Foreign-bornChildren 6 to 17 years - Living with two parents Both parents native 3,358 99.8% Native8 0.2% Foreign-bornBoth parents foreign-born 994 70.0% Native427 30.0% Foreign-bornOne native, one foreign-born parent 449 100.0% NativeChildren 6 to 17 years - Living with one parent Native parent 840 100.0% NativeForeign-born parent 195 51.5% Native183 48.5% Foreign-born
Grandparents responsible for own grandchildren in Trumbull
Grandparents (30 to 59 years) White / Caucasian 130 91.5% Responsible for grandchildren12 8.5% Not responsible for grandchildrenBlack or African American 20 100.0% Responsible for grandchildrenAmerican Indian / Alaska Native 3 100.0% Not responsible for grandchildrenAsian 23 100.0% Not responsible for grandchildrenWhite alone, not Hispanic / Latino 79 92.6% Responsible for grandchildren6 7.4% Not responsible for grandchildrenHispanic or Latino 13 100.0% Not responsible for grandchildrenGrandparents (60 years and over) White / Caucasian 55 15.1% Responsible for grandchildren310 84.9% Not responsible for grandchildrenBlack or African American 64 100.0% Not responsible for grandchildrenAsian 109 100.0% Not responsible for grandchildrenWhite alone, not Hispanic / Latino 68 19.7% Responsible for grandchildren275 80.3% Not responsible for grandchildrenHispanic or Latino 31 100.0% Not responsible for grandchildren