Races in University of Virginia, Virginia (VA) Detailed Stats
Data:
Races - White alone (%)
Races - White alone (% change since 2000)
Races - Black alone (%)
Races - Black alone (% change since 2000)
Races - American Indian alone (%)
Races - American Indian alone (% change since 2000)
Races - Asian alone (%)
Races - Asian alone (% change since 2000)
Races - Hispanic (%)
Races - Hispanic (% change since 2000)
Races - Native Hawaiian and Other Pacific Islander alone (%)
Races - Native Hawaiian and Other Pacific Islander alone (% change since 2000)
Races - Two or more races(%)
Races - Two or more races(% change since 2000)
Races - Other race alone (%)
Races - Other race alone (% change since 2000)
Racial diversity
Place of birth - Born in state of residence (%)
Place of birth - Born in state of residence (%) - White
Place of birth - Born in state of residence (%) - Black or African American
Place of birth - Born in state of residence (%) - Asian
Place of birth - Born in state of residence (%) - Hispanic or Latino
Place of birth - Born in state of residence (%) - American Indian and Alaska Native
Place of birth - Born in state of residence (%) - Multirace
Place of birth - Born in state of residence (%) - Other Race
Place of birth - Born in other state (%)
Place of birth - Born in other state (%) - White
Place of birth - Born in other state (%) - Black or African American
Place of birth - Born in other state (%) - Asian
Place of birth - Born in other state (%) - Hispanic or Latino
Place of birth - Born in other state (%) - American Indian and Alaska Native
Place of birth - Born in other state (%) - Multirace
Place of birth - Born in other state (%) - Other Race
Place of birth - Native, outside of US (%)
Place of birth - Native, outside of US (%) - White
Place of birth - Native, outside of US (%) - Black or African American
Place of birth - Native, outside of US (%) - Asian
Place of birth - Native, outside of US (%) - Hispanic or Latino
Place of birth - Native, outside of US (%) - American Indian and Alaska Native
Place of birth - Native, outside of US (%) - Multirace
Place of birth - Native, outside of US (%) - Other Race
Place of birth - Foreign born (%)
Place of birth - Foreign born (%) - White
Place of birth - Foreign born (%) - Black or African American
Place of birth - Foreign born (%) - Asian
Place of birth - Foreign born (%) - Hispanic or Latino
Place of birth - Foreign born (%) - American Indian and Alaska Native
Place of birth - Foreign born (%) - Multirace
Place of birth - Foreign born (%) - Other Race
Residents speaking English at home (%)
Residents speaking English at home - Born in the United States (%)
Residents speaking English at home - Native, born elsewhere (%)
Residents speaking English at home - Foreign born (%)
Residents speaking Spanish at home (%)
Residents speaking Spanish at home - Born in the United States (%)
Residents speaking Spanish at home - Native, born elsewhere (%)
Residents speaking Spanish at home - Foreign born (%)
Residents speaking other language at home (%)
Residents speaking other language at home - Born in the United States (%)
Residents speaking other language at home - Native, born elsewhere (%)
Residents speaking other language at home - Foreign born (%)
Marital status - Never married (%)
Marital status - Now married (%)
Marital status - Separated (%)
Marital status - Widowed (%)
Marital status - Divorced (%)
Ancestries Reported - Arab (%)
Ancestries Reported - Czech (%)
Ancestries Reported - Danish (%)
Ancestries Reported - Dutch (%)
Ancestries Reported - English (%)
Ancestries Reported - French (%)
Ancestries Reported - French Canadian (%)
Ancestries Reported - German (%)
Ancestries Reported - Greek (%)
Ancestries Reported - Hungarian (%)
Ancestries Reported - Irish (%)
Ancestries Reported - Italian (%)
Ancestries Reported - Lithuanian (%)
Ancestries Reported - Norwegian (%)
Ancestries Reported - Polish (%)
Ancestries Reported - Portuguese (%)
Ancestries Reported - Russian (%)
Ancestries Reported - Scotch-Irish (%)
Ancestries Reported - Scottish (%)
Ancestries Reported - Slovak (%)
Ancestries Reported - Subsaharan African (%)
Ancestries Reported - Swedish (%)
Ancestries Reported - Swiss (%)
Ancestries Reported - Ukrainian (%)
Ancestries Reported - United States (%)
Ancestries Reported - Welsh (%)
Ancestries Reported - West Indian (%)
Ancestries Reported - Other (%)
Geographical mobility - Same house 1 year ago (%)
Geographical mobility - Same house 1 year ago (%) - White
Geographical mobility - Same house 1 year ago (%) - Black or African American
Geographical mobility - Same house 1 year ago (%) - Asian
Geographical mobility - Same house 1 year ago (%) - Hispanic or Latino
Geographical mobility - Same house 1 year ago (%) - American Indian and Alaska Native
Geographical mobility - Same house 1 year ago (%) - Multirace
Geographical mobility - Same house 1 year ago (%) - Other Race
Geographical mobility - Moved within same county (%)
Geographical mobility - Moved within same county (%) - White
Geographical mobility - Moved within same county (%) - Black or African American
Geographical mobility - Moved within same county (%) - Asian
Geographical mobility - Moved within same county (%) - Hispanic or Latino
Geographical mobility - Moved within same county (%) - American Indian and Alaska Native
Geographical mobility - Moved within same county (%) - Multirace
Geographical mobility - Moved within same county (%) - Other Race
Geographical mobility - Moved from different county within same state (%)
Geographical mobility - Moved from different county within same state (%) - White
Geographical mobility - Moved from different county within same state (%) - Black or African American
Geographical mobility - Moved from different county within same state (%) - Asian
Geographical mobility - Moved from different county within same state (%) - Hispanic or Latino
Geographical mobility - Moved from different county within same state (%) - American Indian and Alaska Native
Geographical mobility - Moved from different county within same state (%) - Multirace
Geographical mobility - Moved from different county within same state (%) - Other Race
Geographical mobility - Moved from different state (%)
Geographical mobility - Moved from different state (%) - White
Geographical mobility - Moved from different state (%) - Black or African American
Geographical mobility - Moved from different state (%) - Asian
Geographical mobility - Moved from different state (%) - Hispanic or Latino
Geographical mobility - Moved from different state (%) - American Indian and Alaska Native
Geographical mobility - Moved from different state (%) - Multirace
Geographical mobility - Moved from different state (%) - Other Race
Geographical mobility - Moved from abroad (%)
Geographical mobility - Moved from abroad (%) - White
Geographical mobility - Moved from abroad (%) - Black or African American
Geographical mobility - Moved from abroad (%) - Asian
Geographical mobility - Moved from abroad (%) - Hispanic or Latino
Geographical mobility - Moved from abroad (%) - American Indian and Alaska Native
Geographical mobility - Moved from abroad (%) - Multirace
Geographical mobility - Moved from abroad (%) - Other Race
Place of birth for the foreign-born population - Ireland (%)
Place of birth for the foreign-born population - Denmark (%)
Place of birth for the foreign-born population - Norway (%)
Place of birth for the foreign-born population - Sweden (%)
Place of birth for the foreign-born population - United Kingdom (%)
Place of birth for the foreign-born population - England (%)
Place of birth for the foreign-born population - Scotland (%)
Place of birth for the foreign-born population - Other Northern Europe (%)
Place of birth for the foreign-born population - Austria (%)
Place of birth for the foreign-born population - Belgium (%)
Place of birth for the foreign-born population - France (%)
Place of birth for the foreign-born population - Germany (%)
Place of birth for the foreign-born population - Netherlands (%)
Place of birth for the foreign-born population - Switzerland (%)
Place of birth for the foreign-born population - Other Western Europe (%)
Place of birth for the foreign-born population - Greece (%)
Place of birth for the foreign-born population - Italy (%)
Place of birth for the foreign-born population - Portugal (%)
Place of birth for the foreign-born population - Spain (%)
Place of birth for the foreign-born population - Other Southern Europe (%)
Place of birth for the foreign-born population - Albania (%)
Place of birth for the foreign-born population - Belarus (%)
Place of birth for the foreign-born population - Bosnia and Herzegovina (%)
Place of birth for the foreign-born population - Bulgaria (%)
Place of birth for the foreign-born population - Croatia (%)
Place of birth for the foreign-born population - Czechoslovakia (%)
Place of birth for the foreign-born population - Hungary (%)
Place of birth for the foreign-born population - Latvia (%)
Place of birth for the foreign-born population - Lithuania (%)
Place of birth for the foreign-born population - North Macedonia (Macedonia) (%)
Place of birth for the foreign-born population - Moldova (%)
Place of birth for the foreign-born population - Poland (%)
Place of birth for the foreign-born population - Romania (%)
Place of birth for the foreign-born population - Russia (%)
Place of birth for the foreign-born population - Serbia (%)
Place of birth for the foreign-born population - Ukraine (%)
Place of birth for the foreign-born population - Other Eastern Europe (%)
Place of birth for the foreign-born population - China (%)
Place of birth for the foreign-born population - Hong Kong (%)
Place of birth for the foreign-born population - Taiwan (%)
Place of birth for the foreign-born population - Japan (%)
Place of birth for the foreign-born population - Korea (%)
Place of birth for the foreign-born population - Other Eastern Asia (%)
Place of birth for the foreign-born population - Afghanistan (%)
Place of birth for the foreign-born population - Bangladesh (%)
Place of birth for the foreign-born population - India (%)
Place of birth for the foreign-born population - Iran (%)
Place of birth for the foreign-born population - Kazakhstan (%)
Place of birth for the foreign-born population - Nepal (%)
Place of birth for the foreign-born population - Pakistan (%)
Place of birth for the foreign-born population - Sri Lanka (%)
Place of birth for the foreign-born population - Uzbekistan (%)
Place of birth for the foreign-born population - Other South Central Asia (%)
Place of birth for the foreign-born population - Burma (%)
Place of birth for the foreign-born population - Cambodia (%)
Place of birth for the foreign-born population - Indonesia (%)
Place of birth for the foreign-born population - Laos (%)
Place of birth for the foreign-born population - Malaysia (%)
Place of birth for the foreign-born population - Philippines (%)
Place of birth for the foreign-born population - Singapore (%)
Place of birth for the foreign-born population - Thailand (%)
Place of birth for the foreign-born population - Vietnam (%)
Place of birth for the foreign-born population - Other South Eastern Asia (%)
Place of birth for the foreign-born population - Armenia (%)
Place of birth for the foreign-born population - Iraq (%)
Place of birth for the foreign-born population - Israel (%)
Place of birth for the foreign-born population - Jordan (%)
Place of birth for the foreign-born population - Kuwait (%)
Place of birth for the foreign-born population - Lebanon (%)
Place of birth for the foreign-born population - Saudi Arabia (%)
Place of birth for the foreign-born population - Syria (%)
Place of birth for the foreign-born population - Turkey (%)
Place of birth for the foreign-born population - Yemen (%)
Place of birth for the foreign-born population - Other Western Asia (%)
Place of birth for the foreign-born population - Eritrea (%)
Place of birth for the foreign-born population - Ethiopia (%)
Place of birth for the foreign-born population - Kenya (%)
Place of birth for the foreign-born population - Somalia (%)
Place of birth for the foreign-born population - Uganda (%)
Place of birth for the foreign-born population - Zimbabwe (%)
Place of birth for the foreign-born population - Other Eastern Africa (%)
Place of birth for the foreign-born population - Cameroon (%)
Place of birth for the foreign-born population - Congo (%)
Place of birth for the foreign-born population - Democratic Republic of Congo (Zaire) (%)
Place of birth for the foreign-born population - Other Middle Africa (%)
Place of birth for the foreign-born population - Egypt (%)
Place of birth for the foreign-born population - Morocco (%)
Place of birth for the foreign-born population - Sudan (%)
Place of birth for the foreign-born population - Other Northern Africa (%)
Place of birth for the foreign-born population - South Africa (%)
Place of birth for the foreign-born population - Other Southern Africa (%)
Place of birth for the foreign-born population - Cabo Verde (%)
Place of birth for the foreign-born population - Ghana (%)
Place of birth for the foreign-born population - Liberia (%)
Place of birth for the foreign-born population - Nigeria (%)
Place of birth for the foreign-born population - Senegal (%)
Place of birth for the foreign-born population - Sierra Leone (%)
Place of birth for the foreign-born population - Other Western Africa (%)
Place of birth for the foreign-born population - Australia (%)
Place of birth for the foreign-born population - New Zealand (%)
Place of birth for the foreign-born population - Fiji (%)
Place of birth for the foreign-born population - Micronesia (%)
Place of birth for the foreign-born population - Bahamas (%)
Place of birth for the foreign-born population - Barbados (%)
Place of birth for the foreign-born population - Cuba (%)
Place of birth for the foreign-born population - Dominica (%)
Place of birth for the foreign-born population - Dominican Republic (%)
Place of birth for the foreign-born population - Grenada (%)
Place of birth for the foreign-born population - Haiti (%)
Place of birth for the foreign-born population - Jamaica (%)
Place of birth for the foreign-born population - St. Vincent and the Grenadines (%)
Place of birth for the foreign-born population - Trinidad and Tobago (%)
Place of birth for the foreign-born population - West Indies (%)
Place of birth for the foreign-born population - Other Caribbean (%)
Place of birth for the foreign-born population - Belize (%)
Place of birth for the foreign-born population - Costa Rica (%)
Place of birth for the foreign-born population - El Salvador (%)
Place of birth for the foreign-born population - Guatemala (%)
Place of birth for the foreign-born population - Honduras (%)
Place of birth for the foreign-born population - Mexico (%)
Place of birth for the foreign-born population - Nicaragua (%)
Place of birth for the foreign-born population - Panama (%)
Place of birth for the foreign-born population - Other Central America (%)
Place of birth for the foreign-born population - Argentina (%)
Place of birth for the foreign-born population - Bolivia (%)
Place of birth for the foreign-born population - Brazil (%)
Place of birth for the foreign-born population - Chile (%)
Place of birth for the foreign-born population - Colombia (%)
Place of birth for the foreign-born population - Ecuador (%)
Place of birth for the foreign-born population - Guyana (%)
Place of birth for the foreign-born population - Peru (%)
Place of birth for the foreign-born population - Uruguay (%)
Place of birth for the foreign-born population - Venezuela (%)
Place of birth for the foreign-born population - Other South America (%)
Place of birth for the foreign-born population - Canada (%)
Place of birth for the foreign-born population - Other Northern America (%)
Place of birth for the foreign-born population - Other (%)
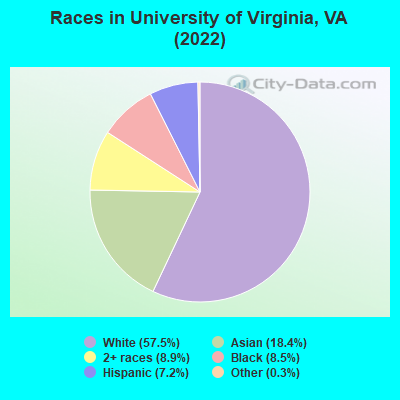
According to 2022 data, the most numerous races in University of Virginia, VA are White alone (5,651 residents), Black alone (831 residents), and Hispanic (705 residents). 72.5% of University of Virginia residents speak English at home.
Race distribution in University of Virginia 5,651 57.5% White alone 1,807 18.4% Asian alone 876 8.9% Two or more races 831 8.5% Black alone 705 7.2% Hispanic 29 0.3% Other race alone 3 0.03% American Indian alone
2000 2022
4,965,637 70.2% White alone 1,376,378 19.4% Black alone 329,540 4.7% Hispanic 259,277 3.7% Asian alone 114,022 1.6% Two or more races 18,596 0.3% American Indian alone 11,685 0.2% Other race alone 3,380 0.05% Native Hawaiian and Other
5,095,130 58.7% White alone 1,594,785 18.4% Black alone 905,750 10.4% Hispanic 602,881 6.9% Asian alone 406,047 4.7% Two or more races 60,419 0.7% Other race alone 11,738 0.1% American Indian alone 6,869 0.08% Native Hawaiian and Other
Income and house value in University of Virginia Median household income in 2022 $39,539 White non-Hispanic householders$71,825 Black householders$40,579 Asian householders$28,518 Some other race householders$29,590 Hispanic or Latino race householders
Median age by race in University of Virginia
20.0 Median age for White residents19.9 20.1 17.5 Median age for Black or African American residents14.7 17.9 -576,576,576.0 Median age for American Indian / Alaska Native residents-682,352,940.5 -687,861,271.0 18.2 Median age for Asian residents18.5 17.9 -666,666,666.0 Median age for Native Hawaiian / Pacific Islander residents-666,666,666.0 -666,666,666.0 36.9 Median age for Other race residents36.7 30.4 27.2 Median age for Two or more races residents25.2 28.7 19.9 Median age for White alone residents19.6 20.0 19.8 Median age for Hispanic or Latino residents18.8 21.3
Owner/renter occupied households by race in University of Virginia
House owners and renters - White residents 185 19.3% Owner occupied773 80.7% Renter occupiedHouse owners and renters - Black or African American residents 25 24.0% Owner occupied81 76.0% Renter occupiedHouse owners and renters - American Indian / Alaska Native residents 3 100.0% Renter occupiedHouse owners and renters - Asian residents 142 100.0% Renter occupiedHouse owners and renters - Other race residents 103 100.0% Renter occupiedHouse owners and renters - Two or more races residents 143 100.0% Renter occupiedHouse owners and renters - White alone residents 188 20.3% Owner occupied739 79.7% Renter occupiedHouse owners and renters - Hispanic or Latino residents 99 100.0% Renter occupied
Language usage in University of Virginia
English speakers - Total 72.5% of residents of University of Virginia speak English at home.
3.3% of residents speak Spanish at home 224 70.9% Speak English very well92 29.1% Speak English less than very well24.5% of residents speak other language at home 1,776 74.6% Speak English very well605 25.4% Speak English less than very well
English speakers - Born in the United States 89.6% of residents of University of Virginia speak English at home.
1.5% of residents speak Spanish at home 42 71.2% Speak English very well17 28.8% Speak English less than very well10.9% of residents speak other language at home 412 97.2% Speak English very well12 2.8% Speak English less than very well
English speakers - Native, born elsewhere 48.1% of residents of University of Virginia speak English at home.
11.6% of residents speak Spanish at home 22 100.0% Speak English very well28.6% of residents speak other language at home 54 100.0% Speak English very well
English speakers - Foreign-born 3.4% of residents of University of Virginia speak English at home.
14.5% of residents speak Spanish at home 164 64.6% Speak English very well90 35.4% Speak English less than very well95.9% of residents speak other language at home 1,031 61.3% Speak English very well650 38.7% Speak English less than very well
White (Caucasian) - Speak only English Native:
96.8% (5,344)Foreign-born:
18.0% (48)
White (Caucasian) - Speak another language Native:
2.6% (145)Foreign-born:
100.0% (265)
Black or African American - Speak only English Native:
87.1% (674)Foreign-born:
5.8% (9)
Black or African American - Speak another language Native:
13.6% (105)Foreign-born:
97.7% (144)
Asian - Speak only English Native:
41.0% (367)Foreign-born:
3.2% (30)
Asian - Speak another language Native:
56.1% (503)Foreign-born:
96.7% (912)
Other race - Speak another language Native:
19.8% (13)Foreign-born:
98.4% (59)
Two or more races - Speak another language Native:
15.0% (118)Foreign-born:
100.0% (356)
White alone - Speak only English Native:
98.0% (5,232)Foreign-born:
9.7% (26)
White alone - Speak another language Native:
1.7% (92)Foreign-born:
100.0% (270)
Hispanic or Latino - Speak only English Native:
86.7% (356)Foreign-born:
14.9% (40)
Hispanic or Latino - Speak another language Native:
20.0% (82)Foreign-born:
86.6% (233)
Foreign-born residents in University of Virginia
Marital status for residents in University of Virginia Marital status - White (Caucasian) population 15 years and over
Males 88.8% Never married8.0% Now married0.0% Separated0.6% Widowed2.6% DivorcedFemales 85.5% Never married7.2% Now married0.7% Separated3.0% Widowed3.5% DivorcedWomen who did not give birth in the past 12 months Now married:
5.0% (116)Unmarried:
95.0% (2,183)
Marital status - Black or African American population 15 years and over
Males 82.9% Never married14.9% Now married0.0% Separated0.0% Widowed2.2% DivorcedFemales 85.3% Never married14.7% Now married0.0% Separated0.0% Widowed0.0% DivorcedWomen who gave birth in the past 12 months Now married:
0.0% (0)Unmarried:
100.0% (3)
Women who did not give birth in the past 12 months Now married:
14.8% (62)Unmarried:
85.2% (359)
Marital status - Asian population 15 years and over
Males 88.4% Never married10.2% Now married0.0% Separated0.6% Widowed0.8% DivorcedFemales 89.5% Never married10.5% Now married0.0% Separated0.0% Widowed0.0% DivorcedWomen who gave birth in the past 12 months Now married:
0.0% (0)Unmarried:
100.0% (4)
Women who did not give birth in the past 12 months Now married:
8.1% (79)Unmarried:
91.9% (895)
Marital status - Other race population 15 years and over
Males 29.0% Never married43.5% Now married0.0% Separated0.0% Widowed27.5% DivorcedFemales 100.0% Never married0.0% Now married0.0% Separated0.0% Widowed0.0% DivorcedWomen who did not give birth in the past 12 months Now married:
0.0% (0)Unmarried:
100.0% (36)
Marital status - Two or more races population 15 years and over
Males 89.5% Never married10.5% Now married0.0% Separated0.0% Widowed0.0% DivorcedFemales 86.5% Never married10.4% Now married0.0% Separated0.0% Widowed3.1% DivorcedWomen who gave birth in the past 12 months Now married:
100.0% (13)Unmarried:
0.0% (0)
Women who did not give birth in the past 12 months Now married:
8.2% (30)Unmarried:
91.8% (335)
Marital status - White alone, not Hispanic / Latino population 15 years and over
Males 89.5% Never married7.6% Now married0.0% Separated0.6% Widowed2.3% DivorcedFemales 85.6% Never married6.7% Now married0.8% Separated3.2% Widowed3.8% DivorcedWomen who did not give birth in the past 12 months Now married:
4.3% (94)Unmarried:
95.7% (2,092)
Marital status - Hispanic or Latino population 15 years and over
Males 71.4% Never married16.1% Now married0.0% Separated0.0% Widowed12.5% DivorcedFemales 84.3% Never married12.7% Now married0.0% Separated0.0% Widowed3.0% DivorcedWomen who gave birth in the past 12 months Now married:
100.0% (10)Unmarried:
0.0% (0)
Women who did not give birth in the past 12 months Now married:
10.3% (31)Unmarried:
89.7% (267)
Ancestries in University of Virginia
477 9.2% English328 6.3% Irish153 3.0% Scottish151 2.9% European150 2.9% German87 1.7% Iranian85 1.6% American79 1.5% Italian74 1.4% African68 1.3% Brazilian66 1.3% Nigerian48 0.9% Eastern European45 0.9% Scotch-Irish43 0.8% Ghanaian43 0.8% Swedish41 0.8% Dutch29 0.6% Polish26 0.5% Syrian25 0.5% Norwegian23 0.4% French Canadian21 0.4% Turkish19 0.4% Palestinian18 0.3% Sudanese16 0.3% British16 0.3% Afghan16 0.3% Egyptian14 0.3% Ethiopian11 0.2% Arab11 0.2% Jamaican10 0.2% Iraqi9 0.2% French8 0.2% Moroccan8 0.2% Greek7 0.1% Kenyan4 0.08% Russian4 0.08% Basque4 0.08% Somali4 0.08% Danish4 0.08% Welsh3 0.06% Portuguese3 0.06% Latvian1 0.02% Romanian1 0.02% Israeli
Children Nativity (place of birth) in University of Virginia
Children under 6 years - Living with two parents Both parents native 18 99.0% Native0 1.0% Foreign-bornBoth parents foreign-born 22 48.3% Native24 51.7% Foreign-bornChildren under 6 years - Living with one parent Native parent 36 100.0% NativeForeign-born parent 17 100.0% NativeChildren 6 to 17 years - Living with two parents Both parents native 2 100.0% NativeBoth parents foreign-born 29 100.0% Foreign-bornChildren 6 to 17 years - Living with one parent Native parent 4 4.5% Native77 95.5% Foreign-bornForeign-born parent 81 100.0% Native
Grandparents responsible for own grandchildren in University of Virginia
Grandparents (30 to 59 years) Two or more races 20 100.0% Responsible for grandchildrenHispanic or Latino 16 100.0% Responsible for grandchildren
Grandparents (60 years and over)