Races in Webb, Texas (TX) Detailed Stats
Ancestries, Foreign-born residents, place of birth
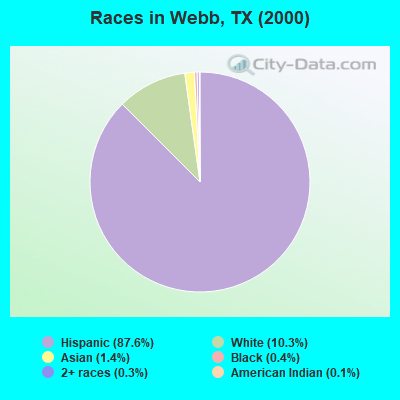
Race distribution in Webb

- 8,51887.6%Hispanic
- 99810.3%White alone
- 1331.4%Asian alone
- 380.4%Black alone
- 270.3%Two or more races
- 110.1%American Indian alone
- 10.01%Native Hawaiian and Other
Pacific Islander alone
2000
2022
-
- 10,933,31352.4%White alone
- 6,669,66632.0%Hispanic
- 2,364,25511.3%Black alone
- 554,4452.7%Asian alone
- 230,5671.1%Two or more races
- 68,8590.3%American Indian alone
- 19,9580.10%Other race alone
- 10,7570.05%Native Hawaiian and Other
Pacific Islander alone

-
- 12,070,64240.2%Hispanic
- 11,683,43038.9%White alone
- 3,508,70611.7%Black alone
- 1,608,1735.4%Asian alone
- 956,5603.2%Two or more races
- 125,7630.4%Other race alone
- 47,0230.2%American Indian alone
- 29,2750.10%Native Hawaiian and Other
Pacific Islander alone

Income and house value in Webb
- Median household income in 2022
- $112,730White non-Hispanic householders
- $62,938Black householders
- over $200,000American Indian and Alaska Native householders
- $129,462Asian householders
- $96,481Some other race householders
- $75,061Two or more races householders
- $101,563Hispanic or Latino race householders
- Median 2022 house value
- $267,531White Non-Hispanic householders
- $292,828American Indian or Alaska Native householders
- $337,545Asian householders
- $248,878Some other race householders
- $227,414Two or more races householders
- $274,942Hispanic or Latino householders
Household income for White non-Hispanic householders

Household income for Black householders

Household income for American Indian and Alaska Native householders

Household income for Asian householders

Household income for Two or more races householders

Household income for Hispanic or Latino race householders

Zip code: 78019