Races in West Bradley, Tennessee (TN) Detailed Stats
Ancestries, Foreign-born residents, place of birth
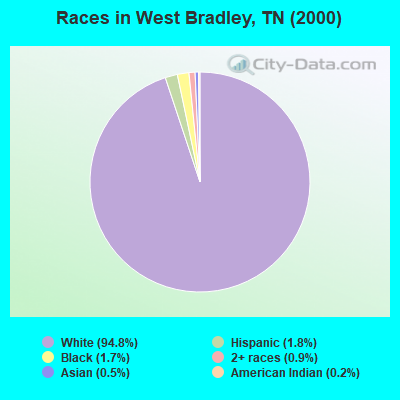
Race distribution in West Bradley

- 15,33294.8%White alone
- 2851.8%Hispanic
- 2771.7%Black alone
- 1500.9%Two or more races
- 840.5%Asian alone
- 400.2%American Indian alone
- 50.03%Other race alone
2000
2022
-
- 4,505,93079.2%White alone
- 928,20416.3%Black alone
- 123,8382.2%Hispanic
- 54,8241.0%Two or more races
- 56,0771.0%Asian alone
- 13,8200.2%American Indian alone
- 4,7800.08%Other race alone
- 1,8100.03%Native Hawaiian and Other
Pacific Islander alone

-
- 5,070,02671.9%White alone
- 1,089,73815.5%Black alone
- 442,6296.3%Hispanic
- 279,3814.0%Two or more races
- 131,8171.9%Asian alone
- 26,9720.4%Other race alone
- 6,3870.09%American Indian alone
- 4,3890.06%Native Hawaiian and Other
Pacific Islander alone

Income and house value in West Bradley
- Median household income in 2022
- $71,123White non-Hispanic householders
- $43,040Black householders
- over $200,000Asian householders
- $78,627Some other race householders
- $85,974Two or more races householders
- $114,243Hispanic or Latino race householders
- Median 2022 house value
- $307,581White Non-Hispanic householders
- $312,018Black or African American householders
- $404,376American Indian or Alaska Native householders
- $520,031Asian householders
- $83,204Some other race householders
- $271,525Two or more races householders
- $325,886Hispanic or Latino householders
Household income for White non-Hispanic householders

Household income for Black householders

Household income for American Indian and Alaska Native householders

Household income for Asian householders

Household income for Two or more races householders

Household income for Hispanic or Latino race householders

Zip code: 37312