Races in White Bear Lake, Minnesota (MN) Detailed Stats
Data:
Races - White alone (%)
Races - White alone (% change since 2000)
Races - Black alone (%)
Races - Black alone (% change since 2000)
Races - American Indian alone (%)
Races - American Indian alone (% change since 2000)
Races - Asian alone (%)
Races - Asian alone (% change since 2000)
Races - Hispanic (%)
Races - Hispanic (% change since 2000)
Races - Native Hawaiian and Other Pacific Islander alone (%)
Races - Native Hawaiian and Other Pacific Islander alone (% change since 2000)
Races - Two or more races(%)
Races - Two or more races(% change since 2000)
Races - Other race alone (%)
Races - Other race alone (% change since 2000)
Racial diversity
Place of birth - Born in state of residence (%)
Place of birth - Born in state of residence (%) - White
Place of birth - Born in state of residence (%) - Black or African American
Place of birth - Born in state of residence (%) - Asian
Place of birth - Born in state of residence (%) - Hispanic or Latino
Place of birth - Born in state of residence (%) - American Indian and Alaska Native
Place of birth - Born in state of residence (%) - Multirace
Place of birth - Born in state of residence (%) - Other Race
Place of birth - Born in other state (%)
Place of birth - Born in other state (%) - White
Place of birth - Born in other state (%) - Black or African American
Place of birth - Born in other state (%) - Asian
Place of birth - Born in other state (%) - Hispanic or Latino
Place of birth - Born in other state (%) - American Indian and Alaska Native
Place of birth - Born in other state (%) - Multirace
Place of birth - Born in other state (%) - Other Race
Place of birth - Native, outside of US (%)
Place of birth - Native, outside of US (%) - White
Place of birth - Native, outside of US (%) - Black or African American
Place of birth - Native, outside of US (%) - Asian
Place of birth - Native, outside of US (%) - Hispanic or Latino
Place of birth - Native, outside of US (%) - American Indian and Alaska Native
Place of birth - Native, outside of US (%) - Multirace
Place of birth - Native, outside of US (%) - Other Race
Place of birth - Foreign born (%)
Place of birth - Foreign born (%) - White
Place of birth - Foreign born (%) - Black or African American
Place of birth - Foreign born (%) - Asian
Place of birth - Foreign born (%) - Hispanic or Latino
Place of birth - Foreign born (%) - American Indian and Alaska Native
Place of birth - Foreign born (%) - Multirace
Place of birth - Foreign born (%) - Other Race
Residents speaking English at home (%)
Residents speaking English at home - Born in the United States (%)
Residents speaking English at home - Native, born elsewhere (%)
Residents speaking English at home - Foreign born (%)
Residents speaking Spanish at home (%)
Residents speaking Spanish at home - Born in the United States (%)
Residents speaking Spanish at home - Native, born elsewhere (%)
Residents speaking Spanish at home - Foreign born (%)
Residents speaking other language at home (%)
Residents speaking other language at home - Born in the United States (%)
Residents speaking other language at home - Native, born elsewhere (%)
Residents speaking other language at home - Foreign born (%)
Marital status - Never married (%)
Marital status - Now married (%)
Marital status - Separated (%)
Marital status - Widowed (%)
Marital status - Divorced (%)
Ancestries Reported - Arab (%)
Ancestries Reported - Czech (%)
Ancestries Reported - Danish (%)
Ancestries Reported - Dutch (%)
Ancestries Reported - English (%)
Ancestries Reported - French (%)
Ancestries Reported - French Canadian (%)
Ancestries Reported - German (%)
Ancestries Reported - Greek (%)
Ancestries Reported - Hungarian (%)
Ancestries Reported - Irish (%)
Ancestries Reported - Italian (%)
Ancestries Reported - Lithuanian (%)
Ancestries Reported - Norwegian (%)
Ancestries Reported - Polish (%)
Ancestries Reported - Portuguese (%)
Ancestries Reported - Russian (%)
Ancestries Reported - Scotch-Irish (%)
Ancestries Reported - Scottish (%)
Ancestries Reported - Slovak (%)
Ancestries Reported - Subsaharan African (%)
Ancestries Reported - Swedish (%)
Ancestries Reported - Swiss (%)
Ancestries Reported - Ukrainian (%)
Ancestries Reported - United States (%)
Ancestries Reported - Welsh (%)
Ancestries Reported - West Indian (%)
Ancestries Reported - Other (%)
Geographical mobility - Same house 1 year ago (%)
Geographical mobility - Same house 1 year ago (%) - White
Geographical mobility - Same house 1 year ago (%) - Black or African American
Geographical mobility - Same house 1 year ago (%) - Asian
Geographical mobility - Same house 1 year ago (%) - Hispanic or Latino
Geographical mobility - Same house 1 year ago (%) - American Indian and Alaska Native
Geographical mobility - Same house 1 year ago (%) - Multirace
Geographical mobility - Same house 1 year ago (%) - Other Race
Geographical mobility - Moved within same county (%)
Geographical mobility - Moved within same county (%) - White
Geographical mobility - Moved within same county (%) - Black or African American
Geographical mobility - Moved within same county (%) - Asian
Geographical mobility - Moved within same county (%) - Hispanic or Latino
Geographical mobility - Moved within same county (%) - American Indian and Alaska Native
Geographical mobility - Moved within same county (%) - Multirace
Geographical mobility - Moved within same county (%) - Other Race
Geographical mobility - Moved from different county within same state (%)
Geographical mobility - Moved from different county within same state (%) - White
Geographical mobility - Moved from different county within same state (%) - Black or African American
Geographical mobility - Moved from different county within same state (%) - Asian
Geographical mobility - Moved from different county within same state (%) - Hispanic or Latino
Geographical mobility - Moved from different county within same state (%) - American Indian and Alaska Native
Geographical mobility - Moved from different county within same state (%) - Multirace
Geographical mobility - Moved from different county within same state (%) - Other Race
Geographical mobility - Moved from different state (%)
Geographical mobility - Moved from different state (%) - White
Geographical mobility - Moved from different state (%) - Black or African American
Geographical mobility - Moved from different state (%) - Asian
Geographical mobility - Moved from different state (%) - Hispanic or Latino
Geographical mobility - Moved from different state (%) - American Indian and Alaska Native
Geographical mobility - Moved from different state (%) - Multirace
Geographical mobility - Moved from different state (%) - Other Race
Geographical mobility - Moved from abroad (%)
Geographical mobility - Moved from abroad (%) - White
Geographical mobility - Moved from abroad (%) - Black or African American
Geographical mobility - Moved from abroad (%) - Asian
Geographical mobility - Moved from abroad (%) - Hispanic or Latino
Geographical mobility - Moved from abroad (%) - American Indian and Alaska Native
Geographical mobility - Moved from abroad (%) - Multirace
Geographical mobility - Moved from abroad (%) - Other Race
Place of birth for the foreign-born population - Ireland (%)
Place of birth for the foreign-born population - Denmark (%)
Place of birth for the foreign-born population - Norway (%)
Place of birth for the foreign-born population - Sweden (%)
Place of birth for the foreign-born population - United Kingdom (%)
Place of birth for the foreign-born population - England (%)
Place of birth for the foreign-born population - Scotland (%)
Place of birth for the foreign-born population - Other Northern Europe (%)
Place of birth for the foreign-born population - Austria (%)
Place of birth for the foreign-born population - Belgium (%)
Place of birth for the foreign-born population - France (%)
Place of birth for the foreign-born population - Germany (%)
Place of birth for the foreign-born population - Netherlands (%)
Place of birth for the foreign-born population - Switzerland (%)
Place of birth for the foreign-born population - Other Western Europe (%)
Place of birth for the foreign-born population - Greece (%)
Place of birth for the foreign-born population - Italy (%)
Place of birth for the foreign-born population - Portugal (%)
Place of birth for the foreign-born population - Spain (%)
Place of birth for the foreign-born population - Other Southern Europe (%)
Place of birth for the foreign-born population - Albania (%)
Place of birth for the foreign-born population - Belarus (%)
Place of birth for the foreign-born population - Bosnia and Herzegovina (%)
Place of birth for the foreign-born population - Bulgaria (%)
Place of birth for the foreign-born population - Croatia (%)
Place of birth for the foreign-born population - Czechoslovakia (%)
Place of birth for the foreign-born population - Hungary (%)
Place of birth for the foreign-born population - Latvia (%)
Place of birth for the foreign-born population - Lithuania (%)
Place of birth for the foreign-born population - North Macedonia (Macedonia) (%)
Place of birth for the foreign-born population - Moldova (%)
Place of birth for the foreign-born population - Poland (%)
Place of birth for the foreign-born population - Romania (%)
Place of birth for the foreign-born population - Russia (%)
Place of birth for the foreign-born population - Serbia (%)
Place of birth for the foreign-born population - Ukraine (%)
Place of birth for the foreign-born population - Other Eastern Europe (%)
Place of birth for the foreign-born population - China (%)
Place of birth for the foreign-born population - Hong Kong (%)
Place of birth for the foreign-born population - Taiwan (%)
Place of birth for the foreign-born population - Japan (%)
Place of birth for the foreign-born population - Korea (%)
Place of birth for the foreign-born population - Other Eastern Asia (%)
Place of birth for the foreign-born population - Afghanistan (%)
Place of birth for the foreign-born population - Bangladesh (%)
Place of birth for the foreign-born population - India (%)
Place of birth for the foreign-born population - Iran (%)
Place of birth for the foreign-born population - Kazakhstan (%)
Place of birth for the foreign-born population - Nepal (%)
Place of birth for the foreign-born population - Pakistan (%)
Place of birth for the foreign-born population - Sri Lanka (%)
Place of birth for the foreign-born population - Uzbekistan (%)
Place of birth for the foreign-born population - Other South Central Asia (%)
Place of birth for the foreign-born population - Burma (%)
Place of birth for the foreign-born population - Cambodia (%)
Place of birth for the foreign-born population - Indonesia (%)
Place of birth for the foreign-born population - Laos (%)
Place of birth for the foreign-born population - Malaysia (%)
Place of birth for the foreign-born population - Philippines (%)
Place of birth for the foreign-born population - Singapore (%)
Place of birth for the foreign-born population - Thailand (%)
Place of birth for the foreign-born population - Vietnam (%)
Place of birth for the foreign-born population - Other South Eastern Asia (%)
Place of birth for the foreign-born population - Armenia (%)
Place of birth for the foreign-born population - Iraq (%)
Place of birth for the foreign-born population - Israel (%)
Place of birth for the foreign-born population - Jordan (%)
Place of birth for the foreign-born population - Kuwait (%)
Place of birth for the foreign-born population - Lebanon (%)
Place of birth for the foreign-born population - Saudi Arabia (%)
Place of birth for the foreign-born population - Syria (%)
Place of birth for the foreign-born population - Turkey (%)
Place of birth for the foreign-born population - Yemen (%)
Place of birth for the foreign-born population - Other Western Asia (%)
Place of birth for the foreign-born population - Eritrea (%)
Place of birth for the foreign-born population - Ethiopia (%)
Place of birth for the foreign-born population - Kenya (%)
Place of birth for the foreign-born population - Somalia (%)
Place of birth for the foreign-born population - Uganda (%)
Place of birth for the foreign-born population - Zimbabwe (%)
Place of birth for the foreign-born population - Other Eastern Africa (%)
Place of birth for the foreign-born population - Cameroon (%)
Place of birth for the foreign-born population - Congo (%)
Place of birth for the foreign-born population - Democratic Republic of Congo (Zaire) (%)
Place of birth for the foreign-born population - Other Middle Africa (%)
Place of birth for the foreign-born population - Egypt (%)
Place of birth for the foreign-born population - Morocco (%)
Place of birth for the foreign-born population - Sudan (%)
Place of birth for the foreign-born population - Other Northern Africa (%)
Place of birth for the foreign-born population - South Africa (%)
Place of birth for the foreign-born population - Other Southern Africa (%)
Place of birth for the foreign-born population - Cabo Verde (%)
Place of birth for the foreign-born population - Ghana (%)
Place of birth for the foreign-born population - Liberia (%)
Place of birth for the foreign-born population - Nigeria (%)
Place of birth for the foreign-born population - Senegal (%)
Place of birth for the foreign-born population - Sierra Leone (%)
Place of birth for the foreign-born population - Other Western Africa (%)
Place of birth for the foreign-born population - Australia (%)
Place of birth for the foreign-born population - New Zealand (%)
Place of birth for the foreign-born population - Fiji (%)
Place of birth for the foreign-born population - Micronesia (%)
Place of birth for the foreign-born population - Bahamas (%)
Place of birth for the foreign-born population - Barbados (%)
Place of birth for the foreign-born population - Cuba (%)
Place of birth for the foreign-born population - Dominica (%)
Place of birth for the foreign-born population - Dominican Republic (%)
Place of birth for the foreign-born population - Grenada (%)
Place of birth for the foreign-born population - Haiti (%)
Place of birth for the foreign-born population - Jamaica (%)
Place of birth for the foreign-born population - St. Vincent and the Grenadines (%)
Place of birth for the foreign-born population - Trinidad and Tobago (%)
Place of birth for the foreign-born population - West Indies (%)
Place of birth for the foreign-born population - Other Caribbean (%)
Place of birth for the foreign-born population - Belize (%)
Place of birth for the foreign-born population - Costa Rica (%)
Place of birth for the foreign-born population - El Salvador (%)
Place of birth for the foreign-born population - Guatemala (%)
Place of birth for the foreign-born population - Honduras (%)
Place of birth for the foreign-born population - Mexico (%)
Place of birth for the foreign-born population - Nicaragua (%)
Place of birth for the foreign-born population - Panama (%)
Place of birth for the foreign-born population - Other Central America (%)
Place of birth for the foreign-born population - Argentina (%)
Place of birth for the foreign-born population - Bolivia (%)
Place of birth for the foreign-born population - Brazil (%)
Place of birth for the foreign-born population - Chile (%)
Place of birth for the foreign-born population - Colombia (%)
Place of birth for the foreign-born population - Ecuador (%)
Place of birth for the foreign-born population - Guyana (%)
Place of birth for the foreign-born population - Peru (%)
Place of birth for the foreign-born population - Uruguay (%)
Place of birth for the foreign-born population - Venezuela (%)
Place of birth for the foreign-born population - Other South America (%)
Place of birth for the foreign-born population - Canada (%)
Place of birth for the foreign-born population - Other Northern America (%)
Place of birth for the foreign-born population - Other (%)
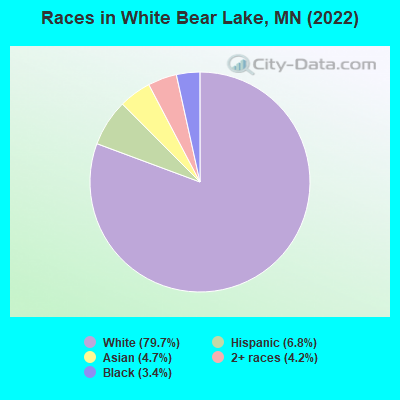
According to 2022 data, the most numerous races in White Bear Lake, MN are White alone (19,004 residents), Black alone (821 residents), and Hispanic (1,630 residents). 91.0% of White Bear Lake residents speak English at home. 8.0% of White Bear Lake, MN residents are foreign-born (2.5% born in Latin America, 1.9% born in Asia, 1.6% born in Europe, 1.5% born in Africa), which is about the same as the foreign-born rate of 8.0% across the entire state of Minnesota.
Race distribution in White Bear Lake
2000 2022
4,337,143 88.2% White alone 168,813 3.4% Black alone 143,382 2.9% Hispanic 141,083 2.9% Asian alone 70,304 1.4% Two or more races 52,009 1.1% American Indian alone 5,031 0.1% Other race alone 1,714 0.03% Native Hawaiian and Other
4,356,347 76.2% White alone 395,179 6.9% Black alone 333,830 5.8% Hispanic 294,800 5.2% Asian alone 259,649 4.5% Two or more races 42,125 0.7% American Indian alone 32,976 0.6% Other race alone 2,278 0.04% Native Hawaiian and Other
Income and house value in White Bear Lake Median household income in 2022 $76,972 White non-Hispanic householders$44,583 Black householders$119,587 Asian householders$64,402 Some other race householders$75,853 Two or more races householders$58,867 Hispanic or Latino race householdersMedian 2022 house value $320,775 White Non-Hispanic householders$270,685 Black or African American householders$339,282 American Indian or Alaska Native householders $366,671 Asian householders$462,657 Some other race householders$403,437 Hispanic or Latino householders
Median age by race in White Bear Lake
47.6 Median age for White residents43.3 50.5 31.9 Median age for Black or African American residents35.9 30.9 52.7 Median age for American Indian / Alaska Native residents-1,081,272,083.7 -696,340,256.5 25.8 Median age for Asian residents28.8 24.6 -744,336,568.8 Median age for Native Hawaiian / Pacific Islander residents-856,799,036.4 -534,959,349.1 30.2 Median age for Other race residents35.1 30.2 26.9 Median age for Two or more races residents23.6 27.1 48.4 Median age for White alone residents44.4 51.0 27.7 Median age for Hispanic or Latino residents15.4 33.7
Owner/renter occupied households by race in White Bear Lake
House owners and renters - White residents 6,112 67.9% Owner occupied2,893 32.1% Renter occupiedHouse owners and renters - Black or African American residents 79 30.8% Owner occupied179 69.2% Renter occupiedHouse owners and renters - American Indian / Alaska Native residents 9 100.0% Owner occupiedHouse owners and renters - Asian residents 167 51.6% Owner occupied156 48.4% Renter occupiedHouse owners and renters - Other race residents 86 45.7% Owner occupied102 54.3% Renter occupiedHouse owners and renters - Two or more races residents 174 39.0% Owner occupied273 61.0% Renter occupiedHouse owners and renters - White alone residents 6,095 68.6% Owner occupied2,785 31.4% Renter occupiedHouse owners and renters - Hispanic or Latino residents 161 34.6% Owner occupied305 65.4% Renter occupied
Language usage in White Bear Lake
English speakers - Total 91.0% of residents of White Bear Lake speak English at home.
4.4% of residents speak Spanish at home 529 53.3% Speak English very well463 46.7% Speak English less than very well5.0% of residents speak other language at home 741 66.4% Speak English very well375 33.6% Speak English less than very well
English speakers - Born in the United States 96.2% of residents of White Bear Lake speak English at home.
3.1% of residents speak Spanish at home 139 100.0% Speak English very well1.6% of residents speak other language at home 24 34.8% Speak English very well45 65.2% Speak English less than very well
English speakers - Native, born elsewhere 77.0% of residents of White Bear Lake speak English at home.
6.0% of residents speak Spanish at home 13 100.0% Speak English very well6.9% of residents speak other language at home 15 100.0% Speak English very well
English speakers - Foreign-born 27.7% of residents of White Bear Lake speak English at home.
34.4% of residents speak Spanish at home 205 33.2% Speak English very well413 66.8% Speak English less than very well38.2% of residents speak other language at home 448 65.1% Speak English very well240 34.9% Speak English less than very well
White (Caucasian) - Speak only English Native:
99.3% (17,942)Foreign-born:
61.9% (237)
White (Caucasian) - Speak another language Native:
1.2% (223)Foreign-born:
47.3% (181)
Black or African American - Speak only English Native:
100.0% (355)Foreign-born:
29.4% (94)
American Indian / Alaska Native - Speak another language Native:
100.0% (22)Foreign-born:
70.6% (16)
Asian - Speak only English Native:
34.9% (188)Foreign-born:
33.3% (134)
Asian - Speak another language Native:
65.2% (351)Foreign-born:
68.3% (275)
Other race - Speak only English Native:
18.6% (24)Foreign-born:
6.1% (35)
Other race - Speak another language Native:
80.1% (102)Foreign-born:
93.6% (528)
Two or more races - Speak only English Native:
97.6% (965)Foreign-born:
38.8% (2)
White alone - Speak only English Native:
99.8% (17,649)Foreign-born:
54.9% (257)
White alone - Speak another language Native:
0.6% (99)Foreign-born:
46.4% (217)
Hispanic or Latino - Speak only English Native:
58.1% (482)Foreign-born:
5.8% (34)
Hispanic or Latino - Speak another language Native:
41.5% (345)Foreign-born:
94.1% (556)
Foreign-born residents in White Bear Lake 1,897 residents are foreign born (2.5% Latin America , 1.9% Asia , 1.6% Europe , 1.5% Africa ).
This city:
8.0%Minnesota:
8.5%
Marital status for residents in White Bear Lake Marital status - White (Caucasian) population 15 years and over
Males 31.6% Never married54.0% Now married1.1% Separated5.1% Widowed8.2% DivorcedFemales 23.0% Never married48.0% Now married1.6% Separated9.1% Widowed18.3% DivorcedWomen who gave birth in the past 12 months Now married:
81.7% (182)Unmarried:
18.3% (41)
Women who did not give birth in the past 12 months Now married:
42.7% (1,519)Unmarried:
57.3% (2,034)
Marital status - Black or African American population 15 years and over
Males 57.2% Never married37.7% Now married0.0% Separated0.0% Widowed5.1% DivorcedFemales 8.4% Never married55.4% Now married25.7% Separated10.4% Widowed0.0% DivorcedWomen who gave birth in the past 12 months Now married:
100.0% (9)Unmarried:
0.0% (0)
Women who did not give birth in the past 12 months Now married:
90.1% (153)Unmarried:
9.9% (17)
Marital status - American Indian / Alaska Native population 15 years and over
Males 0.0% Never married100.0% Now married0.0% Separated0.0% Widowed0.0% DivorcedFemales 33.3% Never married66.7% Now married0.0% Separated0.0% Widowed0.0% DivorcedWomen who did not give birth in the past 12 months Now married:
100.0% (8)Unmarried:
0.0% (0)
Marital status - Asian population 15 years and over
Males 47.2% Never married28.2% Now married17.8% Separated6.5% Widowed0.3% DivorcedFemales 66.9% Never married33.1% Now married0.0% Separated0.0% Widowed0.0% DivorcedWomen who gave birth in the past 12 months Now married:
46.5% (46)Unmarried:
53.5% (53)
Women who did not give birth in the past 12 months Now married:
22.7% (53)Unmarried:
77.3% (180)
Marital status - Other race population 15 years and over
Males 24.3% Never married40.0% Now married31.9% Separated0.0% Widowed3.8% DivorcedFemales 11.0% Never married56.2% Now married22.4% Separated4.8% Widowed5.7% DivorcedWomen who did not give birth in the past 12 months Now married:
82.5% (280)Unmarried:
17.5% (59)
Marital status - Two or more races population 15 years and over
Males 80.3% Never married16.8% Now married1.7% Separated0.0% Widowed1.1% DivorcedFemales 65.2% Never married29.0% Now married0.0% Separated5.7% Widowed0.0% DivorcedWomen who gave birth in the past 12 months Now married:
0.0% (0)Unmarried:
100.0% (14)
Women who did not give birth in the past 12 months Now married:
30.1% (59)Unmarried:
69.9% (137)
Marital status - White alone, not Hispanic / Latino population 15 years and over
Males 31.8% Never married53.5% Now married1.2% Separated5.2% Widowed8.4% DivorcedFemales 22.4% Never married48.0% Now married1.5% Separated9.4% Widowed18.6% DivorcedWomen who gave birth in the past 12 months Now married:
81.0% (179)Unmarried:
19.0% (42)
Women who did not give birth in the past 12 months Now married:
42.7% (1,448)Unmarried:
57.3% (1,946)
Marital status - Hispanic or Latino population 15 years and over
Males 27.2% Never married57.0% Now married14.2% Separated0.0% Widowed1.7% DivorcedFemales 26.9% Never married53.1% Now married10.1% Separated1.8% Widowed8.1% DivorcedWomen who gave birth in the past 12 months Now married:
100.0% (9)Unmarried:
0.0% (0)
Women who did not give birth in the past 12 months Now married:
61.3% (313)Unmarried:
38.7% (198)
Ancestries in White Bear Lake
2,237 23.2% German584 6.1% American575 6.0% Norwegian522 5.4% Irish410 4.3% European292 3.0% Polish271 2.8% English237 2.5% Swedish212 2.2% Nigerian157 1.6% Ukrainian145 1.5% Ethiopian138 1.4% Scotch-Irish130 1.3% French Canadian125 1.3% Italian122 1.3% Slovene118 1.2% Scandinavian113 1.2% Finnish95 1.0% Eastern European71 0.7% Dutch49 0.5% French47 0.5% Northern European45 0.5% Scottish32 0.3% Danish32 0.3% Welsh29 0.3% Czech29 0.3% African26 0.3% Swiss25 0.3% Luxembourger24 0.2% Austrian23 0.2% Greek22 0.2% Czechoslovakian20 0.2% Romanian18 0.2% Serbian17 0.2% Turkish16 0.2% Lithuanian15 0.2% Lebanese14 0.1% Pennsylvania German14 0.1% Hungarian13 0.1% British9 0.09% Slovak7 0.07% Yugoslavian2 0.02% Sudanese
Geographical mobility in White Bear Lake Same house 1 year ago 16,678 86.5% White (Caucasian)492 60.5% Black or African American27 87.9% American Indian / Alaska Native789 71.6% Asian740 100.0% Other race917 82.4% Two or more races16,289 86.4% White alone, not Hispanic / Latino1,454 90.2% Hispanic or LatinoMoved within same county 1,194 6.2% White / Caucasian182 22.4% Black or African American110 9.9% Asian7 1.0% Other race74 6.7% Two or more races1,186 6.3% White alone, not Hispanic / Latino85 5.3% Hispanic or LatinoMoved within same state 1,007 5.2% White / Caucasian21 2.6% Black or African American5 14.7% American Indian / Alaska Native180 16.3% Asian101 9.1% Two or more races984 5.2% White alone, not Hispanic / Latino43 2.7% Hispanic or LatinoMoved from different state 326 1.7% White / Caucasian9 1.1% Black or African American12 1.1% Asian334 1.8% White alone, not Hispanic / LatinoMoved from abroad 10 0.1% White14 1.7% Black or African American22 2.0% Asian16 2.1% Other race10 0.1% White alone, not Hispanic / Latino16 1.0% Hispanic or Latino
Children Nativity (place of birth) in White Bear Lake
Children under 6 years - Living with two parents Both parents native 722 100.0% NativeBoth parents foreign-born 228 100.0% NativeOne native, one foreign-born parent 240 100.0% NativeChildren under 6 years - Living with one parent Native parent 369 100.0% NativeForeign-born parent 60 63.2% Native35 36.8% Foreign-bornChildren 6 to 17 years - Living with two parents Both parents native 1,464 96.7% Native49 3.3% Foreign-bornBoth parents foreign-born 140 53.9% Native119 46.1% Foreign-bornOne native, one foreign-born parent 205 97.2% Native6 2.8% Foreign-bornChildren 6 to 17 years - Living with one parent Native parent 1,192 100.0% NativeForeign-born parent 191 48.4% Native204 51.6% Foreign-born
Grandparents responsible for own grandchildren in White Bear Lake
Grandparents (30 to 59 years) White / Caucasian 13 16.8% Responsible for grandchildren64 83.2% Not responsible for grandchildrenAsian 5 100.0% Not responsible for grandchildrenWhite alone, not Hispanic / Latino 46 100.0% Not responsible for grandchildrenHispanic or Latino 12 64.9% Responsible for grandchildren6 35.1% Not responsible for grandchildrenGrandparents (60 years and over) White / Caucasian 130 68.1% Responsible for grandchildren61 31.9% Not responsible for grandchildrenWhite alone, not Hispanic / Latino 160 71.4% Responsible for grandchildren64 28.6% Not responsible for grandchildrenHispanic or Latino 8 100.0% Not responsible for grandchildren