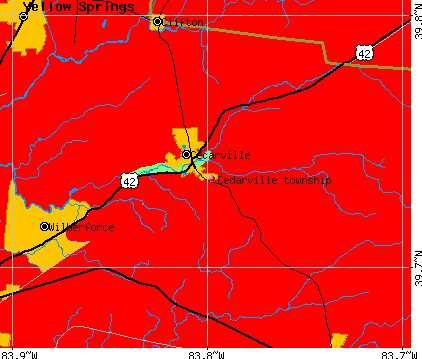
Cedarville township, Greene County, Ohio (OH) detailed profile
Number of foreign born residents: 1 (70% naturalized citizens)
| Cedarville township: | 0.7% |
| Whole state: | 3.0% |
38% of Cedarville township residents lived in the same house 5 years ago.
Out of people who lived in different houses, 20% lived in this county.
Out of people who lived in different counties, 28% lived in Ohio.
Place of birth for U.S.-born residents:
- This state: 2462
- Northeast: 880
- Midwest: 890
- South: 552
- West: 219
Median price asked for vacant for-sale houses in 2000: $77,500
Percentage of households with unmarried partners: 1.7%
Likely homosexual households (counted as self-reported same-sex unmarried-partner households)
- Lesbian couples: 0.2% of all households
- Gay men: 0.1% of all households
2,091 people in college dormitories (includes college quarters off campus)

Housing units in structures:
- One, detached: 887
- One, attached: 28
- Two: 67
- 3 or 4: 106
- 5 to 9: 38
- 10 to 19: 5
- 20 to 49: 19
- 50 or more: 3
- Mobile homes: 4
Housing units in Cedarville township with a mortgage: 377 (58 second mortgage, 66 home equity loan, 4 both second mortgage and home equity loan)
Houses without a mortgage: 186
- Educational services (30%)
- Accommodation and food services (11%)
- Construction (8%)
- Transportation equipment (5%)
- Public administration (5%)
- Administrative and support and waste management services (3%)
- Professional, scientific, and technical services (3%)
- Educational services (38%)
- Accommodation and food services (13%)
- Health care (10%)
- Social assistance (3%)
- Administrative and support and waste management services (3%)
- Other direct selling establishments (3%)
- Professional, scientific, and technical services (2%)
- Building and grounds cleaning and maintenance occupations (8%)
- Postsecondary teachers (6%)
- Other food preparation and serving workers including supervisors (5%)
- Engineers (4%)
- Computer specialists (3%)
- Retail sales workers except cashiers (3%)
- Other production occupations including supervisors (3%)
- Secretaries and administrative assistants (8%)
- Building and grounds cleaning and maintenance occupations (7%)
- Other office and administrative support workers including supervisors (6%)
- Waiters and waitresses (6%)
- Information and record clerks except customer service representatives (5%)
- Cashiers (4%)
- Preschool, kindergarten, elementary and middle school teachers (4%)
Most common first ancestries reported in Cedarville township:
- German (26.7%)
- English (14.5%)
- United States or American (10.1%)
- Irish (7.1%)
- Italian (4.1%)
- Dutch (3.4%)
- Scottish (3.1%)
Most common places of birth for the foreign-born residents:
- Brazil (41%)
- Korea (19%)
- Colombia (16%)
- China, excluding Hong Kong and Taiwan (8%)
- India (5%)
- Polynesia (5%)
- Canada (5%)
Means of transportation to work:
- Drove a car alone: 1,424 (58%)
- Carpooled: 180 (7%)
- Streetcar or trolley car: 2 (0%)
- Subway or elevated: 4 (0%)
- Taxi: 2 (0%)
- Motorcycle: 2 (0%)
- Bicycle: 6 (0%)
- Walked: 716 (29%)
- Other means: 12 (0%)
- Worked at home: 103 (4%)
Most commonly used house heating fuel:
- Utility gas (45%)
- Electricity (29%)
- Bottled, tank, or LP gas (13%)
- Fuel oil, kerosene, etc. (9%)
- Other fuel (2%)
- Wood (2%)
2,091 people in college dormitories (includes college quarters off campus)
96.9% of residents of Cedarville township speak English at home.
1.8% of residents speak Spanish at home (49% speak English very well, 14% speak English well, 38% speak English not well).
0.8% of residents speak other Indo-European language at home (90% speak English very well, 10% speak English not well).
0.5% of residents speak Asian or Pacific Island language at home (71% speak English very well, 29% speak English not well).
Household type by relationship:
Households: 3,014- In family households: 2,574 (701 male householders, 99 female householders)
676 spouses, 988 children (888 natural, 46 adopted, 54 stepchildren), 19 grandchildren, 9 brothers or sisters, 16 parents, 26 other relatives, 40 non-relatives
- In nonfamily households: 440 (140 male householders (95 living alone)), 151 female householders (122 living alone)), 149 nonrelatives
- In group quarters: 2,093 (0 institutionalized population)
Size of family households: 320 2-persons, 169 3-persons, 190 4-persons, 78 5-persons, 24 6-persons, 19 7-or-more-persons,
Size of nonfamily households: 217 1-person, 42 2-persons, 14 3-persons, 6 4-persons, 6 5-persons, 5 6-persons, 1 7-or-more-persons,
641 married couples with children.
88 single-parent households (24 men, 64 women).
Private vs. public school enrollment:
Students in private schools in grades 1 to 8 (elementary and middle school): 67
| Here: | 17.6% |
| Ohio: | 14.2% |
Students in private schools in grades 9 to 12 (high school): 36
| Here: | 15.5% |
| Ohio: | 10.9% |
Students in private undergraduate colleges: 2,321
| Here: | 94.6% |
| Ohio: | 23.4% |