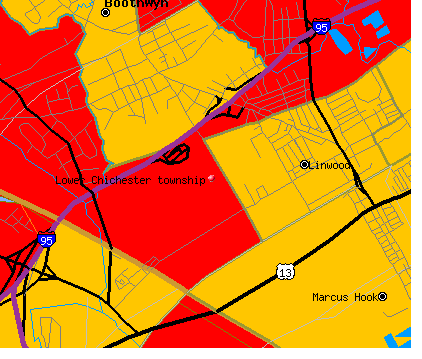
Lower Chichester township, Delaware County, Pennsylvania (PA) detailed profile
Number of foreign born residents: 2 (51% naturalized citizens)
| Lower Chichester township: | 1.9% |
| Whole state: | 4.1% |
71% of Lower Chichester township residents lived in the same house 5 years ago.
Out of people who lived in different houses, 78% lived in this county.
Out of people who lived in different counties, 32% lived in Pennsylvania.
Place of birth for U.S.-born residents:
- This state: 3162
- Northeast: 110
- Midwest: 67
- South: 155
- West: 17
Median price asked for vacant for-sale houses in 2000: $73,100
Percentage of households with unmarried partners: 7.1%
Likely homosexual households (counted as self-reported same-sex unmarried-partner households)
- Lesbian couples: 0.3% of all households
- Gay men: 0.1% of all households
7 people in religious group quarters
Housing units in structures:
- One, detached: 345
- One, attached: 867
- Two: 59
- 3 or 4: 39
- 5 to 9: 29
- 10 to 19: 17
Housing units in Lower Chichester township with a mortgage: 530 (26 second mortgage, 136 home equity loan, 6 both second mortgage and home equity loan)
Houses without a mortgage: 374
- Construction (14%)
- Metal and metal products (6%)
- Repair and maintenance (5%)
- Paper (5%)
- Food and beverage stores (5%)
- Chemicals (4%)
- Health care (4%)
- Health care (19%)
- Finance and insurance (10%)
- Educational services (10%)
- Accommodation and food services (9%)
- Administrative and support and waste management services (6%)
- Professional, scientific, and technical services (5%)
- Food and beverage stores (5%)
- Electrical equipment mechanics and other installation, maintenance, and repair occupations including supervisors (10%)
- Driver/sales workers and truck drivers (9%)
- Laborers and material movers, hand (9%)
- Other sales and related workers including supervisors (5%)
- Metal workers and plastic workers (5%)
- Building and grounds cleaning and maintenance occupations (4%)
- Material moving workers except supervisors and laborers and material movers, hand (4%)
- Other office and administrative support workers including supervisors (11%)
- Cashiers (6%)
- Retail sales workers except cashiers (6%)
- Secretaries and administrative assistants (5%)
- Health technologists and technicians (5%)
- Other healthcare support occupations (4%)
- Information and record clerks except customer service representatives (4%)
Most common first ancestries reported in Lower Chichester township:
- Irish (27.6%)
- Italian (22.5%)
- German (10.9%)
- English (9.5%)
- United States or American (6.0%)
- Polish (5.1%)
- Scotch-Irish (2.7%)
Most common places of birth for the foreign-born residents:
- Italy (54%)
- China, excluding Hong Kong and Taiwan (23%)
- Japan (9%)
- United Kingdom (7%)
- Korea (7%)
Means of transportation to work:
- Drove a car alone: 1,329 (82%)
- Carpooled: 176 (11%)
- Bus or trolley bus: 37 (2%)
- Railroad: 17 (1%)
- Walked: 64 (4%)
Most commonly used house heating fuel:
- Utility gas (49%)
- Fuel oil, kerosene, etc. (38%)
- Electricity (12%)
7 people in religious group quarters
95.9% of residents of Lower Chichester township speak English at home.
0.6% of residents speak Spanish at home (68% speak English very well, 32% speak English well).
2.7% of residents speak other Indo-European language at home (53% speak English very well, 39% speak English well, 8% speak English not well).
0.8% of residents speak Asian or Pacific Island language at home (79% speak English very well, 21% speak English not well).
Household type by relationship:
Households: 3,584- In family households: 3,114 (635 male householders, 269 female householders)
627 spouses, 1,350 children (1,262 natural, 18 adopted, 70 stepchildren), 108 grandchildren, 13 brothers or sisters, 18 parents, 43 other relatives, 51 non-relatives
- In nonfamily households: 470 (147 male householders (121 living alone)), 217 female householders (177 living alone)), 106 nonrelatives
- In group quarters: 7 (0 institutionalized population)
Size of family households: 263 2-persons, 237 3-persons, 225 4-persons, 115 5-persons, 60 6-persons, 4 7-or-more-persons,
Size of nonfamily households: 298 1-person, 53 2-persons, 6 3-persons, 7 5-persons,
606 married couples with children.
311 single-parent households (71 men, 240 women).
Private vs. public school enrollment:
Students in private schools in grades 1 to 8 (elementary and middle school): 40
| Here: | 8.6% |
| Pennsylvania: | 16.0% |
Students in private schools in grades 9 to 12 (high school): 0
| Here: | 0.0% |
| Pennsylvania: | 13.1% |
Students in private undergraduate colleges: 40
| Here: | 40.8% |
| Pennsylvania: | 37.3% |