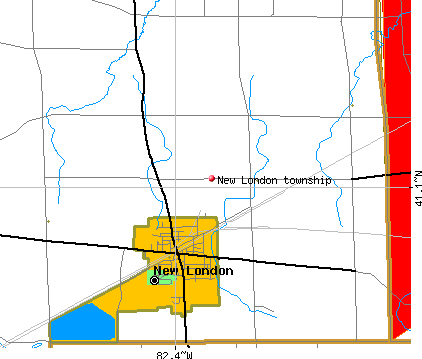
New London township, Huron County, Ohio (OH) detailed profile
Number of foreign born residents: 0 (100% naturalized citizens)
| New London township: | 0.2% |
| Whole state: | 3.0% |
55% of New London township residents lived in the same house 5 years ago.
Out of people who lived in different houses, 55% lived in this county.
Out of people who lived in different counties, 85% lived in Ohio.
Place of birth for U.S.-born residents:
- This state: 2750
- Northeast: 111
- Midwest: 139
- South: 349
- West: 30
Median price asked for vacant for-sale houses in 2000: $76,700
Percentage of households with unmarried partners: 6.3%
Likely homosexual households (counted as self-reported same-sex unmarried-partner households)
- Lesbian couples: 0.2% of all households
- Gay men: 0.2% of all households
44 people in nursing homes
Housing units in structures:
- One, detached: 914
- One, attached: 18
- Two: 90
- 3 or 4: 97
- 5 to 9: 33
- 10 to 19: 5
- 20 to 49: 50
- 50 or more: 4
- Mobile homes: 166
Median worth of mobile homes: $13,100
Housing units in New London township with a mortgage: 428 (41 second mortgage, 59 home equity loan, 8 both second mortgage and home equity loan)
Houses without a mortgage: 242
- Construction (15%)
- Metal and metal products (10%)
- Transportation equipment (8%)
- Miscellaneous manufacturing (6%)
- Public administration (5%)
- Educational services (4%)
- Accommodation and food services (3%)
- Health care (18%)
- Educational services (12%)
- Accommodation and food services (7%)
- Food and beverage stores (7%)
- Metal and metal products (6%)
- Religious, grantmaking, civic, professional, and similar organizations (5%)
- Miscellaneous manufacturing (4%)
- Other production occupations including supervisors (10%)
- Metal workers and plastic workers (9%)
- Assemblers and fabricators (5%)
- Electrical equipment mechanics and other installation, maintenance, and repair occupations including supervisors (4%)
- Vehicle and mobile equipment mechanics, installers, and repairers (4%)
- Laborers and material movers, hand (4%)
- Construction trades workers except carpenters, electricians, painters, plumbers, and construction laborers (4%)
- Metal workers and plastic workers (7%)
- Preschool, kindergarten, elementary and middle school teachers (6%)
- Health technologists and technicians (5%)
- Textile, apparel, and furnishings workers (4%)
- Cashiers (4%)
- Cooks and food preparation workers (4%)
- Nursing, psychiatric, and home health aides (4%)
Most common first ancestries reported in New London township:
- German (26.3%)
- United States or American (16.1%)
- English (14.6%)
- Irish (10.1%)
- Scottish (3.6%)
- Italian (2.6%)
- Polish (2.3%)
Most common places of birth for the foreign-born residents:
- United Kingdom (100%)
Means of transportation to work:
- Drove a car alone: 1,244 (81%)
- Carpooled: 147 (10%)
- Bus or trolley bus: 15 (1%)
- Bicycle: 5 (0%)
- Walked: 78 (5%)
- Other means: 18 (1%)
- Worked at home: 26 (2%)
Most commonly used house heating fuel:
- Utility gas (65%)
- Electricity (17%)
- Bottled, tank, or LP gas (9%)
- Fuel oil, kerosene, etc. (6%)
- Wood (2%)
- Other fuel (1%)
44 people in nursing homes
97.9% of residents of New London township speak English at home.
1.1% of residents speak Spanish at home (41% speak English very well, 59% speak English not well).
1.0% of residents speak other Indo-European language at home (100% speak English very well).
Household type by relationship:
Households: 3,349- In family households: 2,940 (758 male householders, 165 female householders)
768 spouses, 1,083 children (948 natural, 50 adopted, 85 stepchildren), 42 grandchildren, 4 brothers or sisters, 8 parents, 30 other relatives, 82 non-relatives
- In nonfamily households: 409 (183 male householders (150 living alone)), 176 female householders (168 living alone)), 50 nonrelatives
- In group quarters: 43 (all institutionalized)
Size of family households: 354 2-persons, 249 3-persons, 169 4-persons, 104 5-persons, 25 6-persons, 22 7-or-more-persons,
Size of nonfamily households: 318 1-person, 28 2-persons, 13 3-persons,
664 married couples with children.
192 single-parent households (50 men, 142 women).
Private vs. public school enrollment:
Students in private schools in grades 1 to 8 (elementary and middle school): 18
| Here: | 4.2% |
| Ohio: | 14.2% |
Students in private schools in grades 9 to 12 (high school): 23
| Here: | 10.6% |
| Ohio: | 10.9% |
Students in private undergraduate colleges: 24
| Here: | 29.3% |
| Ohio: | 23.4% |