Estimated zip code population in 2022: 1,378 Zip code population in 2010: 982 Zip code population in 2000: 820
Houses and condos: 610 Renter-occupied apartments: 67
% of renters here:
13%
State:
44%
March 2022 cost of living index in zip code 96069: 95.3 (near average, U.S. average is 100)
Land area: 88.6 sq. mi. Water area: 0.2 sq. mi.
Population density: 16 people per square mile
(very low).
OSM Map
General Map
Google Map
MSN Map
OSM Map
General Map
Google Map
MSN Map
OSM Map
General Map
Google Map
MSN Map
OSM Map
General Map
Google Map
MSN Map
Please wait while loading the map...
Real estate property taxes paid for housing units in 2022:
This zip code:
0.8% ($3,036)
California:
0.7% ($4,831)
Median real estate property taxes paid for housing units with mortgages in 2022: $3,468 (0.9%) Median real estate property taxes paid for housing units with no mortgage in 2022: $2,275 (0.7%)
Business Search- 14 Million verified businesses
Males: 736
(53.4%)
Females: 641
(46.6%)
For population 25 years and over in 96069:
High school or higher: 85.5%
Bachelor's degree or higher: 16.0%
Graduate or professional degree: 4.4%
Unemployed: 11.6%
Mean travel time to work (commute): 31.6 minutes
For population 15 years and over in 96069:
Never married: 21.3%
Now married: 56.5%
Separated: 0.6%
Widowed: 6.0%
Divorced: 15.5%
Zip code 96069 compared to state average:
Median house value below state average.
Unemployed percentage above state average.
Black race population percentage significantly below state average.
Hispanic race population percentage below state average.
Median age significantly above state average.
Foreign-born population percentage below state average.
Renting percentage significantly below state average.
Length of stay since moving in significantly above state average.
House age below state average.
Number of college students below state average.
Percentage of population with a bachelor's degree or higher below state average.
Averages for the 2020 tax year for zip code 96069, filed in 2021:
Average Adjusted Gross Income (AGI) in 2020: $62,468 (Individual Income Tax Returns)
Here:
$62,468
State:
$95,910
Salary/wage: $58,882 (reported on 57.9% of returns)
Here:
$58,882
State:
$77,331
(% of AGI for various income ranges: 922.5% for AGIs below $25k, 2926.0% for AGIs $25k-50k, 5731.7% for AGIs $50k-75k, 36570.0% for AGIs $100k-200k)
Taxable interest for individuals: $500 (reported on 34.2% of returns)
This zip code:
$500
California:
$2,294
(% of AGI for various income ranges: 8.8% for AGIs below $25k, 18.0% for AGIs $25k-50k, 25.0% for AGIs $50k-75k, 110.0% for AGIs $100k-200k)
Ordinary dividends: $5,600 (reported on 21.1% of returns)
Here:
$5,600
State:
$10,949
(% of AGI for various income ranges: 38.8% for AGIs below $25k, 314.0% for AGIs $25k-50k)
Net capital gain/loss in AGI: +$5,388 (reported on 21.1% of returns)
Here:
+$5,388
State:
+$49,306
(% of AGI for various income ranges: 150.0% for AGIs $25k-50k)
Profit/loss from business: +$13,367 (reported on 23.7% of returns)
Here:
+$13,367
State:
+$15,671
(% of AGI for various income ranges: 257.5% for AGIs below $25k, 976.0% for AGIs $25k-50k, 848.3% for AGIs $50k-75k)
Taxable individual retirement arrangement distribution: $15,500 (reported on 10.5% of returns)
96069:
$15,500
California:
$23,505
(% of AGI for various income ranges: 238.8% for AGIs below $25k, 715.0% for AGIs $50k-75k)
Total itemized deductions: $30,333 (reported on 7.9% of returns)
Here:
$30,333
State:
$39,517
(% of AGI for various income ranges: 1516.7% for AGIs $50k-75k)
Taxes paid: $6,067 (reported on 7.9% of returns)
96069:
$6,067
State:
$8,807
(% of AGI for various income ranges: 303.3% for AGIs $50k-75k)
Earned income credit: $2,267 (reported on 15.8% of returns)
Here:
$2,267
State:
$2,074
(% of AGI for various income ranges: 170.0% for AGIs below $25k)
Percentage of individuals using paid preparers for their 2020 taxes: 92.1%
Here:
92%
State:
92%
(% for various income ranges: 92.9% for AGIs below $25k, 88.9% for AGIs $25k-50k, 85.7% for AGIs $50k-75k, 100.0% for AGIs $75k-100k, 100.0% for AGIs $100k-200k)
Averages for the 2012 tax year for zip code 96069, filed in 2013:
Average Adjusted Gross Income (AGI) in 2012: $46,400 (Individual Income Tax Returns)
Here:
$46,400
State:
$72,726
Salary/wage: $41,530 (reported on 65.7% of returns)
Here:
$41,530
State:
$59,079
(% of AGI for various income ranges: 46.6% for AGIs below $25k, 60.2% for AGIs $25k-50k, 51.6% for AGIs $50k-75k, 46.0% for AGIs $75k-100k, 72.0% for AGIs $100k-200k)
Taxable interest for individuals: $594 (reported on 48.6% of returns)
This zip code:
$594
California:
$2,146
(% of AGI for various income ranges: 1.3% for AGIs below $25k, 0.6% for AGIs $25k-50k, 1.2% for AGIs $50k-75k, 0.3% for AGIs $100k-200k)
Ordinary dividends: $2,114 (reported on 20.0% of returns)
Here:
$2,114
State:
$9,308
(% of AGI for various income ranges: 2.2% for AGIs below $25k, 1.7% for AGIs $50k-75k, 2.2% for AGIs $75k-100k)
Net capital gain/loss in AGI: +$129 (reported on 20.0% of returns)
Here:
+$129
State:
+$30,460
Profit/loss from business: +$6,914 (reported on 20.0% of returns)
Here:
+$6,914
State:
+$17,064
Taxable individual retirement arrangement distribution: $8,850 (reported on 11.4% of returns)
96069:
$8,850
California:
$19,557
Total itemized deductions: $19,792 (27% of AGI, reported on 34.3% of returns)
Here:
$19,792
State:
$34,004
Here:
27.0% of AGI
State:
22.7% of AGI
(% of AGI for various income ranges: 19.2% for AGIs $25k-50k, 25.4% for AGIs $50k-75k, 15.2% for AGIs $100k-200k)
Charity contributions: $1,550 (reported on 22.9% of returns)
Here:
$1,550
State:
$4,659
Taxes paid: $7,100 (reported on 31.4% of returns)
96069:
$7,100
State:
$14,448
(% of AGI for various income ranges: 3.9% for AGIs $25k-50k, 7.2% for AGIs $50k-75k, 7.3% for AGIs $100k-200k)
Earned income credit: $1,850 (reported on 17.1% of returns)
Here:
$1,850
State:
$2,286
(% of AGI for various income ranges: 4.2% for AGIs below $25k, 1.4% for AGIs $25k-50k)
Percentage of individuals using paid preparers for their 2012 taxes: 54.3%
Here:
54%
State:
64%
(% for various income ranges: 46.2% for AGIs below $25k, 55.6% for AGIs $25k-50k, 83.3% for AGIs $50k-75k, 75.0% for AGIs $100k-200k)
Averages for the 2004 tax year for zip code 96069, filed in 2005:
Average Adjusted Gross Income (AGI) in 2004: $41,812 (Individual Income Tax Returns)
Here:
$41,812
State:
$58,600
Salary/wage: $37,862 (reported on 73.3% of returns)
Here:
$37,862
State:
$49,455
(% of AGI for various income ranges: 185.8% for AGIs below $10k, 57.3% for AGIs $10k-25k, 60.7% for AGIs $25k-50k, 71.6% for AGIs $50k-75k, 69.1% for AGIs $75k-100k, 65.0% for AGIs over 100k)
Taxable interest for individuals: $742 (reported on 53.9% of returns)
This zip code:
$742
California:
$2,365
(% of AGI for various income ranges: 8.4% for AGIs below $10k, 2.8% for AGIs $10k-25k, 1.0% for AGIs $25k-50k, 0.5% for AGIs $50k-75k, 0.3% for AGIs $75k-100k, 0.7% for AGIs over 100k)
Taxable dividends: $1,221 (reported on 22.3% of returns)
Here:
$1,221
State:
$4,746
(% of AGI for various income ranges: 2.3% for AGIs $10k-25k, 0.7% for AGIs $25k-50k, 0.6% for AGIs $50k-75k, 0.5% for AGIs over 100k)
Net capital gain/loss: +$8,754 (reported on 18.8% of returns)
Here:
+$8,754
State:
+$23,418
(% of AGI for various income ranges: -8.4% for AGIs below $10k, 0.6% for AGIs $10k-25k, 0.7% for AGIs $25k-50k, 4.3% for AGIs $50k-75k, 9.7% for AGIs over 100k)
Profit/loss from business: +$7,301 (reported on 21.2% of returns)
Here:
+$7,301
State:
+$16,826
(% of AGI for various income ranges: 23.9% for AGIs below $10k, 11.7% for AGIs $10k-25k, 2.3% for AGIs $25k-50k, 8.2% for AGIs $50k-75k, 0.2% for AGIs $75k-100k)
IRA payment deduction: $3,267 (reported on 4.3% of returns)
96069:
$3,267
California:
$3,192
Total itemized deductions: $17,488 (26% of AGI, reported on 37.4% of returns)
Here:
$17,488
State:
$28,113
Here:
25.8% of AGI
State:
25.3% of AGI
(% of AGI for various income ranges: 18.8% for AGIs $10k-25k, 13.9% for AGIs $25k-50k, 16.1% for AGIs $50k-75k, 18.6% for AGIs $75k-100k, 14.6% for AGIs over 100k)
Charity contributions deductions: $1,564 (2% of AGI, reported on 29.3% of returns)
Here:
$1,564
State:
$3,923
Here:
2.2% of AGI
State:
3.3% of AGI
(% of AGI for various income ranges: 0.8% for AGIs $10k-25k, 0.6% for AGIs $25k-50k, 1.4% for AGIs $50k-75k, 1.1% for AGIs $75k-100k, 1.4% for AGIs over 100k)
Total tax: $5,315 (reported on 77.4% of returns)
96069:
$5,315
State:
$10,761
(% of AGI for various income ranges: 5.2% for AGIs below $10k, 4.5% for AGIs $10k-25k, 6.7% for AGIs $25k-50k, 9.1% for AGIs $50k-75k, 9.6% for AGIs $75k-100k, 14.8% for AGIs over 100k)
Earned income credit: $1,535 (reported on 12.5% of returns)
Here:
$1,535
State:
$1,763
Percentage of individuals using paid preparers for their 2004 taxes: 60.3%
Here:
60%
State:
66%
(% for various income ranges: 42.2% for AGIs below $10k, 55.2% for AGIs $10k-25k, 65.9% for AGIs $25k-50k, 61.7% for AGIs $50k-75k, 92.0% for AGIs $75k-100k, 67.7% for AGIs over 100k)
Household received Food Stamps/SNAP in the past 12 months: 108 Household did not receive Food Stamps/SNAP in the past 12 months: 438
Women who had a birth in the past 12 months: 5 (2 now married, 3 unmarried) Women who did not have a birth in the past 12 months: 264 (135 now married, 127 unmarried)
Housing units in zip code 96069 with a mortgage: 241 (4 second mortgage, 4 both second mortgage and home equity loan) Median monthly owner costs for units with a mortgage: $1,762 Median monthly owner costs for units without a mortgage: $530
Residents with income below the poverty level in 2022:
This zip code:
23.8%
Whole state:
12.2%
Residents with income below 50% of the poverty level in 2022:
This zip code:
19.2%
Whole state:
6.2%
Median number of rooms in houses and condos:
Here:
6.1
State:
6.0
Median number of rooms in apartments:
Here:
5.2
State:
3.9
Notable locations in this zip code not listed on our city pages
In group quarters: 10 (-1 institutionalized population)
Size of family households: 199 2-persons, 33 3-persons, 82 4-persons, 1 5-persons, 20 6-persons, 21 7-or-more-persons
Size of nonfamily households: 160 1-person, 12 2-persons, 6 3-persons
235 married couples with children.
72 single-parent households (32 men, 40 women).
75.7% of residents of 96069 zip code speak English at home.
20.4% of residents speak Spanish at home (50% very well, 27% well, 23% not well).
1.8% of residents speak other Indo-European language at home (79% very well, 21% not well).
0.8% of residents speak Asian or Pacific Island language at home (55% very well, 45% well).
Foreign born population: 174 (12.7%) (58.2% of them are naturalized citizens)
This zip code:
12.7%
Whole state:
26.7%
78%Honduras
5%India
5%Malaysia
5%Romania
2%Belgium
1%Sri Lanka
12%English
9%American
9%German
7%Irish
6%Scotch-Irish
5%Italian
4%European
Year of entry for the foreign-born population
122010 or later
102000 to 2009
601990 to 1999
91Before 1990
Housing units lacking complete plumbing facilities: 0.8% Housing units lacking complete kitchen facilities: 0.8%
66.8%Wood
20.1%Bottled, tank, or LP gas
7.8%Electricity
5.1%Fuel oil, kerosene, etc.
0.6%Other fuel
Population in 1990: 1,160.
Place of birth for U.S.-born residents:
This state: 985
Northeast: 11
Midwest: 120
South: 39
West: 36
65% of the 96069 zip code residents lived in the same house 5 years ago. Out of people who lived in different houses, 61% lived in this county. Out of people who lived in different counties, 50% lived in California.
95% of the 96069 zip code residents lived in the same house 1 year ago. Out of people who lived in different houses, 41% moved from this county. Out of people who lived in different houses, 59% moved from different county within same state. Out of people who lived in different houses, 4% moved from different state.
Private vs. public school enrollment:
Students in private schools in grades 1 to 8 (elementary and middle school): 11
Here:
6.3%
California:
10.5%
Students in private schools in grades 9 to 12 (high school): 31
Here:
24.7%
California:
8.5%
Students in private undergraduate colleges: 5
Here:
18.6%
California:
15.9%
Occupation by median earnings in the past 12 months ($)
53,210Health diagnosing and treating practitioners and other technical occupations
48,882Management occupations
47,608Installation, maintenance, and repair occupations
35,208Sales and related occupations
30,902Healthcare support occupations
26,119Office and administrative support occupations
Top industries in this zip code by the number of employees in 2005:
Construction: Site Preparation Contractors (5-9 employees: 1 establishment)
Construction: Tile and Terrazzo Contractors (5-9: 1)
Professional, Scientific, and Technical Services: Other Specialized Design Services (5-9: 1)
Mining: All Other Metal Ore Mining (1-4: 1)
Utilities: Water Supply and Irrigation Systems (1-4: 1)
Construction: Commercial and Institutional Building Construction (1-4: 1)
People in group quarters in 2010:
10 people in group homes for juveniles (non-correctional)
5 people in workers' group living quarters and job corps centers
Fatal accident statistics in 2014:
Fatal accident count: 1
Vehicles involved in fatal accidents: 1
Fatal accidents caused by drunken drivers: 1
Fatalities: 1
Persons involved in fatal accidents: 1
Pedestrians involved in fatal accidents: 0
Home Mortgage Disclosure Act Aggregated Statistics For Year 2009 (Based on 2 partial tracts)
A) FHA, FSA/RHS & VA Home Purchase Loans
B) Conventional Home Purchase Loans
C) Refinancings
D) Home Improvement Loans
F) Non-occupant Loans on < 5 Family Dwellings (A B C & D)
G) Loans On Manufactured Home Dwelling (A B C & D)
Number
Average Value
Number
Average Value
Number
Average Value
Number
Average Value
Number
Average Value
Number
Average Value
LOANS ORIGINATED
3
$173,753
2
$259,175
15
$213,059
0
$0
1
$223,480
2
$115,300
APPLICATIONS APPROVED, NOT ACCEPTED
1
$110,790
1
$205,300
1
$176,220
0
$0
0
$0
1
$202,830
APPLICATIONS DENIED
1
$244,710
1
$237,870
9
$224,417
1
$40,570
1
$307,960
1
$176,080
APPLICATIONS WITHDRAWN
0
$0
0
$0
4
$176,660
0
$0
1
$90,440
0
$0
FILES CLOSED FOR INCOMPLETENESS
0
$0
0
$0
1
$159,500
0
$0
0
$0
0
$0
Aggregated Statistics For Year 2008 (Based on 2 partial tracts)
A) FHA, FSA/RHS & VA Home Purchase Loans
B) Conventional Home Purchase Loans
C) Refinancings
D) Home Improvement Loans
F) Non-occupant Loans on < 5 Family Dwellings (A B C & D)
G) Loans On Manufactured Home Dwelling (A B C & D)
Number
Average Value
Number
Average Value
Number
Average Value
Number
Average Value
Number
Average Value
Number
Average Value
LOANS ORIGINATED
1
$117,190
2
$283,675
10
$233,207
1
$149,470
1
$306,650
2
$155,070
APPLICATIONS APPROVED, NOT ACCEPTED
0
$0
1
$131,590
2
$261,140
1
$123,880
0
$0
2
$75,535
APPLICATIONS DENIED
1
$121,120
0
$0
8
$236,548
4
$122,462
0
$0
2
$175,570
APPLICATIONS WITHDRAWN
0
$0
1
$186,110
4
$225,915
0
$0
0
$0
0
$0
FILES CLOSED FOR INCOMPLETENESS
0
$0
0
$0
1
$242,090
1
$45,660
0
$0
0
$0
Aggregated Statistics For Year 2007 (Based on 2 partial tracts)
B) Conventional Home Purchase Loans
C) Refinancings
D) Home Improvement Loans
F) Non-occupant Loans on < 5 Family Dwellings (A B C & D)
G) Loans On Manufactured Home Dwelling (A B C & D)
Number
Average Value
Number
Average Value
Number
Average Value
Number
Average Value
Number
Average Value
LOANS ORIGINATED
7
$256,111
15
$235,975
3
$140,843
3
$332,967
2
$202,760
APPLICATIONS APPROVED, NOT ACCEPTED
1
$80,990
2
$304,760
1
$73,430
1
$306,790
0
$0
APPLICATIONS DENIED
2
$203,415
12
$235,997
4
$134,422
1
$409,010
2
$130,495
APPLICATIONS WITHDRAWN
0
$0
7
$200,736
2
$106,725
0
$0
1
$78,520
FILES CLOSED FOR INCOMPLETENESS
0
$0
2
$204,940
0
$0
0
$0
1
$73,570
Aggregated Statistics For Year 2006 (Based on 2 partial tracts)
B) Conventional Home Purchase Loans
C) Refinancings
D) Home Improvement Loans
F) Non-occupant Loans on < 5 Family Dwellings (A B C & D)
G) Loans On Manufactured Home Dwelling (A B C & D)
Number
Average Value
Number
Average Value
Number
Average Value
Number
Average Value
Number
Average Value
LOANS ORIGINATED
8
$219,318
21
$211,599
6
$100,228
4
$181,495
3
$141,863
APPLICATIONS APPROVED, NOT ACCEPTED
1
$403,780
3
$232,397
1
$50,160
0
$0
1
$156,450
APPLICATIONS DENIED
3
$186,353
12
$205,244
5
$142,026
2
$259,175
3
$147,000
APPLICATIONS WITHDRAWN
2
$162,630
9
$223,189
1
$86,370
0
$0
1
$101,200
FILES CLOSED FOR INCOMPLETENESS
0
$0
2
$201,815
0
$0
0
$0
0
$0
Aggregated Statistics For Year 2005 (Based on 2 partial tracts)
A) FHA, FSA/RHS & VA Home Purchase Loans
B) Conventional Home Purchase Loans
C) Refinancings
D) Home Improvement Loans
F) Non-occupant Loans on < 5 Family Dwellings (A B C & D)
G) Loans On Manufactured Home Dwelling (A B C & D)
Number
Average Value
Number
Average Value
Number
Average Value
Number
Average Value
Number
Average Value
Number
Average Value
LOANS ORIGINATED
1
$133,620
12
$230,302
22
$212,628
4
$166,592
3
$237,243
5
$131,674
APPLICATIONS APPROVED, NOT ACCEPTED
0
$0
4
$208,650
6
$222,243
1
$143,800
2
$247,615
2
$169,320
APPLICATIONS DENIED
0
$0
4
$223,952
14
$183,204
5
$131,732
2
$145,110
4
$153,652
APPLICATIONS WITHDRAWN
0
$0
3
$173,947
8
$210,158
1
$229,010
1
$77,060
1
$170,550
FILES CLOSED FOR INCOMPLETENESS
0
$0
0
$0
4
$215,920
0
$0
0
$0
0
$0
Aggregated Statistics For Year 2004 (Based on 2 partial tracts)
B) Conventional Home Purchase Loans
C) Refinancings
D) Home Improvement Loans
F) Non-occupant Loans on < 5 Family Dwellings (A B C & D)
G) Loans On Manufactured Home Dwelling (A B C & D)
Number
Average Value
Number
Average Value
Number
Average Value
Number
Average Value
Number
Average Value
LOANS ORIGINATED
14
$173,670
24
$174,935
4
$105,925
2
$218,900
3
$120,390
APPLICATIONS APPROVED, NOT ACCEPTED
1
$209,520
4
$158,378
1
$73,280
0
$0
1
$88,840
APPLICATIONS DENIED
3
$152,670
18
$174,480
2
$121,480
1
$154,120
3
$90,583
APPLICATIONS WITHDRAWN
2
$175,500
8
$171,445
0
$0
0
$0
0
$0
FILES CLOSED FOR INCOMPLETENESS
0
$0
3
$139,340
0
$0
0
$0
0
$0
Aggregated Statistics For Year 2003 (Based on 2 partial tracts)
A) FHA, FSA/RHS & VA Home Purchase Loans
B) Conventional Home Purchase Loans
C) Refinancings
D) Home Improvement Loans
F) Non-occupant Loans on < 5 Family Dwellings (A B C & D)
Number
Average Value
Number
Average Value
Number
Average Value
Number
Average Value
Number
Average Value
LOANS ORIGINATED
1
$113,270
9
$149,503
47
$154,251
3
$49,047
4
$167,938
APPLICATIONS APPROVED, NOT ACCEPTED
0
$0
2
$127,080
6
$156,378
1
$31,550
0
$0
APPLICATIONS DENIED
0
$0
3
$118,793
17
$150,575
2
$65,575
1
$159,790
APPLICATIONS WITHDRAWN
0
$0
2
$183,275
11
$132,645
1
$42,750
0
$0
FILES CLOSED FOR INCOMPLETENESS
0
$0
1
$98,440
1
$226,680
0
$0
0
$0
Aggregated Statistics For Year 1999 (Based on 1 partial tract)
A) FHA, FSA/RHS & VA Home Purchase Loans
B) Conventional Home Purchase Loans
C) Refinancings
D) Home Improvement Loans
F) Non-occupant Loans on < 5 Family Dwellings (A B C & D)
Detailed PMIC statistics for the following Tracts:0126.01
2005 - 2018 National Fire Incident Reporting System (NFIRS) incidents
According to the data from the years 2005 - 2018 the average number of fires per year is 9. The highest number of reported fires - 20 took place in 2015, and the least - 1 in 2005. The data has a growing trend.
When looking into fire subcategories, the most incidents belonged to: Outside Fires (57.4%), and Structure Fires (24.0%).
Fire incident types reported to NFIRS in Zip Code 96069

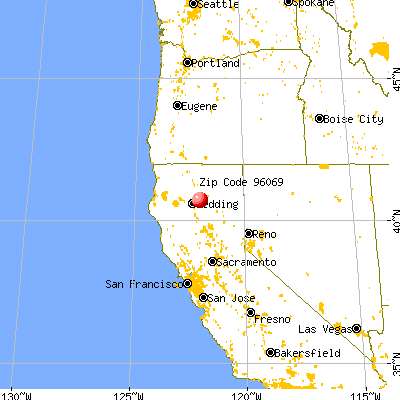


 Nearest zip codes: 96008, 96062, 96084, 96073, 96096, 96088.


 According to the data from the years 2005 - 2018 the average number of fires per year is 9. The highest number of reported fires - 20 took place in 2015, and the least - 1 in 2005. The data has a growing trend.
 When looking into fire subcategories, the most incidents belonged to: Outside Fires (57.4%), and Structure Fires (24.0%).