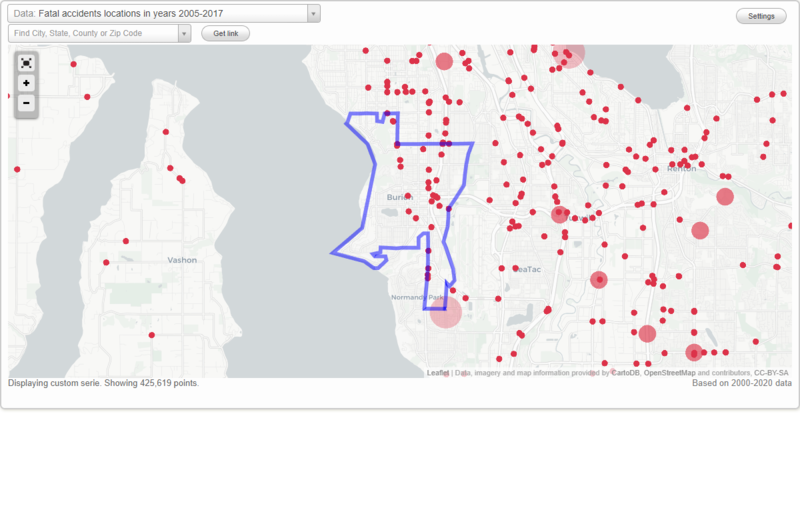
Fatal car crashes and road traffic accidents in Burien, Washington
- Fatal car crash and road traffic accident statistics for 2021
- Fatal accident count2
- Vehicles involved in fatal accidents7
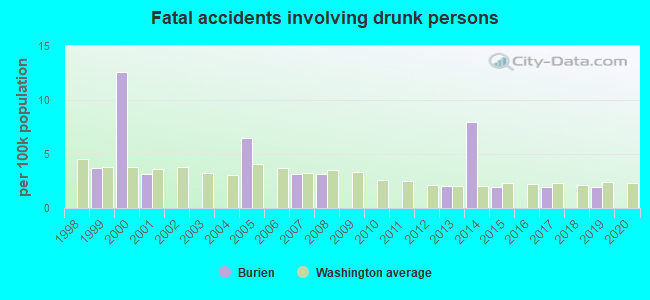
- Fatal accidents involving drunk persons0
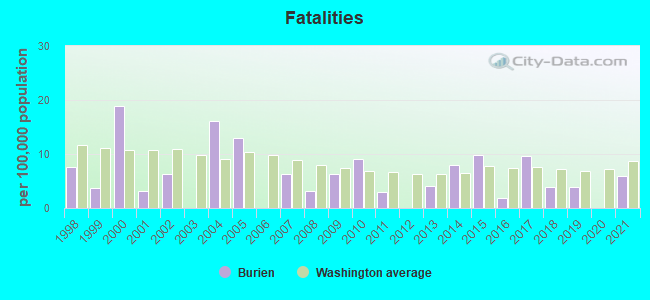
- Fatalities3
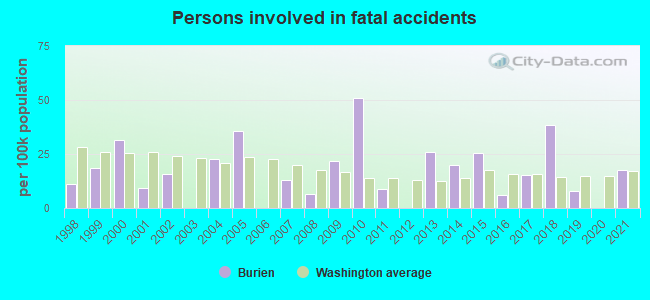
- Persons involved in fatal accidents9
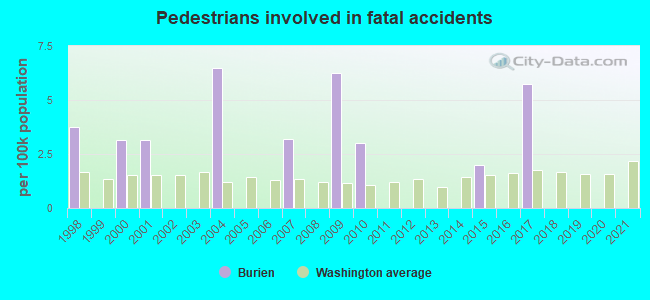
- Pedestrians involved in fatal accidents0
- Fatal car crash and road traffic accident statistics for 2019
- Fatal accident count2
- Vehicles involved in fatal accidents4
- Fatal accidents involving drunk persons1
- Fatalities2
- Persons involved in fatal accidents4
- Pedestrians involved in fatal accidents0
- Fatal car crash and road traffic accident statistics for 2018
- Fatal accident count2
- Vehicles involved in fatal accidents3
- Fatal accidents involving drunk persons0
- Fatalities2
- Persons involved in fatal accidents20
- Pedestrians involved in fatal accidents0
- Fatal car crash and road traffic accident statistics for 2017
- Fatal accident count5
- Vehicles involved in fatal accidents8
- Fatal accidents involving drunk persons1
- Fatalities5
- Persons involved in fatal accidents8
- Pedestrians involved in fatal accidents3
Data:
Latest news about accidents in Burien, WA collected exclusively by city-data.com from local newspapers, TV, and radio stations
No street view available for this location
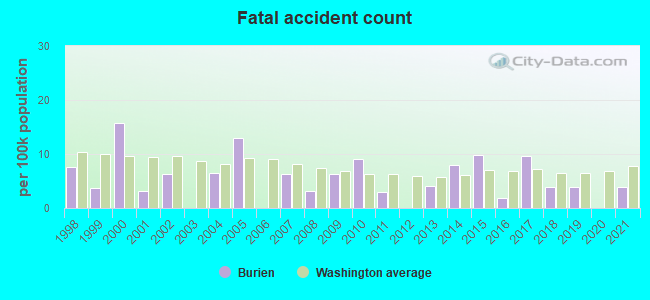
Burien fatal accident statistics for 1998 - 2021
Average EMS response time
- Burien(Based on 31 reports) 4.6 mins
- King County(Based on 3,619 reports) 5.6 mins
- Washington(Based on 17,122 reports) 8.2 mins
Average hospital transport time
- Burien(Based on 20 reports) 54.8 mins
- King County(Based on 1,630 reports) 52.1 mins
- Washington(Based on 8,762 reports) 49.2 mins
Dark - Lighted
- Burien(Based on 55 reports) 49.1%
- King County(Based on 5,652 reports) 34.4%
- Washington(Based on 27,943 reports) 18.4%
Daylight
- Burien(Based on 55 reports) 40.0%
- King County(Based on 5,652 reports) 41.0%
- Washington(Based on 27,943 reports) 45.6%
Dark - Not Lighted
- Burien(Based on 55 reports) 5.5%
- King County(Based on 5,652 reports) 20.6%
- Washington(Based on 27,943 reports) 31.6%
Dawn
- Burien(Based on 55 reports) 5.5%
- King County(Based on 5,652 reports) 1.3%
- Washington(Based on 27,943 reports) 1.5%
Clear
- Burien(Based on 55 reports) 58.2%
- King County(Based on 5,648 reports) 76.4%
- Washington(Based on 27,933 reports) 80.2%
Rain
- Burien(Based on 55 reports) 21.8%
- King County(Based on 5,648 reports) 16.4%
- Washington(Based on 27,933 reports) 12.1%
Unknown
- Burien(Based on 55 reports) 10.9%
- King County(Based on 5,648 reports) 4.2%
- Washington(Based on 27,933 reports) 3.2%
Fog, Smog, Smoke
- Burien(Based on 55 reports) 7.3%
- King County(Based on 5,648 reports) 1.3%
- Washington(Based on 27,933 reports) 1.9%
Snow
- Burien(Based on 55 reports) 1.8%
- King County(Based on 5,648 reports) 0.7%
- Washington(Based on 27,933 reports) 1.5%

Burien fatal car crash and road traffic accident list for 2021
Burien fatal car crash and road traffic accident list for 2019
Burien fatal car crash and road traffic accident list for 2018
| # | Date | Location | Vehicles | Drunk persons | Fatalites | Persons | Pedestrians |
|---|
| 1 | Apr 27, 2018 08:31 AM | Glendale Way S | 2 | - | 1
| 19 | - |
| 2 | Oct 22, 2018 02:00 AM | Sr-509 | 1 | - | 1
| 1 | - |
Burien fatal car crash and road traffic accident list for 2017
- Fatal accident count5
- Vehicles involved in fatal accidents8
- Fatal accidents involving drunk persons1
- Fatalities5
- Persons involved in fatal accidents8
- Pedestrians involved in fatal accidents3
Dark - Lighted
- Burien(Based on 5 reports) 40.0%
- King County(Based on 109 reports) 44.0%
- Washington(Based on 530 reports) 22.6%
Daylight
- Burien(Based on 5 reports) 40.0%
- King County(Based on 109 reports) 42.2%
- Washington(Based on 530 reports) 46.8%
Dawn
- Burien(Based on 5 reports) 20.0%
- King County(Based on 109 reports) 1.8%
- Washington(Based on 530 reports) 2.8%
Clear
- Burien(Based on 5 reports) 40.0%
- King County(Based on 102 reports) 62.7%
- Washington(Based on 493 reports) 66.5%
Rain
- Burien(Based on 5 reports) 40.0%
- King County(Based on 102 reports) 17.6%
- Washington(Based on 493 reports) 12.4%
Unknown
- Burien(Based on 5 reports) 20.0%
- King County(Based on 102 reports) 15.7%
- Washington(Based on 493 reports) 15.2%
Burien fatal car crash and road traffic accident list for 2016
| # | Date | Location | Vehicles | Drunk persons | Fatalites | Persons | Pedestrians |
|---|
| 1 | Oct 14, 2016 09:10 AM | 1st Ave S, S 116th St | 2 | - | 1
| 3 | - |
Burien fatal car crash and road traffic accident list for 2015
- Fatal accident count5
- Vehicles involved in fatal accidents11
- Fatal accidents involving drunk persons1
- Fatalities5
- Persons involved in fatal accidents13
- Pedestrians involved in fatal accidents1
Dark - Lighted
- Burien(Based on 5 reports) 80.0%
- King County(Based on 99 reports) 37.4%
- Washington(Based on 496 reports) 19.2%
Daylight
- Burien(Based on 5 reports) 20.0%
- King County(Based on 99 reports) 41.4%
- Washington(Based on 496 reports) 51.4%
Clear
- Burien(Based on 5 reports) 100.0%
- King County(Based on 100 reports) 71.0%
- Washington(Based on 493 reports) 70.4%
Burien fatal car crash and road traffic accident list for 2014
- Fatal accident count4
- Vehicles involved in fatal accidents7
- Fatal accidents involving drunk persons4
- Fatalities4
- Persons involved in fatal accidents10
Dark - Lighted
- Burien(Based on 4 reports) 100.0%
- King County(Based on 77 reports) 45.5%
- Washington(Based on 425 reports) 22.4%
Clear
- Burien(Based on 4 reports) 50.0%
- King County(Based on 77 reports) 64.9%
- Washington(Based on 422 reports) 69.7%
Fog, Smog, Smoke
- Burien(Based on 4 reports) 25.0%
- King County(Based on 77 reports) 3.9%
- Washington(Based on 422 reports) 2.8%
Rain
- Burien(Based on 4 reports) 25.0%
- King County(Based on 77 reports) 18.2%
- Washington(Based on 422 reports) 9.7%
Burien fatal car crash and road traffic accident list for 2013
Burien fatal car crash and road traffic accident list for 2011
Burien fatal car crash and road traffic accident list for 2010
| # | Date | Location | Vehicles | Drunk persons | Fatalites | Persons | Pedestrians |
|---|
| 1 | Jun 26, 2010 12:45 AM | Sw 148th St, 8th Ave Sw | 3 | - | 1
| 5 | - |
| 2 | Oct 18, 2010 10:53 PM | Sr-509 | 5 | - | 1
| 6 | 1 |
| 3 | Oct 18, 2010 10:53 PM | Sr-509 | 3 | - | 1
| 6 | - |
Burien fatal car crash and road traffic accident list for 2009
| # | Date | Location | Vehicles | Drunk persons | Fatalites | Persons | Pedestrians |
|---|
| 1 | Feb 11, 2009 04:14 AM | Sr-509 | 3 | - | 1
| 4 | 1 |
| 2 | Oct 10, 2009 04:47 PM | Sr-99 | 1 | - | 1
| 3 | 1 |
Burien fatal car crash and road traffic accident list for 2008
Burien fatal car crash and road traffic accident list for 2007
| # | Date | Location | Vehicles | Drunk persons | Fatalites | Persons | Pedestrians |
|---|
| 1 | May 15, 2007 12:24 AM | Ambaum Blvd | 1 | - | 1
| 2 | 1 |
| 2 | Jul 14, 2007 05:48 AM | Ambaum Blvd. | 1 | 1
| 1 | 2 | - |
Burien fatal car crash and road traffic accident list for 2005
- Fatal accident count4
- Vehicles involved in fatal accidents8
- Fatal accidents involving drunk persons2
- Fatalities4
- Persons involved in fatal accidents11
Average EMS response time
- Burien(Based on 2 reports) 3.0 mins
- King County(Based on 86 reports) 5.4 mins
- Washington(Based on 355 reports) 7.9 mins
Average hospital transport time
- Burien(Based on 2 reports) 38.5 mins
- King County(Based on 53 reports) 46.2 mins
- Washington(Based on 207 reports) 55.5 mins
Daylight
- Burien(Based on 4 reports) 50.0%
- King County(Based on 121 reports) 46.3%
- Washington(Based on 579 reports) 49.9%
Dark - Lighted
- Burien(Based on 4 reports) 25.0%
- King County(Based on 121 reports) 31.4%
- Washington(Based on 579 reports) 16.2%
Dark - Not Lighted
- Burien(Based on 4 reports) 25.0%
- King County(Based on 121 reports) 19.8%
- Washington(Based on 579 reports) 29.4%
Clear
- Burien(Based on 4 reports) 75.0%
- King County(Based on 122 reports) 85.2%
- Washington(Based on 580 reports) 84.1%
Rain
- Burien(Based on 4 reports) 25.0%
- King County(Based on 122 reports) 13.1%
- Washington(Based on 580 reports) 10.9%
| # | Date | Location | Vehicles | Drunk persons | Fatalites | Persons | Pedestrians |
|---|
| 1 | Jan 5, 2005 01:12 AM | Ambaum Blvd | 1 | - | 1
| 4 | - |
| 2 | Mar 20, 2005 09:10 AM | Ambaum Blvd | 3 | - | 1
| 3 | - |
| 3 | Apr 20, 2005 11:58 AM | 1st Ave S | 2 | - | 1
| 2 | - |
| 4 | Dec 28, 2005 02:11 AM | 4th Ave Sw | 2 | 2
| 1 | 2 | - |
Burien fatal car crash and road traffic accident list for 2004
| # | Date | Location | Vehicles | Drunk persons | Fatalites | Persons | Pedestrians |
|---|
| 1 | Jan 15, 2004 10:59 AM | S 183rd St | 1 | - | 1
| 3 | 2 |
| 2 | Sep 26, 2004 03:40 AM | Ambaum Blvd S | 1 | - | 4
| 4 | - |
Burien fatal car crash and road traffic accident list for 2002
| # | Date | Location | Vehicles | Drunk persons | Fatalites | Persons | Pedestrians |
|---|
| 1 | Mar 29, 2002 01:28 PM | 1st Ave | 2 | - | 1
| 3 | - |
| 2 | Dec 8, 2002 01:50 AM | 1st Ave Se | 1 | - | 1
| 2 | - |
Burien fatal car crash and road traffic accident list for 2001
| # | Date | Location | Vehicles | Drunk persons | Fatalites | Persons | Pedestrians |
|---|
| 1 | Nov 28, 2001 04:25 AM | 1staves | 1 | 1
| 1 | 3 | 1 |
Burien fatal car crash and road traffic accident list for 2000
- Fatal accident count5
- Vehicles involved in fatal accidents6
- Fatal accidents involving drunk persons4
- Fatalities6
- Persons involved in fatal accidents10
- Pedestrians involved in fatal accidents1
Average EMS response time
- Burien(Based on 5 reports) 7.4 mins
- King County(Based on 104 reports) 6.0 mins
- Washington(Based on 536 reports) 8.9 mins
Average hospital transport time
- Burien(Based on 5 reports) 38.2 mins
- King County(Based on 79 reports) 63.1 mins
- Washington(Based on 400 reports) 56.1 mins
Dark - Lighted
- Burien(Based on 5 reports) 60.0%
- King County(Based on 107 reports) 42.1%
- Washington(Based on 570 reports) 20.5%
Daylight
- Burien(Based on 5 reports) 20.0%
- King County(Based on 107 reports) 42.1%
- Washington(Based on 570 reports) 47.5%
Dawn
- Burien(Based on 5 reports) 20.0%
- King County(Based on 107 reports) 1.9%
- Washington(Based on 570 reports) 3.2%
Rain
- Burien(Based on 5 reports) 60.0%
- King County(Based on 107 reports) 18.7%
- Washington(Based on 572 reports) 14.0%
Clear
- Burien(Based on 5 reports) 40.0%
- King County(Based on 107 reports) 78.5%
- Washington(Based on 572 reports) 78.8%
| # | Date | Location | Vehicles | Drunk persons | Fatalites | Persons | Pedestrians |
|---|
| 1 | Sep 16, 2000 07:20 PM | Sw160street | 2 | 2
| 2 | 4 | - |
| 2 | Sep 25, 2000 07:01 AM | Ambaumblvdsw | 1 | - | 1
| 2 | 1 |
| 3 | Oct 9, 2000 10:50 PM | Sr-509 | 1 | 1
| 1 | 1 | - |
| 4 | Oct 29, 2000 08:05 AM | Sr-509 | 1 | - | 1
| 2 | - |
| 5 | Dec 21, 2000 11:16 PM | S136th | 1 | 1
| 1 | 1 | - |
Burien fatal car crash and road traffic accident list for 1999
| # | Date | Location | Vehicles | Drunk persons | Fatalites | Persons | Pedestrians |
|---|
| 1 | Dec 24, 1999 04:06 AM | 1stave | 2 | 1
| 1 | 5 | - |
Burien fatal car crash and road traffic accident list for 1998
| # | Date | Location | Vehicles | Drunk persons | Fatalites | Persons | Pedestrians |
|---|
| 1 | Apr 27, 1998 01:48 PM | Sr-509 | 1 | - | 1
| 1 | - |
| 2 | Dec 7, 1998 07:06 PM | Sw148thst | 1 | - | 1
| 2 | 1 |
Burien fatal car crash and road traffic accident list for 1997
| # | Date | Location | Vehicles | Drunk persons | Fatalites | Persons | Pedestrians |
|---|
| 1 | Jan 29, 1997 11:11 PM | 509 | 2 | 1
| 1 | 2 | - |
Burien fatal car crash and road traffic accident list for 1995
| # | Date | Location | Vehicles | Drunk persons | Fatalites | Persons | Pedestrians |
|---|
| 1 | Mar 14, 1995 10:31 AM | Sw150th | 1 | - | 1
| 2 | 1 |
Burien fatal car crash and road traffic accident list for 1993
| # | Date | Location | Vehicles | Drunk persons | Fatalites | Persons | Pedestrians |
|---|
| 1 | Mar 17, 1993 07:15 PM | 1staves | 2 | - | 1
| 5 | - |
| 2 | Apr 9, 1993 02:02 PM | 1staves | 2 | - | 1
| 4 | - |
Burien fatal car crash and road traffic accident list for 1992
| # | Date | Location | Vehicles | Drunk persons | Fatalites | Persons | Pedestrians |
|---|
| 1 | Dec 2, 1992 09:47 AM | Sw152ndst | 1 | - | 1
| 2 | 1 |
| 2 | Dec 24, 1992 07:51 PM | Sw148th | 1 | - | 1
| 1 | - |