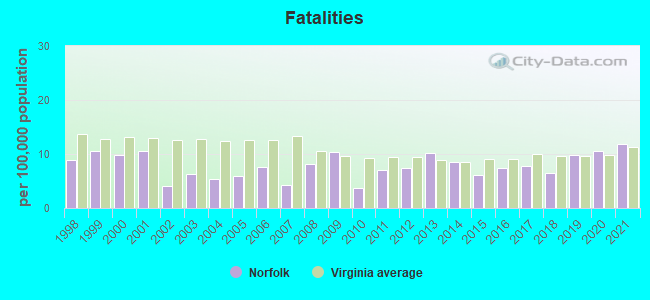
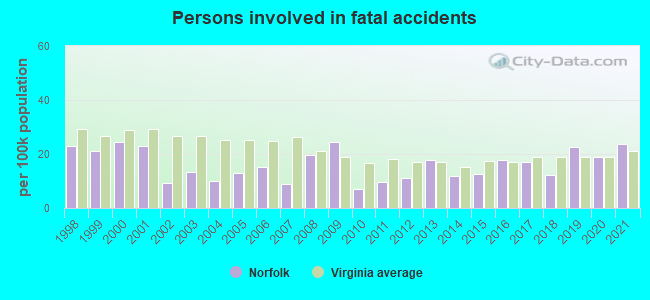
Fatal car crashes and road traffic accidents in Norfolk, Virginia
- Fatal car crash and road traffic accident statistics for 2021
- Fatal accident count27
- Vehicles involved in fatal accidents46
- Fatal accidents involving drunk persons0
- Fatalities28
- Persons involved in fatal accidents56
- Pedestrians involved in fatal accidents10
- Fatal car crash and road traffic accident statistics for 2020
- Fatal accident count23
- Vehicles involved in fatal accidents39
- Fatal accidents involving drunk persons8
- Fatalities25
- Persons involved in fatal accidents45
- Pedestrians involved in fatal accidents5
- Fatal car crash and road traffic accident statistics for 2019
- Fatal accident count24
- Vehicles involved in fatal accidents44
- Fatal accidents involving drunk persons10
- Fatalities24
- Persons involved in fatal accidents55
- Pedestrians involved in fatal accidents7
- Fatal car crash and road traffic accident statistics for 2018
- Fatal accident count16
- Vehicles involved in fatal accidents24
- Fatal accidents involving drunk persons2
- Fatalities16
- Persons involved in fatal accidents30
- Pedestrians involved in fatal accidents7

Data:
Latest news about accidents in Norfolk, VA collected exclusively by city-data.com from local newspapers, TV, and radio stations
No street view available for this location
Norfolk fatal accident statistics for 1998 - 2021
Average EMS response time
- Norfolk(Based on 22 reports) 6.1 mins
- Norfolk city County(Based on 22 reports) 6.1 mins
- Virginia(Based on 1,200 reports) 11.3 mins
Average hospital transport time
- Norfolk(Based on 15 reports) 27.7 mins
- Norfolk city County(Based on 15 reports) 27.7 mins
- Virginia(Based on 783 reports) 41.6 mins
Dark - Lighted
- Norfolk(Based on 1,063 reports) 51.1%
- Norfolk city County(Based on 1,068 reports) 51.0%
- Virginia(Based on 39,194 reports) 11.9%
Daylight
- Norfolk(Based on 1,063 reports) 35.5%
- Norfolk city County(Based on 1,068 reports) 35.6%
- Virginia(Based on 39,194 reports) 48.4%
Dark - Not Lighted
- Norfolk(Based on 1,063 reports) 10.3%
- Norfolk city County(Based on 1,068 reports) 10.3%
- Virginia(Based on 39,194 reports) 36.0%
Dusk
- Norfolk(Based on 1,063 reports) 2.0%
- Norfolk city County(Based on 1,068 reports) 2.0%
- Virginia(Based on 39,194 reports) 2.0%
Dawn
- Norfolk(Based on 1,063 reports) 0.8%
- Norfolk city County(Based on 1,068 reports) 0.7%
- Virginia(Based on 39,194 reports) 1.1%
Dark - Unknown Lighting
- Norfolk(Based on 1,063 reports) 0.4%
- Norfolk city County(Based on 1,068 reports) 0.4%
- Virginia(Based on 39,194 reports) 0.5%
Clear
- Norfolk(Based on 955 reports) 87.7%
- Norfolk city County(Based on 960 reports) 87.7%
- Virginia(Based on 35,090 reports) 86.9%
Rain
- Norfolk(Based on 955 reports) 10.8%
- Norfolk city County(Based on 960 reports) 10.8%
- Virginia(Based on 35,090 reports) 10.3%
Unknown
- Norfolk(Based on 955 reports) 7.2%
- Norfolk city County(Based on 960 reports) 7.2%
- Virginia(Based on 35,090 reports) 6.8%
Fog, Smog, Smoke
- Norfolk(Based on 955 reports) 0.7%
- Norfolk city County(Based on 960 reports) 0.7%
- Virginia(Based on 35,090 reports) 1.1%
Sleet or Hail
- Norfolk(Based on 955 reports) 0.2%
- Norfolk city County(Based on 960 reports) 0.2%
- Virginia(Based on 35,090 reports) 0.4%
Blowing Sand, Soil, Dirt
- Norfolk(Based on 955 reports) 0.2%
- Norfolk city County(Based on 960 reports) 0.2%
- Virginia(Based on 35,090 reports) 0.2%
Cloudy
- Norfolk(Based on 955 reports) 0.2%
- Norfolk city County(Based on 960 reports) 0.2%
- Virginia(Based on 35,090 reports) 0.2%
Snow
- Norfolk(Based on 955 reports) 0.1%
- Norfolk city County(Based on 960 reports) 0.1%
- Virginia(Based on 35,090 reports) 0.9%

Norfolk fatal car crash and road traffic accident list for 2021
- Fatal accident count27
- Vehicles involved in fatal accidents46
- Fatalities28
- Persons involved in fatal accidents56
- Pedestrians involved in fatal accidents10
Dark - Lighted
- Norfolk(Based on 27 reports) 66.7%
- Norfolk city County(Based on 27 reports) 66.7%
- Virginia(Based on 906 reports) 13.5%
Daylight
- Norfolk(Based on 27 reports) 29.6%
- Norfolk city County(Based on 27 reports) 29.6%
- Virginia(Based on 906 reports) 51.7%
Dark - Not Lighted
- Norfolk(Based on 27 reports) 3.7%
- Norfolk city County(Based on 27 reports) 3.7%
- Virginia(Based on 906 reports) 29.8%
Rain
- Norfolk(Based on 4 reports) 100.0%
- Norfolk city County(Based on 4 reports) 100.0%
- Virginia(Based on 96 reports) 83.3%
| # | Date | Location | Vehicles | Drunk persons | Fatalites | Persons | Pedestrians |
|---|
| 1 | Jan 10, 2021 03:45 PM | Leo St, 29th St | 2 | - | 1
| 3 | - |
| 2 | Jan 10, 2021 03:55 PM | I-64 | 2 | - | 1
| 2 | - |
| 3 | Apr 20, 2021 06:14 PM | Larkin St | 2 | - | 1
| 3 | 1 |
| 4 | Apr 6, 2021 09:03 PM | Sr-168/ Tidewater Dr | 1 | - | 1
| 1 | - |
| 5 | Mar 25, 2021 00:12 AM | Sr-194/Chesapeake Blvd | 1 | - | 1
| 1 | - |
| 6 | May 3, 2021 11:33 AM | Sr-406/Terminal Blvd | 2 | - | 1
| 1 | 1 |
| 7 | May 2, 2021 01:53 AM | Us-460 | 1 | - | 2
| 4 | - |
| 8 | May 23, 2021 00:55 AM | I-64 | 1 | - | 1
| 1 | - |
| 9 | May 27, 2021 11:34 PM | Us-460 | 3 | - | 1
| 3 | - |
| 10 | Jun 11, 2021 04:40 AM | Sr-337/ Hampton Blvd, W 27 St | 1 | - | 1
| 3 | 1 |
| 11 | Jul 11, 2021 11:16 PM | Sr-168/ Tidewater Dr, Lafayette Blvd | 1 | - | 1
| 1 | 1 |
| 12 | Jun 14, 2021 01:57 PM | Sr-168/ Tidewater Dr, Norman Ave | 2 | - | 1
| 2 | - |
| 13 | Jul 31, 2021 07:12 PM | Us-58, Glenrock Rd | 2 | - | 1
| 2 | - |
| 14 | Jul 28, 2021 11:37 PM | Us-460, Church St | 1 | - | 1
| 1 | - |
| 15 | Sep 15, 2021 02:40 AM | I-64 | 2 | - | 1
| 2 | - |
| 16 | Jul 29, 2021 11:16 AM | Robinhood Rd, Jersey Ave | 2 | - | 1
| 2 | - |
| 17 | Sep 5, 2021 11:29 PM | Sr-337/Hampton Blvd | 3 | - | 1
| 10 | - |
| 18 | Oct 3, 2021 09:29 PM | Sr-194/Chesapeake Blvd | 5 | - | 1
| 1 | - |
| 19 | Sep 23, 2021 04:15 AM | Sr-247/Chesapeake Blvd, Robin Hood Rd | 1 | - | 1
| 1 | 1 |
| 20 | Oct 30, 2021 01:55 AM | Sr-404/Princess Anne Rd | 1 | - | 1
| 1 | - |
| 21 | Nov 23, 2021 05:28 PM | Us-13 | 2 | - | 1
| 2 | 1 |
| 22 | Nov 14, 2021 05:09 AM | Us-60, 6th Bay St | 1 | - | 1
| 1 | 1 |
| 23 | Dec 1, 2021 06:40 PM | Us-60, Caliente St | 1 | - | 1
| 1 | 1 |
| 24 | Dec 14, 2021 02:56 PM | Sr-0165/Kempsville Rd, Barry Robinson Center | 2 | - | 1
| 2 | - |
| 25 | Dec 21, 2021 06:11 PM | Sr-247/Lafayette Blvd, Tidewater Dr | 2 | - | 1
| 2 | - |
| 26 | Feb 26, 2021 08:11 PM | Sr-194/Sewells Point Rd | 1 | - | 1
| 2 | 1 |
| 27 | Mar 21, 2021 02:28 AM | Montana Ave, Lafayette Blvd | 1 | - | 1
| 1 | 1 |
Norfolk fatal car crash and road traffic accident list for 2020
- Fatal accident count23
- Vehicles involved in fatal accidents39
- Fatal accidents involving drunk persons8
- Fatalities25
- Persons involved in fatal accidents45
- Pedestrians involved in fatal accidents5
Dark - Lighted
- Norfolk(Based on 23 reports) 47.8%
- Norfolk city County(Based on 23 reports) 47.8%
- Virginia(Based on 796 reports) 16.1%
Daylight
- Norfolk(Based on 23 reports) 43.5%
- Norfolk city County(Based on 23 reports) 43.5%
- Virginia(Based on 796 reports) 47.5%
Dawn
- Norfolk(Based on 23 reports) 4.3%
- Norfolk city County(Based on 23 reports) 4.3%
- Virginia(Based on 796 reports) 1.5%
Dusk
- Norfolk(Based on 23 reports) 4.3%
- Norfolk city County(Based on 23 reports) 4.3%
- Virginia(Based on 796 reports) 2.3%
Rain
- Norfolk(Based on 3 reports) 100.0%
- Norfolk city County(Based on 3 reports) 100.0%
- Virginia(Based on 131 reports) 77.9%
| # | Date | Location | Vehicles | Drunk persons | Fatalites | Persons | Pedestrians |
|---|
| 1 | Feb 27, 2020 10:33 AM | 35th St, Colley Ave | 2 | - | 1
| 2 | - |
| 2 | Jan 12, 2020 02:21 AM | I-264 | 1 | 1
| 1 | 2 | - |
| 3 | Mar 14, 2020 04:20 AM | I-64 | 2 | 1
| 1 | 2 | - |
| 4 | Mar 1, 2020 03:33 AM | Sr-165/Little Creek Rd, Hampton Blvd | 1 | 1
| 1 | 1 | - |
| 5 | Mar 24, 2020 09:10 AM | I-64 | 1 | - | 1
| 1 | 1 |
| 6 | Mar 27, 2020 11:26 PM | I-64/Ramp | 1 | - | 1
| 1 | 1 |
| 7 | Apr 22, 2020 06:04 AM | I-64 | 1 | - | 1
| 1 | - |
| 8 | Apr 5, 2020 04:20 PM | Chesapaeke Blvd, Middleton Pl | 2 | - | 1
| 3 | - |
| 9 | May 16, 2020 05:18 PM | Bayview Blvd, Meadowbrook Ln | 1 | - | 1
| 1 | 1 |
| 10 | May 19, 2020 05:09 PM | W 35th St, Hampton Blvd | 1 | - | 1
| 1 | 1 |
| 11 | May 20, 2020 07:00 AM | I-64 | 1 | - | 1
| 1 | - |
| 12 | Jun 19, 2020 05:07 PM | Sr-165/East Little Creek Rd, Pythian Ave | 3 | - | 1
| 2 | - |
| 13 | Jul 13, 2020 02:15 AM | Us-460 | 1 | 1
| 1 | 1 | - |
| 14 | Aug 1, 2020 06:30 AM | I-64 | 1 | - | 1
| 1 | - |
| 15 | Jul 29, 2020 02:36 PM | I-64 | 3 | - | 1
| 4 | - |
| 16 | Sep 2, 2020 07:38 AM | I-64 | 2 | - | 1
| 4 | - |
| 17 | Sep 17, 2020 06:49 PM | Sr-168/Tidewater Dr | 3 | - | 1
| 4 | - |
| 18 | Oct 1, 2020 01:16 AM | Us-13 | 1 | - | 1
| 1 | 1 |
| 19 | Oct 24, 2020 00:30 AM | Sr-247/Chesapeake Blvd | 3 | 1
| 1 | 1 | - |
| 20 | Oct 23, 2020 10:15 PM | Sr-166/Princess Anne Rd | 3 | 1
| 3 | 5 | - |
| 21 | Nov 9, 2020 09:19 PM | Sr-168/Tidewater Dr, Lafayette Blvd | 2 | 1
| 1 | 3 | - |
| 22 | Dec 17, 2020 09:38 PM | Us-58 | 2 | - | 1
| 2 | - |
| 23 | Oct 30, 2020 01:27 AM | Sr-192/Azalea Garden Rd | 1 | 1
| 1 | 1 | - |
Norfolk fatal car crash and road traffic accident list for 2019
- Fatal accident count24
- Vehicles involved in fatal accidents44
- Fatal accidents involving drunk persons10
- Fatalities24
- Persons involved in fatal accidents55
- Pedestrians involved in fatal accidents7
Dark - Lighted
- Norfolk(Based on 24 reports) 50.0%
- Norfolk city County(Based on 24 reports) 50.0%
- Virginia(Based on 771 reports) 14.5%
Daylight
- Norfolk(Based on 24 reports) 41.7%
- Norfolk city County(Based on 24 reports) 41.7%
- Virginia(Based on 771 reports) 49.0%
Dawn
- Norfolk(Based on 24 reports) 4.2%
- Norfolk city County(Based on 24 reports) 4.2%
- Virginia(Based on 771 reports) 2.3%
Dusk
- Norfolk(Based on 24 reports) 4.2%
- Norfolk city County(Based on 24 reports) 4.2%
- Virginia(Based on 771 reports) 3.1%
Rain
- Norfolk(Based on 3 reports) 100.0%
- Norfolk city County(Based on 3 reports) 100.0%
- Virginia(Based on 96 reports) 81.3%
| # | Date | Location | Vehicles | Drunk persons | Fatalites | Persons | Pedestrians |
|---|
| 1 | Jan 13, 2019 07:59 AM | I-64 | 2 | - | 1
| 2 | - |
| 2 | Jan 6, 2019 10:16 AM | Us-13, Wesleyan Dr | 2 | - | 1
| 2 | - |
| 3 | Feb 4, 2019 03:30 AM | I-264 | 1 | 1
| 1 | 1 | - |
| 4 | Feb 8, 2019 07:01 PM | Wide Street, Henry Street | 1 | - | 1
| 1 | 2 |
| 5 | Feb 17, 2019 05:58 PM | Sr-247/Norview Ave | 2 | 2
| 1 | 2 | - |
| 6 | Apr 11, 2019 05:44 AM | Granby Street | 5 | - | 1
| 7 | - |
| 7 | May 18, 2019 08:46 PM | Us-460, Fife Street | 1 | - | 1
| 1 | 1 |
| 8 | May 31, 2019 12:03 AM | Colley Ave, 27th St | 2 | 1
| 1 | 2 | - |
| 9 | Jun 11, 2019 09:22 AM | Sr-166 Princess Anne Rd, Mcneal Ave | 2 | - | 1
| 4 | - |
| 10 | Jun 22, 2019 09:36 PM | Sr-194 | 2 | - | 1
| 3 | - |
| 11 | Jul 25, 2019 11:41 AM | Colley Avenue, 38th Street | 3 | - | 1
| 5 | - |
| 12 | Aug 25, 2019 08:30 PM | Sr-165, Ruthven Dr | 2 | - | 1
| 3 | - |
| 13 | Sep 7, 2019 02:35 AM | I-64 | 2 | 1
| 1 | 2 | - |
| 14 | Sep 21, 2019 01:35 AM | Us-58, Park Ave | 2 | 1
| 1 | 1 | - |
| 15 | Sep 2, 2019 06:10 PM | Us-13 | 2 | - | 1
| 3 | - |
| 16 | Oct 21, 2019 07:05 PM | Sr-165/Little Creek Rd, Newport Ave | 1 | - | 1
| 1 | 1 |
| 17 | Oct 15, 2019 06:47 AM | Sr-168/Little Creek Rd, Tidewater Drive | 3 | - | 1
| 3 | - |
| 18 | Nov 9, 2019 05:23 AM | Sr-407/East Indian River Rd | 1 | 1
| 1 | 1 | - |
| 19 | Nov 9, 2019 11:10 AM | Sr-166/Princess Anne Rd, Halstead Ave | 1 | - | 1
| 1 | 1 |
| 20 | Nov 23, 2019 05:38 PM | Us-460, Charlotte St | 1 | - | 1
| 1 | 1 |
| 21 | Dec 5, 2019 09:15 AM | I-264 | 3 | 1
| 1 | 3 | - |
| 22 | Dec 6, 2019 10:09 PM | Ingleside Rd, Karlin Ave | 1 | 1
| 1 | 1 | 1 |
| 23 | May 17, 2019 02:08 PM | Burkdale Rd | 1 | 1
| 1 | 1 | - |
| 24 | Dec 31, 2019 01:47 PM | Wilson Rd, East Indian River Rd | 1 | - | 1
| 4 | - |
Norfolk fatal car crash and road traffic accident list for 2018
- Fatal accident count16
- Vehicles involved in fatal accidents24
- Fatal accidents involving drunk persons2
- Fatalities16
- Persons involved in fatal accidents30
- Pedestrians involved in fatal accidents7
Daylight
- Norfolk(Based on 16 reports) 43.8%
- Norfolk city County(Based on 16 reports) 43.8%
- Virginia(Based on 776 reports) 50.6%
Dark - Lighted
- Norfolk(Based on 16 reports) 37.5%
- Norfolk city County(Based on 16 reports) 37.5%
- Virginia(Based on 776 reports) 13.8%
Dusk
- Norfolk(Based on 16 reports) 18.8%
- Norfolk city County(Based on 16 reports) 18.8%
- Virginia(Based on 776 reports) 3.0%
Rain
- Norfolk(Based on 2 reports) 100.0%
- Norfolk city County(Based on 2 reports) 100.0%
- Virginia(Based on 106 reports) 84.9%
| # | Date | Location | Vehicles | Drunk persons | Fatalites | Persons | Pedestrians |
|---|
| 1 | Feb 22, 2018 08:11 PM | Us-460, Beverly Ave | 2 | 1
| 1 | 2 | - |
| 2 | Feb 26, 2018 09:14 PM | Us-13 N Military Hwy | 1 | - | 1
| 3 | 1 |
| 3 | Mar 13, 2018 06:04 AM | Sr-168 Tidewater Dr | 3 | - | 1
| 3 | - |
| 4 | Apr 3, 2018 05:49 PM | Sr-165 West Little Creek Rd, Newport Ave | 1 | - | 1
| 1 | 1 |
| 5 | Apr 13, 2018 03:28 PM | Sr-247 Chesapeake Blvd, Illinois Ave | 3 | - | 1
| 3 | - |
| 6 | May 18, 2018 05:48 PM | Ingleside Road | 1 | - | 1
| 1 | - |
| 7 | Jul 18, 2018 10:38 PM | Us-13 | 1 | 1
| 1 | 1 | 1 |
| 8 | Jul 11, 2018 08:22 PM | Auburn Avenue | 1 | - | 1
| 2 | - |
| 9 | Sep 21, 2018 04:50 PM | Sr-166 Ease Princess Anne Rd, Majestic Ave | 1 | - | 1
| 2 | 1 |
| 10 | Sep 3, 2018 07:59 PM | Shook Ave, Peronne Ave | 1 | - | 1
| 3 | 1 |
| 11 | Oct 1, 2018 04:30 PM | Us-46, Gilpin Avenue | 2 | - | 1
| 2 | - |
| 12 | Oct 18, 2018 02:45 PM | Sr-337 Hampton Blvd, 27th Street | 1 | - | 1
| 1 | 1 |
| 13 | Oct 27, 2018 01:00 AM | I-264 East | 1 | - | 1
| 2 | - |
| 14 | Nov 1, 2018 07:45 AM | Us-460, E 26th St | 2 | - | 1
| 2 | - |
| 15 | Nov 14, 2018 10:32 PM | Us-13, Ring Rd | 1 | - | 1
| 1 | 1 |
| 16 | Dec 10, 2018 04:44 PM | Us-460 | 2 | - | 1
| 1 | - |
Norfolk fatal car crash and road traffic accident list for 2017
- Fatal accident count18
- Vehicles involved in fatal accidents26
- Fatal accidents involving drunk persons5
- Fatalities19
- Persons involved in fatal accidents42
- Pedestrians involved in fatal accidents7
Dark - Lighted
- Norfolk(Based on 18 reports) 55.6%
- Norfolk city County(Based on 18 reports) 55.6%
- Virginia(Based on 782 reports) 12.7%
Daylight
- Norfolk(Based on 18 reports) 38.9%
- Norfolk city County(Based on 18 reports) 38.9%
- Virginia(Based on 782 reports) 54.2%
Dark - Not Lighted
- Norfolk(Based on 18 reports) 5.6%
- Norfolk city County(Based on 18 reports) 5.6%
- Virginia(Based on 782 reports) 28.6%
Rain
- Norfolk(Based on 3 reports) 100.0%
- Norfolk city County(Based on 3 reports) 100.0%
- Virginia(Based on 82 reports) 87.8%
| # | Date | Location | Vehicles | Drunk persons | Fatalites | Persons | Pedestrians |
|---|
| 1 | Mar 9, 2017 12:47 AM | Us-60 Ramp, Tidewater Dr | 1 | - | 1
| 1 | - |
| 2 | Mar 23, 2017 05:10 PM | Sr-170, Mona Dr | 2 | - | 1
| 4 | - |
| 3 | May 27, 2017 09:57 PM | Pythian Avenue | 1 | 1
| 1 | 1 | - |
| 4 | Jul 1, 2017 09:41 PM | Us-460 | 1 | - | 1
| 1 | 1 |
| 5 | Jul 7, 2017 02:44 PM | I-264 | 1 | - | 1
| 2 | - |
| 6 | Jul 21, 2017 10:22 PM | Us-60 | 1 | 1
| 1 | 1 | 1 |
| 7 | Aug 16, 2017 01:05 AM | Sr-170 | 2 | 1
| 2 | 2 | - |
| 8 | Aug 28, 2017 09:41 PM | Sr-194 | 1 | - | 1
| 5 | 1 |
| 9 | Oct 1, 2017 07:00 PM | Sr-168, So Shopping Center | 1 | - | 1
| 1 | 1 |
| 10 | Oct 1, 2017 04:30 PM | I-64 | 2 | - | 1
| 5 | - |
| 11 | Sep 27, 2017 08:22 PM | Sr-165, Longdale Dr | 2 | - | 1
| 4 | - |
| 12 | Oct 11, 2017 07:47 PM | Us-460, Maycox Ave | 1 | - | 1
| 1 | 1 |
| 13 | Nov 7, 2017 10:38 PM | Us-460, Charlotte St | 2 | - | 1
| 2 | 1 |
| 14 | Oct 30, 2017 00:24 AM | 38th Street | 1 | 1
| 1 | 1 | - |
| 15 | Dec 13, 2017 11:37 PM | Sr-168 | 2 | 1
| 1 | 2 | - |
| 16 | Nov 30, 2017 09:34 PM | Us-13 | 1 | - | 1
| 1 | 1 |
| 17 | Dec 21, 2017 12:36 AM | East Princess Anne Rd, Salter St | 2 | - | 1
| 2 | - |
| 18 | Dec 17, 2017 11:45 AM | Sr-337, Baker Rd | 2 | - | 1
| 6 | - |
Norfolk fatal car crash and road traffic accident list for 2016
- Fatal accident count18
- Vehicles involved in fatal accidents35
- Fatal accidents involving drunk persons4
- Fatalities18
- Persons involved in fatal accidents44
- Pedestrians involved in fatal accidents6
Average EMS response time
- Norfolk(Based on 10 reports) 5.3 mins
- Norfolk city County(Based on 10 reports) 5.3 mins
- Virginia(Based on 390 reports) 11.0 mins
Average hospital transport time
- Norfolk(Based on 8 reports) 25.5 mins
- Norfolk city County(Based on 8 reports) 25.5 mins
- Virginia(Based on 223 reports) 41.0 mins
Dark - Lighted
- Norfolk(Based on 18 reports) 55.6%
- Norfolk city County(Based on 18 reports) 55.6%
- Virginia(Based on 722 reports) 11.8%
Daylight
- Norfolk(Based on 18 reports) 38.9%
- Norfolk city County(Based on 18 reports) 38.9%
- Virginia(Based on 722 reports) 48.1%
Dark - Not Lighted
- Norfolk(Based on 18 reports) 5.6%
- Norfolk city County(Based on 18 reports) 5.6%
- Virginia(Based on 722 reports) 35.5%
Rain
- Norfolk(Based on 3 reports) 100.0%
- Norfolk city County(Based on 3 reports) 100.0%
- Virginia(Based on 79 reports) 77.2%
| # | Date | Location | Vehicles | Drunk persons | Fatalites | Persons | Pedestrians |
|---|
| 1 | Jan 8, 2016 02:37 PM | Sr-168 | 7 | - | 1
| 7 | - |
| 2 | Feb 1, 2016 05:05 PM | Llewellyn Avenue, West 27th Street | 2 | - | 1
| 5 | - |
| 3 | Mar 31, 2016 09:06 PM | Azalea Garden Rd | 1 | - | 1
| 1 | 1 |
| 4 | Apr 8, 2016 06:34 PM | Us-460, Tidewater Dr | 2 | - | 1
| 2 | - |
| 5 | May 16, 2016 09:27 AM | Newtown Rd, Curlew Dr | 1 | - | 1
| 1 | 1 |
| 6 | Apr 24, 2016 00:10 AM | Sr-166, Sewells Point Rd | 3 | 1
| 1 | 6 | - |
| 7 | May 7, 2016 10:07 PM | Sr-337, Surrey Crescent | 2 | - | 1
| 2 | - |
| 8 | Jun 20, 2016 01:59 PM | Us-460, Patrol Rd | 2 | - | 1
| 3 | - |
| 9 | Jun 9, 2016 01:54 PM | Sr-165, I-64 | 3 | - | 1
| 4 | - |
| 10 | Aug 12, 2016 00:48 AM | Sr-165, Major Ave | 2 | 1
| 1 | 3 | - |
| 11 | Sep 2, 2016 09:00 PM | Goff Street, Tidewater Dr | 1 | - | 1
| 1 | 1 |
| 12 | Sep 1, 2016 06:11 AM | Sr-166, Ballentine Blvd | 2 | - | 1
| 2 | - |
| 13 | Sep 20, 2016 08:05 PM | Sr-247, Vimy Ridge Rd | 2 | 2
| 1 | 2 | - |
| 14 | Sep 16, 2016 07:37 AM | Middle Avenue, Lindenwood Ave | 1 | - | 1
| 1 | - |
| 15 | Sep 28, 2016 06:04 AM | Sr-337 | 1 | - | 1
| 1 | 1 |
| 16 | Nov 19, 2016 08:06 PM | Sr-168, Pope Ave | 1 | - | 1
| 1 | 1 |
| 17 | Nov 26, 2016 01:19 AM | Us-460 | 1 | - | 1
| 1 | - |
| 18 | Dec 31, 2016 06:34 PM | Poplar Hall Dr, Frizzel Ave | 1 | - | 1
| 1 | 1 |
Norfolk fatal car crash and road traffic accident list for 2015
- Fatal accident count15
- Vehicles involved in fatal accidents24
- Fatal accidents involving drunk persons6
- Fatalities15
- Persons involved in fatal accidents31
- Pedestrians involved in fatal accidents3
Average EMS response time
- Norfolk(Based on 8 reports) 6.5 mins
- Norfolk city County(Based on 8 reports) 6.5 mins
- Virginia(Based on 382 reports) 11.5 mins
Average hospital transport time
- Norfolk(Based on 6 reports) 28.0 mins
- Norfolk city County(Based on 6 reports) 28.0 mins
- Virginia(Based on 277 reports) 41.5 mins
Daylight
- Norfolk(Based on 15 reports) 46.7%
- Norfolk city County(Based on 15 reports) 46.7%
- Virginia(Based on 711 reports) 52.2%
Dark - Lighted
- Norfolk(Based on 15 reports) 46.7%
- Norfolk city County(Based on 15 reports) 46.7%
- Virginia(Based on 711 reports) 10.8%
Dark - Not Lighted
- Norfolk(Based on 15 reports) 6.7%
- Norfolk city County(Based on 15 reports) 6.7%
- Virginia(Based on 711 reports) 33.2%
Clear
- Norfolk(Based on 15 reports) 93.3%
- Norfolk city County(Based on 15 reports) 93.3%
- Virginia(Based on 711 reports) 85.5%
Unknown
- Norfolk(Based on 15 reports) 93.3%
- Norfolk city County(Based on 15 reports) 93.3%
- Virginia(Based on 711 reports) 85.5%
Rain
- Norfolk(Based on 15 reports) 6.7%
- Norfolk city County(Based on 15 reports) 6.7%
- Virginia(Based on 711 reports) 11.3%
| # | Date | Location | Vehicles | Drunk persons | Fatalites | Persons | Pedestrians |
|---|
| 1 | Jan 23, 2015 12:40 AM | I-64 | 2 | - | 1
| 5 | - |
| 2 | Feb 4, 2015 05:23 AM | Sr-168, Norview Ave | 1 | - | 1
| 1 | 1 |
| 3 | Feb 7, 2015 02:22 AM | Sr-194 | 1 | 1
| 1 | 2 | - |
| 4 | Apr 2, 2015 05:51 AM | I-64 | 3 | 1
| 1 | 3 | - |
| 5 | Apr 15, 2015 06:45 AM | I-64 | 2 | - | 1
| 2 | - |
| 6 | Mar 8, 2015 04:10 PM | Hudson Ave, Clarence Street | 2 | 1
| 1 | 2 | - |
| 7 | Apr 2, 2015 10:08 PM | Poplar Hall Rd | 1 | 1
| 1 | 1 | - |
| 8 | Jun 2, 2015 08:45 PM | I-64 | 1 | 1
| 1 | 1 | - |
| 9 | May 25, 2015 06:40 PM | Us-60 | 1 | - | 1
| 2 | 1 |
| 10 | Jul 8, 2015 03:21 PM | Us-58, Landing St | 2 | - | 1
| 2 | - |
| 11 | Sep 6, 2015 11:36 PM | I-264 | 1 | - | 1
| 1 | - |
| 12 | Sep 23, 2015 03:17 PM | I-564 | 3 | - | 1
| 3 | - |
| 13 | Nov 17, 2015 06:07 PM | Crowell Dr, Marne Ave | 1 | - | 1
| 1 | 1 |
| 14 | Nov 29, 2015 11:05 AM | Robin Hood Road | 2 | - | 1
| 1 | - |
| 15 | Dec 13, 2015 04:22 AM | Sellger Dr, South Military Hwy | 1 | 1
| 1 | 4 | - |
Norfolk fatal car crash and road traffic accident list for 2014
- Fatal accident count20
- Vehicles involved in fatal accidents26
- Fatal accidents involving drunk persons9
- Fatalities21
- Persons involved in fatal accidents29
- Pedestrians involved in fatal accidents9
Dark - Lighted
- Norfolk(Based on 20 reports) 65.0%
- Norfolk city County(Based on 20 reports) 65.0%
- Virginia(Based on 659 reports) 12.6%
Daylight
- Norfolk(Based on 20 reports) 25.0%
- Norfolk city County(Based on 20 reports) 25.0%
- Virginia(Based on 659 reports) 49.8%
Dark - Not Lighted
- Norfolk(Based on 20 reports) 10.0%
- Norfolk city County(Based on 20 reports) 10.0%
- Virginia(Based on 659 reports) 33.1%
Clear
- Norfolk(Based on 20 reports) 90.0%
- Norfolk city County(Based on 20 reports) 90.0%
- Virginia(Based on 659 reports) 87.7%
Unknown
- Norfolk(Based on 20 reports) 90.0%
- Norfolk city County(Based on 20 reports) 90.0%
- Virginia(Based on 659 reports) 88.3%
Rain
- Norfolk(Based on 20 reports) 10.0%
- Norfolk city County(Based on 20 reports) 10.0%
- Virginia(Based on 659 reports) 10.2%
| # | Date | Location | Vehicles | Drunk persons | Fatalites | Persons | Pedestrians |
|---|
| 1 | Feb 28, 2014 09:58 PM | I-64 | 2 | 1
| 1 | 2 | - |
| 2 | Mar 30, 2014 08:15 PM | Us-13, Poplar Hall Rd | 1 | - | 1
| 1 | 1 |
| 3 | Apr 25, 2014 07:43 AM | I-64 | 2 | - | 1
| 2 | - |
| 4 | May 12, 2014 02:02 AM | Us-60 | 1 | 1
| 1 | 1 | - |
| 5 | Jun 5, 2014 08:53 PM | Colley Ave, 38th Street | 2 | - | 1
| 2 | - |
| 6 | Jun 3, 2014 06:54 PM | Lowery Rd, Kempsville Rd | 2 | - | 1
| 2 | - |
| 7 | Jun 24, 2014 09:07 PM | Wesleyan Dr | 2 | - | 1
| 3 | 2 |
| 8 | Jul 10, 2014 08:25 PM | I-64 | 2 | 1
| 1 | 2 | - |
| 9 | Sep 3, 2014 01:08 PM | Sr-406 | 1 | - | 1
| 1 | - |
| 10 | Oct 24, 2014 00:19 AM | Sr-337 | 1 | 1
| 1 | 1 | - |
| 11 | Oct 31, 2014 01:45 PM | I-464 | 1 | - | 1
| 1 | - |
| 12 | Oct 31, 2014 08:38 PM | Sr-7 | 1 | - | 1
| 1 | 1 |
| 13 | Nov 1, 2014 00:05 AM | I-64 | 1 | 1
| 1 | 1 | 1 |
| 14 | Nov 10, 2014 08:27 PM | Sr-166 | 1 | - | 1
| 1 | 1 |
| 15 | Nov 23, 2014 08:06 PM | I-64 | 1 | 1
| 1 | 1 | - |
| 16 | Nov 24, 2014 09:42 PM | Norview Ave, Hyde Circle | 1 | 1
| 1 | 1 | 1 |
| 17 | Dec 2, 2014 01:52 AM | Sr-337 | 1 | 1
| 1 | 1 | - |
| 18 | Dec 7, 2014 03:34 AM | Sewells Point Road | 1 | 1
| 2 | 3 | - |
| 19 | Dec 12, 2014 11:52 AM | Us-60 | 1 | - | 1
| 1 | 1 |
| 20 | Dec 21, 2014 09:11 PM | Azalea Garden Rd | 1 | - | 1
| 1 | 1 |
Norfolk fatal car crash and road traffic accident list for 2013
- Fatal accident count24
- Vehicles involved in fatal accidents38
- Fatal accidents involving drunk persons9
- Fatalities25
- Persons involved in fatal accidents44
- Pedestrians involved in fatal accidents10
Dark - Lighted
- Norfolk(Based on 24 reports) 58.3%
- Norfolk city County(Based on 24 reports) 58.3%
- Virginia(Based on 682 reports) 12.2%
Daylight
- Norfolk(Based on 24 reports) 29.2%
- Norfolk city County(Based on 24 reports) 29.2%
- Virginia(Based on 682 reports) 48.2%
Dark - Not Lighted
- Norfolk(Based on 24 reports) 8.3%
- Norfolk city County(Based on 24 reports) 8.3%
- Virginia(Based on 682 reports) 35.6%
Dusk
- Norfolk(Based on 24 reports) 4.2%
- Norfolk city County(Based on 24 reports) 4.2%
- Virginia(Based on 682 reports) 1.9%
Clear
- Norfolk(Based on 24 reports) 79.2%
- Norfolk city County(Based on 24 reports) 79.2%
- Virginia(Based on 682 reports) 82.3%
Unknown
- Norfolk(Based on 24 reports) 79.2%
- Norfolk city County(Based on 24 reports) 79.2%
- Virginia(Based on 682 reports) 82.8%
Rain
- Norfolk(Based on 24 reports) 20.8%
- Norfolk city County(Based on 24 reports) 20.8%
- Virginia(Based on 682 reports) 14.2%
| # | Date | Location | Vehicles | Drunk persons | Fatalites | Persons | Pedestrians |
|---|
| 1 | Jan 11, 2013 02:21 AM | Us-60 | 1 | 1
| 1 | 1 | - |
| 2 | Jan 30, 2013 06:41 PM | Sr-168, Norview Ave | 1 | - | 1
| 1 | 1 |
| 3 | Mar 5, 2013 08:07 PM | Sr-247 | 2 | - | 1
| 2 | 1 |
| 4 | Mar 13, 2013 11:00 AM | Sr-247, 3700 Nansemond Circle | 2 | 1
| 1 | 4 | - |
| 5 | Mar 16, 2013 07:27 PM | Sr-168 | 1 | - | 1
| 1 | 1 |
| 6 | Mar 16, 2013 08:31 PM | 700 Colonial Ave, 500 Boissevain Ave | 2 | - | 1
| 2 | 1 |
| 7 | Apr 19, 2013 04:28 AM | Sr-168 | 2 | 1
| 2 | 3 | - |
| 8 | May 31, 2013 07:58 AM | Azalea Garden Rd | 1 | - | 1
| 1 | - |
| 9 | Jun 14, 2013 11:36 AM | I-64 | 2 | 1
| 1 | 2 | - |
| 10 | Jun 19, 2013 09:35 PM | Us-60 | 2 | - | 1
| 2 | 1 |
| 11 | Jul 16, 2013 07:50 PM | I-264 | 2 | 1
| 1 | 2 | - |
| 12 | Jul 21, 2013 02:00 AM | I-264 | 2 | 1
| 1 | 3 | - |
| 13 | Aug 28, 2013 08:25 AM | Us-58, Park Ave | 1 | - | 1
| 1 | 1 |
| 14 | Sep 7, 2013 01:20 PM | I-64 Wst | 2 | 1
| 1 | 2 | - |
| 15 | Sep 12, 2013 08:16 PM | I-264 | 1 | 1
| 1 | 1 | - |
| 16 | Sep 13, 2013 10:30 AM | Us-58, 1000 George St | 2 | - | 1
| 3 | - |
| 17 | Oct 11, 2013 07:58 PM | Sr-17, Camellia Rd | 1 | - | 1
| 2 | - |
| 18 | Oct 16, 2013 06:39 AM | Sr-168, Mason Creek Rd | 1 | - | 1
| 1 | 1 |
| 19 | Oct 13, 2013 02:36 AM | Us-460 | 1 | 1
| 1 | 1 | - |
| 20 | Oct 26, 2013 01:00 AM | I-64 | 3 | - | 1
| 2 | 1 |
| 21 | Nov 12, 2013 05:01 PM | Sr-165 | 1 | - | 1
| 1 | 1 |
| 22 | Nov 29, 2013 07:05 PM | Sr-168, Greenleaf Dr | 1 | - | 1
| 1 | 1 |
| 23 | Dec 15, 2013 03:14 AM | I-264 | 1 | - | 1
| 2 | - |
| 24 | Dec 18, 2013 02:12 PM | Sr-192, Huette Dr | 3 | - | 1
| 3 | - |
Norfolk fatal car crash and road traffic accident list for 2012
- Fatal accident count18
- Vehicles involved in fatal accidents27
- Fatal accidents involving drunk persons9
- Fatalities18
- Persons involved in fatal accidents27
- Pedestrians involved in fatal accidents5
Average EMS response time
- Norfolk(Based on 3 reports) 6.3 mins
- Norfolk city County(Based on 3 reports) 6.3 mins
- Virginia(Based on 299 reports) 10.7 mins
Daylight
- Norfolk(Based on 18 reports) 55.6%
- Norfolk city County(Based on 18 reports) 55.6%
- Virginia(Based on 713 reports) 51.1%
Dark - Lighted
- Norfolk(Based on 18 reports) 33.3%
- Norfolk city County(Based on 18 reports) 33.3%
- Virginia(Based on 713 reports) 8.3%
Dark - Not Lighted
- Norfolk(Based on 18 reports) 5.6%
- Norfolk city County(Based on 18 reports) 5.6%
- Virginia(Based on 713 reports) 34.8%
Dawn
- Norfolk(Based on 18 reports) 5.6%
- Norfolk city County(Based on 18 reports) 5.6%
- Virginia(Based on 713 reports) 2.7%
Clear
- Norfolk(Based on 18 reports) 100.0%
- Norfolk city County(Based on 18 reports) 100.0%
- Virginia(Based on 714 reports) 87.8%
Unknown
- Norfolk(Based on 18 reports) 100.0%
- Norfolk city County(Based on 18 reports) 100.0%
- Virginia(Based on 714 reports) 88.4%
| # | Date | Location | Vehicles | Drunk persons | Fatalites | Persons | Pedestrians |
|---|
| 1 | Jan 10, 2012 06:01 PM | 200 E Bayview Blvd | 2 | - | 1
| 1 | - |
| 2 | Jan 22, 2012 01:30 PM | I-64 | 3 | - | 1
| 2 | 1 |
| 3 | Feb 18, 2012 11:32 PM | I-64 East | 1 | 1
| 1 | 1 | - |
| 4 | Mar 12, 2012 05:18 AM | Us-166 | 1 | - | 1
| 1 | - |
| 5 | Apr 14, 2012 06:40 PM | Sr-170, Thompson Rd | 4 | 2
| 1 | 4 | - |
| 6 | Apr 15, 2012 11:20 AM | Sr-13, I-64 | 1 | - | 1
| 1 | - |
| 7 | Apr 19, 2012 06:40 PM | I-64 | 2 | 1
| 1 | 2 | - |
| 8 | Jul 7, 2012 08:06 AM | Capeview Ave | 1 | - | 1
| 1 | 1 |
| 9 | May 6, 2012 03:08 PM | Philpotts Rd | 1 | 1
| 1 | 1 | - |
| 10 | Jul 29, 2012 04:40 PM | I-64 West | 1 | - | 1
| 1 | - |
| 11 | Jul 31, 2012 08:05 AM | Sr-165 | 2 | - | 1
| 2 | - |
| 12 | Aug 10, 2012 08:57 PM | Us-58, Godfrey Ave | 1 | 1
| 1 | 2 | - |
| 13 | Sep 4, 2012 12:25 AM | Us-166 | 1 | - | 1
| 1 | 1 |
| 14 | Sep 8, 2012 02:00 AM | Sr-406 | 2 | 1
| 1 | 2 | - |
| 15 | Sep 17, 2012 07:19 PM | I-264w | 1 | - | 1
| 1 | 1 |
| 16 | Sep 20, 2012 02:15 AM | Sr-168 | 1 | 1
| 1 | 1 | - |
| 17 | Sep 19, 2012 08:20 PM | Sr-247, Chesapeake Blvd | 1 | - | 1
| 1 | 1 |
| 18 | Oct 16, 2012 09:39 PM | Sr-165 | 1 | 1
| 1 | 2 | - |
Norfolk fatal car crash and road traffic accident list for 2011
- Fatal accident count14
- Vehicles involved in fatal accidents20
- Fatal accidents involving drunk persons8
- Fatalities17
- Persons involved in fatal accidents23
- Pedestrians involved in fatal accidents2
Dark - Lighted
- Norfolk(Based on 14 reports) 57.1%
- Norfolk city County(Based on 14 reports) 57.1%
- Virginia(Based on 700 reports) 7.7%
Daylight
- Norfolk(Based on 14 reports) 35.7%
- Norfolk city County(Based on 14 reports) 35.7%
- Virginia(Based on 700 reports) 50.9%
Dark - Not Lighted
- Norfolk(Based on 14 reports) 7.1%
- Norfolk city County(Based on 14 reports) 7.1%
- Virginia(Based on 700 reports) 38.7%
Clear
- Norfolk(Based on 14 reports) 92.9%
- Norfolk city County(Based on 14 reports) 92.9%
- Virginia(Based on 700 reports) 90.0%
Rain
- Norfolk(Based on 14 reports) 7.1%
- Norfolk city County(Based on 14 reports) 7.1%
- Virginia(Based on 700 reports) 8.7%
| # | Date | Location | Vehicles | Drunk persons | Fatalites | Persons | Pedestrians |
|---|
| 1 | Mar 7, 2011 06:50 PM | I-264 West | 1 | - | 1
| 1 | 1 |
| 2 | Mar 3, 2011 02:30 AM | Llewellyn Ave | 1 | 1
| 1 | 1 | - |
| 3 | Apr 16, 2011 09:53 PM | I-64 | 1 | 1
| 4 | 4 | - |
| 4 | Apr 28, 2011 03:20 AM | I-64 | 1 | 1
| 1 | 1 | - |
| 5 | Apr 1, 2011 06:05 PM | Suburban Arch, Thole Street | 1 | 1
| 1 | 1 | - |
| 6 | Jun 30, 2011 11:53 PM | I-64 East | 5 | 1
| 1 | 6 | - |
| 7 | Aug 18, 2011 10:30 PM | I-264 | 1 | - | 1
| 1 | - |
| 8 | Aug 31, 2011 08:37 PM | Granby St, W Government Ave | 2 | 2
| 1 | 2 | - |
| 9 | Aug 1, 2011 08:49 AM | Sr-165 | 1 | - | 1
| 1 | - |
| 10 | Sep 6, 2011 03:20 PM | Tidewater Dr | 1 | - | 1
| 1 | - |
| 11 | Sep 25, 2011 00:31 AM | Us-58 | 2 | 1
| 1 | 1 | - |
| 12 | Oct 18, 2011 01:55 PM | Sr-406 | 1 | - | 1
| 1 | - |
| 13 | Nov 25, 2011 05:12 PM | Us-58 | 1 | - | 1
| 1 | 1 |
| 14 | Dec 21, 2011 04:25 PM | Sr-247 | 1 | - | 1
| 1 | - |
Norfolk fatal car crash and road traffic accident list for 2010
- Fatal accident count7
- Vehicles involved in fatal accidents10
- Fatal accidents involving drunk persons4
- Fatalities9
- Persons involved in fatal accidents17
- Pedestrians involved in fatal accidents1
Dark - Lighted
- Norfolk(Based on 7 reports) 71.4%
- Norfolk city County(Based on 7 reports) 71.4%
- Virginia(Based on 689 reports) 9.7%
Daylight
- Norfolk(Based on 7 reports) 14.3%
- Norfolk city County(Based on 7 reports) 14.3%
- Virginia(Based on 689 reports) 47.6%
Dark - Not Lighted
- Norfolk(Based on 7 reports) 14.3%
- Norfolk city County(Based on 7 reports) 14.3%
- Virginia(Based on 689 reports) 38.9%
Clear
- Norfolk(Based on 7 reports) 85.7%
- Norfolk city County(Based on 7 reports) 85.7%
- Virginia(Based on 689 reports) 89.7%
Rain
- Norfolk(Based on 7 reports) 14.3%
- Norfolk city County(Based on 7 reports) 14.3%
- Virginia(Based on 689 reports) 7.3%
Norfolk fatal car crash and road traffic accident list for 2009
- Fatal accident count19
- Vehicles involved in fatal accidents36
- Fatal accidents involving drunk persons8
- Fatalities24
- Persons involved in fatal accidents57
- Pedestrians involved in fatal accidents2
Dark - Not Lighted
- Norfolk(Based on 19 reports) 42.1%
- Norfolk city County(Based on 19 reports) 42.1%
- Virginia(Based on 694 reports) 39.9%
Daylight
- Norfolk(Based on 19 reports) 31.6%
- Norfolk city County(Based on 19 reports) 31.6%
- Virginia(Based on 694 reports) 45.1%
Dark - Lighted
- Norfolk(Based on 19 reports) 26.3%
- Norfolk city County(Based on 19 reports) 26.3%
- Virginia(Based on 694 reports) 10.5%
Clear
- Norfolk(Based on 19 reports) 100.0%
- Norfolk city County(Based on 19 reports) 100.0%
- Virginia(Based on 695 reports) 85.8%
| # | Date | Location | Vehicles | Drunk persons | Fatalites | Persons | Pedestrians |
|---|
| 1 | Jan 5, 2009 08:06 PM | I-64w, Tidewater Dr | 1 | - | 2
| 2 | - |
| 2 | Feb 9, 2009 08:15 AM | Sr-64, 600 Thole St | 2 | - | 1
| 3 | - |
| 3 | Feb 10, 2009 04:35 PM | Us- Ocean View Ave, 9600 Mason Creek Rd | 2 | - | 1
| 3 | - |
| 4 | Feb 16, 2009 10:55 PM | I-64 East, Granby Street | 1 | - | 1
| 4 | - |
| 5 | Feb 20, 2009 10:11 PM | I-64w | 2 | - | 1
| 2 | - |
| 6 | Feb 21, 2009 01:20 AM | Us-13, 1400 Usaa Dr | 2 | 1
| 1 | 4 | - |
| 7 | Mar 7, 2009 07:45 PM | Us-264, 700 Park Ave | 2 | - | 1
| 3 | - |
| 8 | Apr 3, 2009 06:03 PM | Us-60, 16th Bay St | 6 | 1
| 1 | 6 | - |
| 9 | Apr 25, 2009 11:18 AM | Sr-194 | 2 | - | 1
| 2 | - |
| 10 | Jul 5, 2009 04:15 AM | 1500 Helmick St, Eilers Street | 1 | 1
| 2 | 4 | - |
| 11 | Jul 11, 2009 01:50 AM | Sr-165, Johnstons Rd | 2 | 2
| 2 | 4 | - |
| 12 | Jul 25, 2009 02:12 AM | Us-460, Kingsley Lane | 2 | 1
| 2 | 6 | - |
| 13 | Jul 31, 2009 03:00 AM | Sr-40, Ruthven Road | 1 | 1
| 1 | 1 | - |
| 14 | Jun 4, 2009 05:55 AM | Sr-168, 300 New Street | 1 | - | 1
| 2 | 1 |
| 15 | Oct 20, 2009 07:29 PM | Sr-165, 7500 Grnby St | 1 | - | 1
| 2 | 1 |
| 16 | Aug 8, 2009 01:09 AM | 1500 Helmick St, Hampton Blvd | 1 | 1
| 1 | 1 | - |
| 17 | Nov 16, 2009 07:05 PM | Sr-403, Coliss Ave | 2 | - | 1
| 2 | - |
| 18 | Dec 17, 2009 11:50 PM | I-264w | 2 | - | 1
| 3 | - |
| 19 | Dec 30, 2009 01:20 PM | I-264 | 3 | - | 2
| 3 | - |
Norfolk fatal car crash and road traffic accident list for 2008
- Fatal accident count19
- Vehicles involved in fatal accidents32
- Fatal accidents involving drunk persons10
- Fatalities19
- Persons involved in fatal accidents46
- Pedestrians involved in fatal accidents5
Dark - Lighted
- Norfolk(Based on 19 reports) 36.8%
- Norfolk city County(Based on 19 reports) 36.8%
- Virginia(Based on 760 reports) 10.4%
Daylight
- Norfolk(Based on 19 reports) 31.6%
- Norfolk city County(Based on 19 reports) 31.6%
- Virginia(Based on 760 reports) 48.8%
Dark - Not Lighted
- Norfolk(Based on 19 reports) 26.3%
- Norfolk city County(Based on 19 reports) 26.3%
- Virginia(Based on 760 reports) 36.2%
Dawn
- Norfolk(Based on 19 reports) 5.3%
- Norfolk city County(Based on 19 reports) 5.3%
- Virginia(Based on 760 reports) 2.2%
Clear
- Norfolk(Based on 19 reports) 89.5%
- Norfolk city County(Based on 19 reports) 89.5%
- Virginia(Based on 763 reports) 91.3%
Rain
- Norfolk(Based on 19 reports) 5.3%
- Norfolk city County(Based on 19 reports) 5.3%
- Virginia(Based on 763 reports) 7.2%
Fog, Smog, Smoke
- Norfolk(Based on 19 reports) 5.3%
- Norfolk city County(Based on 19 reports) 5.3%
- Virginia(Based on 763 reports) 0.7%
| # | Date | Location | Vehicles | Drunk persons | Fatalites | Persons | Pedestrians |
|---|
| 1 | Jan 12, 2008 00:42 AM | 1700 Berkley Ave | 1 | 1
| 1 | 2 | 1 |
| 2 | Mar 13, 2008 06:40 PM | 1164 Pickett Rd, Marlfield Dr | 1 | - | 1
| 1 | - |
| 3 | Apr 19, 2008 01:35 AM | I-64 | 1 | 1
| 1 | 3 | - |
| 4 | Apr 27, 2008 08:30 AM | Sr-17 | 1 | 1
| 1 | 2 | 1 |
| 5 | Apr 24, 2008 06:22 AM | I-64 | 2 | - | 1
| 2 | - |
| 6 | May 26, 2008 08:29 PM | Us-58 | 1 | 1
| 1 | 1 | - |
| 7 | May 28, 2008 09:02 PM | Sr-166, 2100 Cromwell Rd | 2 | - | 1
| 5 | - |
| 8 | May 1, 2008 01:00 PM | Sr-165 | 2 | - | 1
| 3 | - |
| 9 | Jun 5, 2008 00:39 AM | I-64w | 1 | 1
| 1 | 1 | - |
| 10 | Jun 12, 2008 02:49 AM | Us-58 | 1 | 1
| 1 | 2 | 1 |
| 11 | Jul 23, 2008 10:30 PM | I-64e | 2 | 1
| 1 | 2 | - |
| 12 | Jul 9, 2008 10:24 PM | Sr-649 N Newtown Rd | 3 | - | 1
| 4 | 1 |
| 13 | Aug 2, 2008 09:45 PM | Cape Henry Ave, Hemlock St | 1 | 1
| 1 | 2 | - |
| 14 | Aug 8, 2008 02:31 AM | Us-13 | 2 | 1
| 1 | 2 | 1 |
| 15 | Sep 18, 2008 12:59 AM | 8200 Old Ocean View, 8200 Carrene Dr | 2 | - | 1
| 4 | - |
| 16 | Oct 20, 2008 10:20 PM | 800 37th Street, 3600 Kilam Ave | 2 | - | 1
| 4 | - |
| 17 | Oct 10, 2008 04:15 PM | Sr-247, 3100 Lens Ave | 2 | - | 1
| 2 | - |
| 18 | Oct 30, 2008 01:35 AM | Us-58, 900 Scott St | 2 | 1
| 1 | 2 | - |
| 19 | Nov 22, 2008 07:20 PM | 2400 Colonial Ave, W 25th St | 3 | - | 1
| 2 | - |
Norfolk fatal car crash and road traffic accident list for 2007
- Fatal accident count10
- Vehicles involved in fatal accidents14
- Fatal accidents involving drunk persons4
- Fatalities10
- Persons involved in fatal accidents21
- Pedestrians involved in fatal accidents3
Dark - Lighted
- Norfolk(Based on 10 reports) 60.0%
- Norfolk city County(Based on 10 reports) 60.0%
- Virginia(Based on 940 reports) 11.3%
Daylight
- Norfolk(Based on 10 reports) 40.0%
- Norfolk city County(Based on 10 reports) 40.0%
- Virginia(Based on 940 reports) 51.2%
Clear
- Norfolk(Based on 10 reports) 90.0%
- Norfolk city County(Based on 10 reports) 90.0%
- Virginia(Based on 941 reports) 93.1%
Rain
- Norfolk(Based on 10 reports) 10.0%
- Norfolk city County(Based on 10 reports) 10.0%
- Virginia(Based on 941 reports) 5.2%
| # | Date | Location | Vehicles | Drunk persons | Fatalites | Persons | Pedestrians |
|---|
| 1 | May 12, 2007 12:33 AM | Sr-247, Humbolt St | 2 | - | 1
| 2 | - |
| 2 | May 17, 2007 01:56 AM | I-264e, Military Highway N | 1 | - | 1
| 4 | - |
| 3 | Jun 4, 2007 06:57 PM | Sr-168, Alsace Ave | 1 | 1
| 1 | 1 | - |
| 4 | Jul 19, 2007 00:43 AM | Sr-168, Tidewater Dr | 1 | 1
| 1 | 2 | 1 |
| 5 | Jul 29, 2007 00:04 AM | Us-60, Heutte Dr | 2 | 1
| 1 | 3 | - |
| 6 | Aug 14, 2007 01:50 AM | I-64, Norview Ave | 1 | 1
| 1 | 1 | - |
| 7 | Aug 24, 2007 08:20 PM | Sr-404, Marshall Ave | 1 | - | 1
| 2 | 1 |
| 8 | Aug 20, 2007 09:53 AM | Sr-24, 200 W 27th St | 2 | - | 1
| 2 | - |
| 9 | Sep 25, 2007 05:42 PM | I-264e, I-64 | 2 | - | 1
| 2 | - |
| 10 | Nov 19, 2007 01:32 AM | 2400 Carey Ave, 1300 Herbert Collins | 1 | - | 1
| 2 | 1 |
Norfolk fatal car crash and road traffic accident list for 2006
- Fatal accident count16
- Vehicles involved in fatal accidents24
- Fatal accidents involving drunk persons6
- Fatalities18
- Persons involved in fatal accidents36
- Pedestrians involved in fatal accidents5
Daylight
- Norfolk(Based on 16 reports) 50.0%
- Norfolk city County(Based on 16 reports) 50.0%
- Virginia(Based on 865 reports) 47.7%
Dark - Lighted
- Norfolk(Based on 16 reports) 31.3%
- Norfolk city County(Based on 16 reports) 31.3%
- Virginia(Based on 865 reports) 11.9%
Dark - Not Lighted
- Norfolk(Based on 16 reports) 12.5%
- Norfolk city County(Based on 16 reports) 12.5%
- Virginia(Based on 865 reports) 36.4%
Dawn
- Norfolk(Based on 16 reports) 6.3%
- Norfolk city County(Based on 16 reports) 6.3%
- Virginia(Based on 865 reports) 2.0%
Clear
- Norfolk(Based on 16 reports) 93.8%
- Norfolk city County(Based on 16 reports) 93.8%
- Virginia(Based on 866 reports) 94.5%
Rain
- Norfolk(Based on 16 reports) 6.3%
- Norfolk city County(Based on 16 reports) 6.3%
- Virginia(Based on 866 reports) 4.2%
| # | Date | Location | Vehicles | Drunk persons | Fatalites | Persons | Pedestrians |
|---|
| 1 | Jan 23, 2006 07:44 PM | Sr-168, Vista | 4 | - | 1
| 5 | - |
| 2 | Feb 6, 2006 01:46 AM | Us-460 | 1 | 1
| 1 | 1 | - |
| 3 | Feb 16, 2006 06:45 PM | 1000 W 38th St, Killiam Ave | 2 | - | 1
| 3 | 1 |
| 4 | Feb 25, 2006 03:50 PM | Us-60 | 1 | - | 2
| 3 | - |
| 5 | Feb 25, 2006 00:07 AM | I-264, Kempsville Rd | 2 | 1
| 1 | 2 | - |
| 6 | Jan 12, 2006 01:25 PM | St Pauls Blv | 1 | 1
| 1 | 2 | 1 |
| 7 | May 8, 2006 09:16 PM | Sr-194 | 1 | - | 2
| 3 | - |
| 8 | May 12, 2006 05:35 AM | Sr-15 | 1 | - | 1
| 2 | - |
| 9 | May 22, 2006 07:19 PM | Virginia Beach Blvd | 1 | - | 1
| 1 | - |
| 10 | Jun 27, 2006 02:50 AM | Sr-165 | 1 | - | 1
| 2 | 1 |
| 11 | Sep 2, 2006 03:03 AM | I-264, Tidewater Dr | 1 | 1
| 1 | 1 | - |
| 12 | Oct 3, 2006 06:25 AM | Cape Henry Ave, Rush St | 1 | - | 1
| 2 | 1 |
| 13 | Nov 15, 2006 03:16 PM | Sr-403, Taft St | 1 | 1
| 1 | 2 | 1 |
| 14 | Dec 16, 2006 09:40 PM | I-64, Tidewater Dr | 2 | - | 1
| 2 | - |
| 15 | Dec 8, 2006 10:32 PM | Cromwell Rd | 1 | 1
| 1 | 1 | - |
| 16 | Dec 10, 2006 09:40 AM | I-64w | 3 | - | 1
| 4 | - |
Norfolk fatal car crash and road traffic accident list for 2005
- Fatal accident count14
- Vehicles involved in fatal accidents20
- Fatal accidents involving drunk persons4
- Fatalities14
- Persons involved in fatal accidents31
- Pedestrians involved in fatal accidents5
Dark - Lighted
- Norfolk(Based on 14 reports) 42.9%
- Norfolk city County(Based on 14 reports) 42.9%
- Virginia(Based on 871 reports) 10.8%
Daylight
- Norfolk(Based on 14 reports) 35.7%
- Norfolk city County(Based on 14 reports) 35.7%
- Virginia(Based on 871 reports) 52.5%
Dusk
- Norfolk(Based on 14 reports) 14.3%
- Norfolk city County(Based on 14 reports) 14.3%
- Virginia(Based on 871 reports) 3.1%
Dark - Not Lighted
- Norfolk(Based on 14 reports) 7.1%
- Norfolk city County(Based on 14 reports) 7.1%
- Virginia(Based on 871 reports) 31.7%
Clear
- Norfolk(Based on 14 reports) 100.0%
- Norfolk city County(Based on 14 reports) 100.0%
- Virginia(Based on 876 reports) 92.2%
| # | Date | Location | Vehicles | Drunk persons | Fatalites | Persons | Pedestrians |
|---|
| 1 | Jan 7, 2005 05:05 PM | I-64, Bay Ave | 1 | - | 1
| 4 | - |
| 2 | Jan 13, 2005 08:20 PM | Us-60, Bay St | 1 | - | 1
| 2 | 1 |
| 3 | Apr 9, 2005 05:50 PM | Keene, Dixie | 3 | - | 1
| 2 | - |
| 4 | Apr 30, 2005 02:00 AM | I-264 | 1 | - | 1
| 3 | - |
| 5 | May 9, 2005 01:04 PM | I-264w | 1 | - | 1
| 2 | 1 |
| 6 | May 15, 2005 01:30 PM | 200 W 21 St, 2100 Llewellyn | 2 | - | 1
| 2 | - |
| 7 | Jun 8, 2005 08:10 PM | Us-460, Maple | 1 | 1
| 1 | 2 | 1 |
| 8 | Jul 3, 2005 05:00 PM | Sr-16 | 2 | - | 1
| 4 | - |
| 9 | Aug 6, 2005 11:55 PM | I-64e, Mason Creek Bridge | 1 | 1
| 1 | 2 | - |
| 10 | Aug 25, 2005 07:46 PM | Sr-194 | 1 | - | 1
| 1 | - |
| 11 | Oct 2, 2005 09:10 AM | Norristown Dr | 1 | 1
| 1 | 2 | 1 |
| 12 | Nov 23, 2005 08:49 PM | Military Hwy, I-264 Overpass | 2 | - | 1
| 1 | - |
| 13 | Dec 19, 2005 10:51 PM | Sr-170, Wildwood | 2 | 1
| 1 | 2 | - |
| 14 | Aug 3, 2005 09:40 PM | Us-60, 7th Bay St | 1 | - | 1
| 2 | 1 |
Norfolk fatal car crash and road traffic accident list for 2004
- Fatal accident count12
- Vehicles involved in fatal accidents20
- Fatal accidents involving drunk persons4
- Fatalities13
- Persons involved in fatal accidents24
- Pedestrians involved in fatal accidents2
Daylight
- Norfolk(Based on 12 reports) 50.0%
- Norfolk city County(Based on 12 reports) 50.0%
- Virginia(Based on 837 reports) 51.0%
Dark - Lighted
- Norfolk(Based on 12 reports) 50.0%
- Norfolk city County(Based on 12 reports) 50.0%
- Virginia(Based on 837 reports) 10.6%
Clear
- Norfolk(Based on 12 reports) 83.3%
- Norfolk city County(Based on 12 reports) 83.3%
- Virginia(Based on 838 reports) 88.3%
Rain
- Norfolk(Based on 12 reports) 16.7%
- Norfolk city County(Based on 12 reports) 16.7%
- Virginia(Based on 838 reports) 8.8%
| # | Date | Location | Vehicles | Drunk persons | Fatalites | Persons | Pedestrians |
|---|
| 1 | Mar 9, 2004 04:20 PM | Sr-168 | 2 | - | 1
| 2 | - |
| 2 | Apr 7, 2004 11:40 AM | Us-247, 1sr-247-P | 2 | - | 1
| 3 | - |
| 3 | Apr 30, 2004 00:25 AM | I-64, 4th View | 2 | 1
| 1 | 2 | - |
| 4 | Apr 7, 2004 05:15 PM | I-64 W, Indian River Rd | 2 | - | 1
| 2 | - |
| 5 | May 6, 2004 07:40 PM | Sr-33, Brambleton Ave | 1 | - | 1
| 1 | - |
| 6 | May 14, 2004 07:15 PM | Us-60, 16 Bay St | 3 | 1
| 1 | 3 | - |
| 7 | Jul 3, 2004 07:40 PM | Sr-33, Colley | 1 | - | 1
| 1 | - |
| 8 | Jul 10, 2004 03:09 AM | Sewells Point Rd, E Princess | 1 | - | 2
| 2 | - |
| 9 | Aug 6, 2004 09:35 PM | I-64 | 1 | - | 1
| 2 | 1 |
| 10 | Sep 5, 2004 02:09 AM | Sr-001, Johnstons | 2 | 2
| 1 | 2 | - |
| 11 | Jun 11, 2004 10:00 PM | Us-460 | 2 | - | 1
| 3 | 1 |
| 12 | Dec 1, 2004 09:03 AM | I-64 | 1 | - | 1
| 1 | - |
Norfolk fatal car crash and road traffic accident list for 2003
- Fatal accident count15
- Vehicles involved in fatal accidents20
- Fatal accidents involving drunk persons4
- Fatalities15
- Persons involved in fatal accidents32
- Pedestrians involved in fatal accidents8
Dark - Lighted
- Norfolk(Based on 15 reports) 60.0%
- Norfolk city County(Based on 15 reports) 60.0%
- Virginia(Based on 860 reports) 9.3%
Daylight
- Norfolk(Based on 15 reports) 26.7%
- Norfolk city County(Based on 15 reports) 26.7%
- Virginia(Based on 860 reports) 54.8%
Dark - Not Lighted
- Norfolk(Based on 15 reports) 6.7%
- Norfolk city County(Based on 15 reports) 6.7%
- Virginia(Based on 860 reports) 32.1%
Dusk
- Norfolk(Based on 15 reports) 6.7%
- Norfolk city County(Based on 15 reports) 6.7%
- Virginia(Based on 860 reports) 2.3%
Clear
- Norfolk(Based on 15 reports) 100.0%
- Norfolk city County(Based on 15 reports) 100.0%
- Virginia(Based on 861 reports) 87.6%
| # | Date | Location | Vehicles | Drunk persons | Fatalites | Persons | Pedestrians |
|---|
| 1 | Jan 14, 2003 02:58 AM | Willowwood Drive | 1 | - | 1
| 1 | - |
| 2 | Feb 12, 2003 05:00 PM | Sr-17 | 1 | - | 1
| 2 | 1 |
| 3 | Mar 29, 2003 00:51 AM | Sr-168 | 1 | - | 1
| 5 | 1 |
| 4 | May 30, 2003 03:40 PM | Woodview Dr | 1 | - | 1
| 2 | 1 |
| 5 | May 10, 2003 03:57 AM | I-264 | 1 | 1
| 1 | 1 | - |
| 6 | Jun 12, 2003 03:15 AM | Sr-403 | 1 | - | 1
| 2 | 1 |
| 7 | May 6, 2003 01:20 PM | Sr-165 | 2 | 1
| 1 | 3 | - |
| 8 | Mar 29, 2003 11:43 PM | Dominion | 1 | - | 1
| 2 | 1 |
| 9 | Apr 15, 2003 11:15 PM | Sr-40 | 2 | - | 1
| 2 | - |
| 10 | Sep 14, 2003 07:33 PM | Kingston Ave | 2 | - | 1
| 2 | - |
| 11 | Nov 19, 2003 07:37 PM | Us-58 | 1 | - | 1
| 2 | 1 |
| 12 | Oct 8, 2003 09:45 AM | I-264 | 2 | - | 1
| 2 | - |
| 13 | Sep 22, 2003 08:00 PM | E Princess Anne Rd | 2 | 1
| 1 | 2 | - |
| 14 | Nov 13, 2003 10:04 PM | Sr-165 | 1 | - | 1
| 2 | 1 |
| 15 | Nov 28, 2003 04:51 PM | Sr-194 | 1 | 1
| 1 | 2 | 1 |
Norfolk fatal car crash and road traffic accident list for 2002
- Fatal accident count10
- Vehicles involved in fatal accidents16
- Fatal accidents involving drunk persons4
- Fatalities10
- Persons involved in fatal accidents22
- Pedestrians involved in fatal accidents3
Dark - Lighted
- Norfolk(Based on 10 reports) 60.0%
- Norfolk city County(Based on 10 reports) 60.0%
- Virginia(Based on 829 reports) 11.3%
Daylight
- Norfolk(Based on 10 reports) 40.0%
- Norfolk city County(Based on 10 reports) 40.0%
- Virginia(Based on 829 reports) 48.1%
Clear
- Norfolk(Based on 10 reports) 100.0%
- Norfolk city County(Based on 10 reports) 100.0%
- Virginia(Based on 830 reports) 89.5%
| # | Date | Location | Vehicles | Drunk persons | Fatalites | Persons | Pedestrians |
|---|
| 1 | Jan 4, 2002 09:01 PM | I-64w | 1 | 1
| 1 | 1 | - |
| 2 | Feb 11, 2002 02:15 AM | I-64 | 1 | 1
| 1 | 2 | - |
| 3 | May 14, 2002 01:57 AM | Us-60 | 2 | - | 1
| 2 | - |
| 4 | Jun 25, 2002 01:00 AM | Sr-33 | 1 | - | 1
| 2 | - |
| 5 | Aug 2, 2002 03:36 PM | Sr-168 | 2 | - | 1
| 2 | - |
| 6 | Aug 30, 2002 10:10 AM | I-64 E | 4 | - | 1
| 4 | - |
| 7 | May 21, 2002 07:39 AM | Robin Hood Rd | 1 | 1
| 1 | 2 | 1 |
| 8 | Dec 6, 2002 10:50 PM | I-64 Eb | 1 | 1
| 1 | 2 | - |
| 9 | Aug 16, 2002 02:09 AM | Us-60 | 1 | - | 1
| 2 | 1 |
| 10 | Dec 15, 2002 12:42 AM | Sr-17 | 2 | - | 1
| 3 | 1 |
Norfolk fatal car crash and road traffic accident list for 2001
- Fatal accident count19
- Vehicles involved in fatal accidents32
- Fatal accidents involving drunk persons7
- Fatalities25
- Persons involved in fatal accidents54
- Pedestrians involved in fatal accidents6
Dark - Lighted
- Norfolk(Based on 19 reports) 47.4%
- Norfolk city County(Based on 19 reports) 47.4%
- Virginia(Based on 854 reports) 11.6%
Daylight
- Norfolk(Based on 19 reports) 42.1%
- Norfolk city County(Based on 19 reports) 42.1%
- Virginia(Based on 854 reports) 61.4%
Dark - Not Lighted
- Norfolk(Based on 19 reports) 5.3%
- Norfolk city County(Based on 19 reports) 5.3%
- Virginia(Based on 854 reports) 24.6%
Dusk
- Norfolk(Based on 19 reports) 5.3%
- Norfolk city County(Based on 19 reports) 5.3%
- Virginia(Based on 854 reports) 1.5%
Clear
- Norfolk(Based on 19 reports) 100.0%
- Norfolk city County(Based on 19 reports) 100.0%
- Virginia(Based on 855 reports) 97.0%
| # | Date | Location | Vehicles | Drunk persons | Fatalites | Persons | Pedestrians |
|---|
| 1 | Feb 3, 2001 07:56 PM | Us-60 | 2 | 2
| 2 | 3 | - |
| 2 | Feb 18, 2001 02:23 PM | Us-460 | 1 | - | 1
| 2 | 1 |
| 3 | Mar 12, 2001 06:39 PM | Us-1 | 5 | - | 1
| 7 | - |
| 4 | Mar 22, 2001 08:30 AM | I-64 | 2 | - | 1
| 3 | - |
| 5 | May 1, 2001 11:30 AM | I-64 | 1 | - | 1
| 2 | 1 |
| 6 | May 9, 2001 07:35 PM | I-264 | 1 | - | 1
| 1 | - |
| 7 | May 9, 2001 03:10 AM | I-264eb | 1 | - | 1
| 2 | - |
| 8 | Apr 20, 2001 10:47 PM | Sr-3 | 1 | 1
| 1 | 2 | 1 |
| 9 | Jun 29, 2001 04:11 AM | 2600monticelloave | 2 | - | 1
| 2 | - |
| 10 | Jun 12, 2001 08:54 AM | Us-13 | 1 | - | 1
| 3 | 2 |
| 11 | Jul 14, 2001 08:10 PM | Sr-165 | 3 | - | 1
| 3 | - |
| 12 | Aug 3, 2001 07:30 PM | I-64 | 1 | 1
| 2 | 2 | - |
| 13 | Aug 25, 2001 11:38 AM | 2600azalea | 2 | - | 2
| 2 | - |
| 14 | Sep 21, 2001 06:03 AM | 8500oconnercrescent | 3 | - | 1
| 4 | - |
| 15 | Sep 21, 2001 02:30 PM | Sr-168 | 2 | 1
| 1 | 3 | - |
| 16 | Oct 20, 2001 02:07 AM | Sr-168 | 1 | 1
| 1 | 4 | - |
| 17 | Oct 24, 2001 08:18 PM | Sr-407 | 1 | - | 4
| 5 | - |
| 18 | Dec 12, 2001 09:00 PM | Sr-33 | 1 | 1
| 1 | 2 | - |
| 19 | Dec 3, 2001 06:50 AM | 5801 Curlew Dr | 1 | - | 1
| 2 | 1 |
Norfolk fatal car crash and road traffic accident list for 2000
- Fatal accident count20
- Vehicles involved in fatal accidents31
- Fatal accidents involving drunk persons6
- Fatalities23
- Persons involved in fatal accidents57
- Pedestrians involved in fatal accidents6
Daylight
- Norfolk(Based on 20 reports) 75.0%
- Norfolk city County(Based on 20 reports) 75.0%
- Virginia(Based on 851 reports) 59.1%
Dark - Lighted
- Norfolk(Based on 20 reports) 25.0%
- Norfolk city County(Based on 20 reports) 25.0%
- Virginia(Based on 851 reports) 12.1%
Clear
- Norfolk(Based on 20 reports) 95.0%
- Norfolk city County(Based on 20 reports) 95.0%
- Virginia(Based on 851 reports) 95.2%
Rain
- Norfolk(Based on 20 reports) 5.0%
- Norfolk city County(Based on 20 reports) 5.0%
- Virginia(Based on 851 reports) 3.4%
| # | Date | Location | Vehicles | Drunk persons | Fatalites | Persons | Pedestrians |
|---|
| 1 | Feb 1, 2000 08:50 AM | 2500 Ingleside | 2 | - | 1
| 2 | - |
| 2 | Mar 7, 2000 04:00 PM | Us-60` | 1 | - | 1
| 2 | 1 |
| 3 | Mar 19, 2000 10:55 AM | Sr-165 | 1 | - | 1
| 2 | 1 |
| 4 | Mar 20, 2000 05:35 PM | Sr-194 | 2 | - | 2
| 5 | - |
| 5 | Mar 21, 2000 09:23 PM | 2600azalea | 3 | 3
| 3 | 8 | - |
| 6 | May 1, 2000 03:53 PM | 2700colonialave | 2 | - | 1
| 5 | - |
| 7 | Jun 2, 2000 10:30 PM | I-64 | 1 | - | 1
| 1 | - |
| 8 | Jun 3, 2000 04:20 PM | I-64w | 1 | 1
| 1 | 1 | - |
| 9 | Jun 17, 2000 12:33 AM | I-64 | 3 | - | 1
| 6 | - |
| 10 | Jul 20, 2000 07:07 PM | Sr-17 | 2 | - | 1
| 2 | - |
| 11 | Aug 18, 2000 10:15 AM | I-64w | 1 | - | 1
| 2 | - |
| 12 | Sep 30, 2000 05:05 PM | 2800beechm | 1 | - | 1
| 2 | 1 |
| 13 | Oct 3, 2000 01:55 PM | 5400powhatanave | 1 | - | 1
| 2 | 1 |
| 14 | Oct 6, 2000 09:25 PM | Sr-165 | 1 | 1
| 1 | 3 | - |
| 15 | Oct 28, 2000 11:30 AM | 1500wesleyandr | 2 | - | 1
| 3 | - |
| 16 | Oct 21, 2000 01:40 AM | I-64 | 1 | - | 1
| 2 | 1 |
| 17 | Nov 2, 2000 04:00 PM | Us-165 | 1 | - | 1
| 2 | 1 |
| 18 | Nov 16, 2000 04:00 AM | Us-60 | 1 | - | 1
| 1 | - |
| 19 | Dec 14, 2000 12:35 AM | Sr-19 | 2 | - | 1
| 3 | - |
| 20 | Dec 31, 2000 10:35 PM | Sr-165 | 2 | 1
| 1 | 3 | - |
Norfolk fatal car crash and road traffic accident list for 1999
- Fatal accident count21
- Vehicles involved in fatal accidents30
- Fatal accidents involving drunk persons5
- Fatalities24
- Persons involved in fatal accidents48
- Pedestrians involved in fatal accidents7
Dark - Lighted
- Norfolk(Based on 21 reports) 47.6%
- Norfolk city County(Based on 21 reports) 47.6%
- Virginia(Based on 794 reports) 11.7%
Daylight
- Norfolk(Based on 21 reports) 42.9%
- Norfolk city County(Based on 21 reports) 42.9%
- Virginia(Based on 794 reports) 52.0%
Dark - Not Lighted
- Norfolk(Based on 21 reports) 9.5%
- Norfolk city County(Based on 21 reports) 9.5%
- Virginia(Based on 794 reports) 33.4%
Clear
- Norfolk(Based on 21 reports) 100.0%
- Norfolk city County(Based on 21 reports) 100.0%
- Virginia(Based on 795 reports) 96.7%
| # | Date | Location | Vehicles | Drunk persons | Fatalites | Persons | Pedestrians |
|---|
| 1 | Jan 12, 1999 01:18 PM | Sr-24 | 3 | - | 1
| 3 | - |
| 2 | Feb 17, 1999 02:10 AM | Sr-194 | 1 | 1
| 1 | 3 | - |
| 3 | Feb 22, 1999 11:29 PM | Sr-165 | 1 | - | 1
| 2 | - |
| 4 | Mar 4, 1999 02:45 AM | 1900johnsonave | 1 | 1
| 2 | 2 | - |
| 5 | Mar 4, 1999 10:40 PM | Us- 60 | 1 | - | 1
| 2 | 1 |
| 6 | Mar 19, 1999 07:37 AM | Sr-247 | 2 | - | 1
| 2 | - |
| 7 | Mar 19, 1999 04:26 PM | Sr-247 | 2 | 1
| 1 | 2 | - |
| 8 | Mar 24, 1999 03:20 PM | I-64eb | 2 | - | 1
| 2 | - |
| 9 | May 1, 1999 02:35 AM | I-264e | 1 | - | 1
| 2 | - |
| 10 | May 7, 1999 08:40 PM | 600libertyst | 1 | - | 1
| 2 | 1 |
| 11 | May 28, 1999 01:00 AM | Us-60 | 1 | - | 1
| 2 | 1 |
| 12 | May 1, 1999 10:47 PM | Us-60 | 1 | 1
| 1 | 4 | 3 |
| 13 | Jun 11, 1999 00:57 AM | Sr-165 | 2 | - | 2
| 3 | - |
| 14 | May 8, 1999 04:43 PM | Us-60 | 1 | - | 1
| 2 | 1 |
| 15 | May 20, 1999 11:53 AM | Sr-168 | 2 | - | 1
| 5 | - |
| 16 | Jun 27, 1999 10:21 AM | 150parkave | 1 | - | 1
| 1 | - |
| 17 | May 25, 1999 02:32 AM | I-64 | 2 | - | 1
| 2 | - |
| 18 | Jul 12, 1999 02:15 PM | 6100sunshineave | 1 | - | 2
| 2 | - |
| 19 | Aug 15, 1999 01:40 AM | I-264 | 1 | - | 1
| 2 | - |
| 20 | Sep 26, 1999 04:35 PM | I-64w | 2 | 1
| 1 | 2 | - |
| 21 | Nov 28, 1999 04:55 AM | Us-58 | 1 | - | 1
| 1 | - |
Norfolk fatal car crash and road traffic accident list for 1998
- Fatal accident count20
- Vehicles involved in fatal accidents30
- Fatal accidents involving drunk persons3
- Fatalities20
- Persons involved in fatal accidents52
- Pedestrians involved in fatal accidents5
Daylight
- Norfolk(Based on 20 reports) 50.0%
- Norfolk city County(Based on 20 reports) 50.0%
- Virginia(Based on 832 reports) 56.9%
Dark - Lighted
- Norfolk(Based on 20 reports) 45.0%
- Norfolk city County(Based on 20 reports) 45.0%
- Virginia(Based on 832 reports) 9.5%
Dark - Not Lighted
- Norfolk(Based on 20 reports) 5.0%
- Norfolk city County(Based on 20 reports) 5.0%
- Virginia(Based on 832 reports) 31.4%
Clear
- Norfolk(Based on 20 reports) 100.0%
- Norfolk city County(Based on 20 reports) 100.0%
- Virginia(Based on 834 reports) 96.2%
| # | Date | Location | Vehicles | Drunk persons | Fatalites | Persons | Pedestrians |
|---|
| 1 | Jan 7, 1998 06:55 PM | Sr-2500tidewater | 1 | 1
| 1 | 2 | - |
| 2 | Jan 25, 1998 11:58 AM | Us-13300smilitaryhwy | 4 | - | 1
| 5 | - |
| 3 | Feb 6, 1998 04:41 AM | Us-60 7000shoredr | 2 | - | 1
| 3 | - |
| 4 | Feb 18, 1998 10:35 AM | 800wolneyrd | 2 | - | 1
| 9 | - |
| 5 | Feb 27, 1998 07:20 PM | I-64eb | 1 | - | 1
| 2 | 1 |
| 6 | Apr 6, 1998 08:02 AM | 2800cromwellrd | 1 | - | 1
| 1 | - |
| 7 | Apr 24, 1998 04:35 PM | I-64 | 2 | - | 1
| 5 | - |
| 8 | May 20, 1998 03:24 AM | 1400vinest | 1 | - | 1
| 2 | 1 |
| 9 | May 29, 1998 11:58 AM | Sr-337 | 1 | - | 1
| 1 | - |
| 10 | May 30, 1998 04:05 AM | I-264 | 1 | 1
| 1 | 2 | - |
| 11 | Jun 6, 1998 00:25 AM | Sr-16 | 1 | - | 1
| 2 | 1 |
| 12 | Jun 20, 1998 12:30 AM | I-264 | 1 | - | 1
| 1 | - |
| 13 | Jul 27, 1998 09:48 PM | 400centerdr | 1 | - | 1
| 2 | 1 |
| 14 | Jul 4, 1998 00:25 AM | Us-60 | 1 | 1
| 1 | 2 | - |
| 15 | Nov 5, 1998 11:05 PM | Sr-33 | 3 | - | 1
| 3 | - |
| 16 | Oct 11, 1998 05:30 PM | 9200hickoryst | 1 | - | 1
| 2 | 1 |
| 17 | Oct 19, 1998 10:40 AM | Sr-337 | 1 | - | 1
| 1 | - |
| 18 | Dec 2, 1998 07:26 PM | 700 Ingleside Rd | 1 | - | 1
| 1 | - |
| 19 | Dec 14, 1998 02:22 AM | Us-58 | 2 | - | 1
| 3 | - |
| 20 | Dec 17, 1998 09:40 AM | Us-58 | 2 | - | 1
| 3 | - |
Norfolk fatal car crash and road traffic accident list for 1997
- Fatal accident count25
- Vehicles involved in fatal accidents41
- Fatal accidents involving drunk persons7
- Fatalities27
- Persons involved in fatal accidents62
- Pedestrians involved in fatal accidents6
Daylight
- Norfolk(Based on 25 reports) 60.0%
- Norfolk city County(Based on 25 reports) 60.0%
- Virginia(Based on 900 reports) 54.4%
Dark - Lighted
- Norfolk(Based on 25 reports) 24.0%
- Norfolk city County(Based on 25 reports) 24.0%
- Virginia(Based on 900 reports) 7.3%
Dark - Not Lighted
- Norfolk(Based on 25 reports) 12.0%
- Norfolk city County(Based on 25 reports) 12.0%
- Virginia(Based on 900 reports) 34.8%
Dusk
- Norfolk(Based on 25 reports) 4.0%
- Norfolk city County(Based on 25 reports) 4.0%
- Virginia(Based on 900 reports) 2.2%
Clear
- Norfolk(Based on 25 reports) 100.0%
- Norfolk city County(Based on 25 reports) 100.0%
- Virginia(Based on 900 reports) 93.8%
| # | Date | Location | Vehicles | Drunk persons | Fatalites | Persons | Pedestrians |
|---|
| 1 | Feb 27, 1997 09:57 PM | 8100 Shore | 1 | 1
| 1 | 2 | 1 |
| 2 | Mar 1, 1997 08:55 PM | 2900 E Pri | 1 | - | 1
| 2 | 1 |
| 3 | Mar 5, 1997 11:14 AM | I64 | 3 | - | 1
| 4 | - |
| 4 | Mar 7, 1997 06:41 AM | 8100hampto | 1 | - | 1
| 2 | 1 |
| 5 | Mar 15, 1997 06:25 PM | I64 | 2 | - | 2
| 2 | - |
| 6 | Apr 12, 1997 04:30 PM | 8300granby | 2 | - | 1
| 3 | - |
| 7 | Apr 30, 1997 07:25 AM | 1100wlittl | 1 | - | 1
| 2 | 1 |
| 8 | Apr 12, 1997 11:44 PM | 3800elittl | 2 | - | 1
| 2 | - |
| 9 | May 25, 1997 05:25 AM | Hamptonblb | 1 | 1
| 1 | 1 | - |
| 10 | Jun 24, 1997 03:45 PM | 533thole | 1 | - | 1
| 2 | - |
| 11 | Jun 15, 1997 12:45 AM | 1000elittl | 3 | - | 1
| 4 | - |
| 12 | Jul 18, 1997 01:20 AM | 1500norfol | 3 | 1
| 1 | 3 | - |
| 13 | Aug 17, 1997 02:41 AM | 500int'l | 2 | 1
| 2 | 4 | - |
| 14 | Aug 30, 1997 00:45 AM | 300campost | 2 | 1
| 1 | 2 | - |
| 15 | Aug 27, 1997 04:00 PM | 6453sewell | 2 | - | 1
| 2 | - |
| 16 | Sep 25, 1997 05:29 PM | 500evabeac | 1 | - | 1
| 4 | - |
| 17 | Sep 28, 1997 01:05 PM | 66tidewate | 2 | - | 1
| 2 | - |
| 18 | Sep 25, 1997 10:38 PM | 6200north | 3 | - | 1
| 4 | - |
| 19 | Oct 5, 1997 02:55 AM | I64 | 1 | 1
| 1 | 3 | - |
| 20 | Oct 11, 1997 03:40 PM | 200berkley | 1 | - | 1
| 2 | 1 |
| 21 | Oct 28, 1997 09:30 PM | I64 | 1 | - | 1
| 2 | - |
| 22 | Oct 11, 1997 04:20 AM | Evabeachbl | 1 | 1
| 1 | 1 | - |
| 23 | Nov 15, 1997 10:50 AM | 7200 Blk | 2 | - | 1
| 3 | - |
| 24 | Nov 28, 1997 12:49 AM | I64 | 1 | - | 1
| 2 | - |
| 25 | Dec 4, 1997 06:10 PM | 900scott | 1 | - | 1
| 2 | 1 |
Norfolk fatal car crash and road traffic accident list for 1996
- Fatal accident count17
- Vehicles involved in fatal accidents25
- Fatal accidents involving drunk persons10
- Fatalities17
- Persons involved in fatal accidents35
- Pedestrians involved in fatal accidents6
Dark - Lighted
- Norfolk(Based on 17 reports) 47.1%
- Norfolk city County(Based on 18 reports) 50.0%
- Virginia(Based on 808 reports) 10.1%
Daylight
- Norfolk(Based on 17 reports) 35.3%
- Norfolk city County(Based on 18 reports) 33.3%
- Virginia(Based on 808 reports) 51.5%
Dark - Not Lighted
- Norfolk(Based on 17 reports) 17.6%
- Norfolk city County(Based on 18 reports) 16.7%
- Virginia(Based on 808 reports) 35.1%
Clear
- Norfolk(Based on 17 reports) 82.4%
- Norfolk city County(Based on 18 reports) 83.3%
- Virginia(Based on 809 reports) 90.5%
Rain
- Norfolk(Based on 17 reports) 11.8%
- Norfolk city County(Based on 18 reports) 11.1%
- Virginia(Based on 809 reports) 6.4%
Fog, Smog, Smoke
- Norfolk(Based on 17 reports) 5.9%
- Norfolk city County(Based on 18 reports) 5.6%
- Virginia(Based on 809 reports) 1.4%
| # | Date | Location | Vehicles | Drunk persons | Fatalites | Persons | Pedestrians |
|---|
| 1 | Jan 1, 1996 03:06 AM | I264e | 2 | 1
| 1 | 3 | - |
| 2 | Apr 7, 1996 08:57 PM | Ingleside | 1 | - | 1
| 1 | - |
| 3 | Apr 16, 1996 07:45 PM | 300liberty | 1 | - | 1
| 2 | 1 |
| 4 | May 31, 1996 06:55 PM | I64wb | 1 | - | 1
| 1 | - |
| 5 | Jun 16, 1996 00:20 AM | I564 | 1 | - | 1
| 1 | - |
| 6 | Apr 9, 1996 02:45 AM | I264 | 1 | 1
| 1 | 2 | 1 |
| 7 | Jul 2, 1996 03:45 PM | Tidewater | 1 | - | 1
| 2 | - |
| 8 | Aug 14, 1996 06:39 PM | 7100sewell | 1 | - | 1
| 2 | 1 |
| 9 | Aug 21, 1996 11:43 PM | 3000tidewa | 1 | - | 1
| 3 | 2 |
| 10 | Aug 31, 1996 11:20 PM | Campostell | 2 | 1
| 1 | 2 | - |
| 11 | Oct 5, 1996 03:14 AM | Woodview | 1 | 1
| 1 | 1 | - |
| 12 | Oct 1, 1996 10:09 PM | 8100granby | 1 | 1
| 1 | 2 | 1 |
| 13 | Oct 25, 1996 00:42 AM | 8000hampto | 2 | 2
| 1 | 2 | - |
| 14 | Oct 6, 1996 05:45 PM | 300elittle | 2 | - | 1
| 2 | - |
| 15 | Nov 8, 1996 11:57 PM | 2100eocean | 2 | 2
| 1 | 2 | - |
| 16 | Dec 23, 1996 11:30 PM | 6100azalea | 3 | 1
| 1 | 5 | - |
| 17 | Aug 25, 1996 11:40 AM | 7500tidewa | 2 | - | 1
| 2 | - |
Norfolk fatal car crash and road traffic accident list for 1995
- Fatal accident count21
- Vehicles involved in fatal accidents26
- Fatal accidents involving drunk persons5
- Fatalities23
- Persons involved in fatal accidents45
- Pedestrians involved in fatal accidents9
Dark - Lighted
- Norfolk(Based on 21 reports) 57.1%
- Norfolk city County(Based on 22 reports) 54.5%
- Virginia(Based on 824 reports) 8.5%
Daylight
- Norfolk(Based on 21 reports) 33.3%
- Norfolk city County(Based on 22 reports) 36.4%
- Virginia(Based on 824 reports) 50.7%
Dark - Not Lighted
- Norfolk(Based on 21 reports) 9.5%
- Norfolk city County(Based on 22 reports) 9.1%
- Virginia(Based on 824 reports) 37.3%
Clear
- Norfolk(Based on 21 reports) 95.2%
- Norfolk city County(Based on 22 reports) 95.5%
- Virginia(Based on 826 reports) 90.4%
Rain
- Norfolk(Based on 21 reports) 4.8%
- Norfolk city County(Based on 22 reports) 4.5%
- Virginia(Based on 826 reports) 6.4%
| # | Date | Location | Vehicles | Drunk persons | Fatalites | Persons | Pedestrians |
|---|
| 1 | Jan 1, 1995 00:18 AM | 7600sewell | 1 | - | 1
| 2 | 1 |
| 2 | Jan 13, 1995 08:52 PM | Sewellpoin | 1 | - | 1
| 3 | 2 |
| 3 | Jan 21, 1995 11:28 PM | 200wbrambl | 2 | 1
| 2 | 3 | - |
| 4 | Feb 2, 1995 00:13 AM | Chesapeake | 1 | 1
| 1 | 1 | - |
| 5 | Feb 9, 1995 04:15 PM | 7900ocean | 2 | - | 1
| 3 | - |
| 6 | Mar 1, 1995 09:55 PM | I64wb | 1 | 1
| 1 | 3 | - |
| 7 | Mar 26, 1995 01:10 AM | I64w | 1 | - | 1
| 1 | - |
| 8 | Apr 3, 1995 01:56 PM | 1200nmilit | 1 | - | 1
| 2 | 1 |
| 9 | Apr 13, 1995 09:10 PM | 800nmilita | 1 | - | 1
| 2 | 1 |
| 10 | Jun 12, 1995 08:20 AM | 5900hampto | 2 | - | 1
| 2 | - |
| 11 | Jun 11, 1995 05:15 AM | 1718lafaye | 1 | - | 1
| 1 | - |
| 12 | Aug 19, 1995 04:30 PM | I64 | 1 | 1
| 2 | 2 | - |
| 13 | Sep 20, 1995 10:45 PM | 300ocean | 1 | - | 1
| 2 | 1 |
| 14 | Sep 12, 1995 04:45 PM | 3400tidewa | 2 | - | 1
| 3 | - |
| 15 | Oct 13, 1995 08:10 PM | 3800 | 2 | - | 1
| 3 | - |
| 16 | Oct 22, 1995 08:34 PM | Tidewater | 1 | - | 1
| 2 | 1 |
| 17 | Oct 25, 1995 02:10 AM | 3600 Blk | 1 | 1
| 1 | 2 | - |
| 18 | Nov 2, 1995 10:15 PM | I64n | 1 | - | 1
| 3 | - |
| 19 | Nov 2, 1995 00:43 AM | 95001stvie | 1 | - | 1
| 2 | 1 |
| 20 | Nov 9, 1995 08:05 AM | Granbyst | 1 | - | 1
| 1 | - |
| 21 | Dec 19, 1995 05:45 AM | I564w | 1 | - | 1
| 2 | 1 |
Norfolk fatal car crash and road traffic accident list for 1994
- Fatal accident count18
- Vehicles involved in fatal accidents29
- Fatal accidents involving drunk persons10
- Fatalities20
- Persons involved in fatal accidents51
- Pedestrians involved in fatal accidents10
Dark - Lighted
- Norfolk(Based on 18 reports) 55.6%
- Norfolk city County(Based on 18 reports) 55.6%
- Virginia(Based on 824 reports) 9.3%
Daylight
- Norfolk(Based on 18 reports) 27.8%
- Norfolk city County(Based on 18 reports) 27.8%
- Virginia(Based on 824 reports) 55.0%
Dark - Not Lighted
- Norfolk(Based on 18 reports) 16.7%
- Norfolk city County(Based on 18 reports) 16.7%
- Virginia(Based on 824 reports) 32.8%
Clear
- Norfolk(Based on 18 reports) 100.0%
- Norfolk city County(Based on 18 reports) 100.0%
- Virginia(Based on 828 reports) 90.0%
| # | Date | Location | Vehicles | Drunk persons | Fatalites | Persons | Pedestrians |
|---|
| 1 | Mar 24, 1994 01:10 AM | Rt44w | 2 | - | 1
| 2 | - |
| 2 | Apr 2, 1994 02:25 AM | 1700granby | 1 | - | 1
| 4 | - |
| 3 | Apr 8, 1994 02:00 AM | I264 | 1 | - | 1
| 2 | - |
| 4 | May 19, 1994 01:27 AM | Waterside | 1 | 1
| 1 | 2 | - |
| 5 | Jun 19, 1994 03:34 PM | 6500tidewa | 1 | - | 1
| 2 | - |
| 6 | Jul 15, 1994 06:45 PM | Widgeonrd | 1 | - | 1
| 2 | 1 |
| 7 | Jul 23, 1994 11:10 PM | 6900granby | 3 | 1
| 1 | 5 | - |
| 8 | Jul 28, 1994 05:19 AM | I64eb | 1 | 1
| 1 | 2 | 1 |
| 9 | Aug 1, 1994 07:45 AM | I564w | 3 | - | 3
| 7 | 3 |
| 10 | Aug 25, 1994 02:40 AM | I264wb | 3 | 2
| 1 | 3 | 1 |
| 11 | Aug 29, 1994 04:28 AM | I564e | 1 | 1
| 1 | 1 | - |
| 12 | Sep 20, 1994 09:20 PM | 6600chesap | 2 | - | 1
| 4 | - |
| 13 | Dec 15, 1994 10:30 PM | I64 | 3 | 1
| 1 | 4 | - |
| 14 | Feb 12, 1994 10:43 PM | Tidewater | 2 | 1
| 1 | 3 | 1 |
| 15 | Dec 12, 1994 11:25 PM | Nmilitary | 1 | - | 1
| 2 | 1 |
| 16 | Dec 2, 1994 06:40 PM | I64e | 1 | - | 1
| 2 | 1 |
| 17 | Nov 6, 1994 01:55 AM | I264w | 1 | 1
| 1 | 3 | 1 |
| 18 | May 30, 1994 05:20 PM | 800church | 1 | 1
| 1 | 1 | - |
Norfolk fatal car crash and road traffic accident list for 1993
- Fatal accident count24
- Vehicles involved in fatal accidents32
- Fatal accidents involving drunk persons10
- Fatalities26
- Persons involved in fatal accidents46
- Pedestrians involved in fatal accidents6
Daylight
- Norfolk(Based on 24 reports) 41.7%
- Norfolk city County(Based on 24 reports) 41.7%
- Virginia(Based on 791 reports) 50.2%
Dark - Lighted
- Norfolk(Based on 24 reports) 41.7%
- Norfolk city County(Based on 24 reports) 41.7%
- Virginia(Based on 791 reports) 12.8%
Dark - Not Lighted
- Norfolk(Based on 24 reports) 12.5%
- Norfolk city County(Based on 24 reports) 12.5%
- Virginia(Based on 791 reports) 34.5%
Dusk
- Norfolk(Based on 24 reports) 4.2%
- Norfolk city County(Based on 24 reports) 4.2%
- Virginia(Based on 791 reports) 1.8%
Clear
- Norfolk(Based on 24 reports) 91.7%
- Norfolk city County(Based on 24 reports) 91.7%
- Virginia(Based on 793 reports) 88.1%
Rain
- Norfolk(Based on 24 reports) 8.3%
- Norfolk city County(Based on 24 reports) 8.3%
- Virginia(Based on 793 reports) 8.6%
| # | Date | Location | Vehicles | Drunk persons | Fatalites | Persons | Pedestrians |
|---|
| 1 | Jan 30, 1993 05:28 PM | 5ootermina | 1 | - | 1
| 1 | - |
| 2 | Feb 20, 1993 04:00 AM | I64e | 1 | - | 1
| 1 | - |
| 3 | Mar 12, 1993 04:55 AM | I264 | 2 | 1
| 2 | 2 | - |
| 4 | Mar 25, 1993 05:16 PM | Granbyst | 1 | - | 1
| 1 | - |
| 5 | Apr 5, 1993 04:20 AM | I564wb | 2 | 1
| 1 | 2 | - |
| 6 | May 17, 1993 03:15 PM | I64e | 1 | - | 1
| 2 | - |
| 7 | May 19, 1993 02:55 AM | Eprinanne | 2 | 2
| 1 | 2 | - |
| 8 | May 25, 1993 02:15 AM | Tidewater | 2 | 1
| 1 | 2 | - |
| 9 | Jun 2, 1993 05:50 PM | I264wb | 1 | - | 1
| 1 | - |
| 10 | Jul 12, 1993 02:10 PM | I264 | 1 | 1
| 1 | 3 | - |
| 11 | Jul 14, 1993 12:20 AM | Kempsvile | 1 | - | 1
| 2 | 1 |
| 12 | Jul 15, 1993 01:15 AM | Chesapeake | 1 | - | 1
| 1 | - |
| 13 | Sep 7, 1993 03:30 AM | Tidewater | 1 | 1
| 2 | 2 | - |
| 14 | Sep 7, 1993 09:05 PM | Oceanview | 2 | - | 1
| 3 | 1 |
| 15 | Sep 17, 1993 06:45 PM | 700ocean | 1 | 1
| 1 | 2 | 1 |
| 16 | Oct 2, 1993 01:45 AM | I64e | 3 | - | 1
| 5 | - |
| 17 | Oct 1, 1993 07:05 AM | Shoredr | 1 | 1
| 1 | 2 | 1 |
| 18 | Oct 7, 1993 01:34 AM | Ingleside | 1 | - | 1
| 1 | - |
| 19 | Oct 18, 1993 08:10 AM | I64wb | 1 | - | 1
| 1 | - |
| 20 | Oct 21, 1993 03:05 PM | 800eramble | 1 | - | 1
| 2 | 1 |
| 21 | Nov 12, 1993 07:10 AM | I64wb | 1 | - | 1
| 1 | - |
| 22 | Nov 18, 1993 11:40 PM | I64w | 2 | 1
| 1 | 4 | - |
| 23 | Dec 18, 1993 07:05 PM | I264e | 1 | - | 1
| 1 | - |
| 24 | Dec 6, 1993 12:38 AM | 700elittle | 1 | - | 1
| 2 | 1 |
Norfolk fatal car crash and road traffic accident list for 1992
- Fatal accident count23
- Vehicles involved in fatal accidents29
- Fatal accidents involving drunk persons8
- Fatalities24
- Persons involved in fatal accidents47
- Pedestrians involved in fatal accidents8
Daylight
- Norfolk(Based on 23 reports) 47.8%
- Norfolk city County(Based on 23 reports) 47.8%
- Virginia(Based on 759 reports) 48.6%
Dark - Lighted
- Norfolk(Based on 23 reports) 47.8%
- Norfolk city County(Based on 23 reports) 47.8%
- Virginia(Based on 759 reports) 12.1%
Dark - Not Lighted
- Norfolk(Based on 23 reports) 4.3%
- Norfolk city County(Based on 23 reports) 4.3%
- Virginia(Based on 759 reports) 37.5%
Clear
- Norfolk(Based on 23 reports) 87.0%
- Norfolk city County(Based on 23 reports) 87.0%
- Virginia(Based on 760 reports) 85.1%
Rain
- Norfolk(Based on 23 reports) 4.3%
- Norfolk city County(Based on 23 reports) 4.3%
- Virginia(Based on 760 reports) 12.4%
Sleet or Hail
- Norfolk(Based on 23 reports) 4.3%
- Norfolk city County(Based on 23 reports) 4.3%
- Virginia(Based on 760 reports) 0.1%
Fog, Smog, Smoke
- Norfolk(Based on 23 reports) 4.3%
- Norfolk city County(Based on 23 reports) 4.3%
- Virginia(Based on 760 reports) 1.7%
| # | Date | Location | Vehicles | Drunk persons | Fatalites | Persons | Pedestrians |
|---|
| 1 | Jan 14, 1992 06:25 AM | Eoceanview | 1 | - | 1
| 2 | 1 |
| 2 | Jan 19, 1992 02:25 AM | Chespblvd | 1 | 1
| 2 | 3 | - |
| 3 | Feb 2, 1992 11:25 AM | Tidewater | 1 | - | 1
| 1 | - |
| 4 | Feb 5, 1992 09:55 AM | I64e | 2 | - | 1
| 3 | - |
| 5 | Feb 12, 1992 12:23 AM | Tidewater | 1 | - | 1
| 2 | 1 |
| 6 | Feb 23, 1992 05:20 AM | Tidewater | 1 | 1
| 1 | 2 | - |
| 7 | Feb 28, 1992 01:55 AM | Nmilitary | 1 | 1
| 1 | 2 | 1 |
| 8 | Mar 17, 1992 03:04 PM | Littlecrek | 2 | - | 1
| 4 | - |
| 9 | Mar 20, 1992 02:05 AM | Hamptonblv | 1 | 1
| 1 | 1 | - |
| 10 | Mar 23, 1992 05:55 AM | Tidewater | 2 | - | 1
| 2 | - |
| 11 | Apr 3, 1992 02:24 AM | Lindenwood | 2 | - | 1
| 3 | - |
| 12 | Apr 9, 1992 10:35 AM | West21stst | 1 | - | 1
| 2 | 1 |
| 13 | Apr 18, 1992 06:30 PM | Hiltonst | 1 | - | 1
| 2 | - |
| 14 | May 3, 1992 04:40 PM | I64 | 1 | 1
| 1 | 1 | - |
| 15 | May 18, 1992 12:30 AM | Lafayette | 1 | - | 1
| 2 | 1 |
| 16 | May 15, 1992 05:30 PM | Robinhood | 2 | 1
| 1 | 3 | - |
| 17 | Aug 31, 1992 09:20 PM | Wlittlecrk | 2 | - | 1
| 3 | 1 |
| 18 | Sep 11, 1992 00:15 AM | I264e | 1 | - | 1
| 1 | - |
| 19 | Sep 12, 1992 05:20 AM | Tidewater | 1 | 1
| 1 | 2 | - |
| 20 | Sep 12, 1992 08:49 AM | Lafayette | 1 | - | 1
| 1 | - |
| 21 | Oct 27, 1992 00:25 AM | Oceanview | 1 | - | 1
| 2 | 1 |
| 22 | Nov 1, 1992 02:15 AM | Shoredrive | 1 | 1
| 1 | 1 | - |
| 23 | Dec 31, 1992 06:45 PM | Ruthvenrd | 1 | - | 1
| 2 | 1 |
Norfolk fatal car crash and road traffic accident list for 1991
- Fatal accident count24
- Vehicles involved in fatal accidents35
- Fatal accidents involving drunk persons14
- Fatalities26
- Persons involved in fatal accidents59
- Pedestrians involved in fatal accidents10
Dark - Lighted
- Norfolk(Based on 24 reports) 58.3%
- Norfolk city County(Based on 24 reports) 58.3%
- Virginia(Based on 843 reports) 11.4%
Daylight
- Norfolk(Based on 24 reports) 41.7%
- Norfolk city County(Based on 24 reports) 41.7%
- Virginia(Based on 843 reports) 48.3%
Clear
- Norfolk(Based on 24 reports) 83.3%
- Norfolk city County(Based on 24 reports) 83.3%
- Virginia(Based on 845 reports) 89.9%
Rain
- Norfolk(Based on 24 reports) 16.7%
- Norfolk city County(Based on 24 reports) 16.7%
- Virginia(Based on 845 reports) 8.3%
| # | Date | Location | Vehicles | Drunk persons | Fatalites | Persons | Pedestrians |
|---|
| 1 | Jan 4, 1991 11:25 PM | Intltermin | 2 | 1
| 1 | 2 | - |
| 2 | Jan 23, 1991 09:08 PM | Nmilitary | 2 | 2
| 2 | 2 | - |
| 3 | Feb 2, 1991 06:50 PM | Eoceanview | 1 | - | 1
| 3 | 1 |
| 4 | Mar 6, 1991 09:32 PM | Hampton | 2 | 1
| 1 | 2 | - |
| 5 | Apr 5, 1991 01:40 AM | W43rdst | 1 | 1
| 1 | 6 | - |
| 6 | Apr 9, 1991 02:21 AM | Granbyst | 1 | 1
| 1 | 1 | - |
| 7 | May 26, 1991 05:40 PM | Wbrambleto | 2 | - | 1
| 3 | - |
| 8 | Jun 10, 1991 11:20 AM | W21st | 1 | - | 1
| 2 | 1 |
| 9 | Jun 12, 1991 07:55 PM | Warwickave | 1 | 1
| 1 | 2 | 1 |
| 10 | Jun 23, 1991 00:10 AM | Mayflower | 1 | 1
| 1 | 2 | - |
| 11 | Jun 29, 1991 01:50 AM | Eoceanview | 1 | 1
| 1 | 3 | 2 |
| 12 | Jun 1, 1991 10:40 AM | Hampton | 2 | - | 1
| 2 | - |
| 13 | Jul 2, 1991 09:40 PM | Tidewater | 1 | - | 1
| 2 | 1 |
| 14 | Jul 8, 1991 09:30 PM | Sewellspt | 1 | - | 1
| 3 | 1 |
| 15 | Jul 22, 1991 01:33 AM | Eoceanview | 2 | 1
| 1 | 2 | - |
| 16 | Jul 25, 1991 02:20 AM | Princess | 1 | 1
| 1 | 1 | - |
| 17 | Jul 27, 1991 01:20 AM | Tidewater | 2 | 1
| 1 | 3 | - |
| 18 | Jul 27, 1991 03:45 PM | Oldocean | 1 | - | 1
| 2 | 1 |
| 19 | Sep 2, 1991 06:30 AM | Tidewater | 1 | - | 1
| 4 | - |
| 20 | Sep 6, 1991 03:25 PM | Rt165 | 2 | - | 1
| 3 | 1 |
| 21 | Sep 19, 1991 02:30 PM | Rt168 | 2 | 1
| 1 | 2 | - |
| 22 | Oct 6, 1991 02:30 AM | Parkview | 1 | 1
| 2 | 2 | 1 |
| 23 | Oct 17, 1991 09:45 AM | Rt337 | 1 | - | 1
| 1 | - |
| 24 | Jul 20, 1991 11:25 AM | Rt194 | 3 | - | 1
| 4 | - |
Norfolk fatal car crash and road traffic accident list for 1990
- Fatal accident count33
- Vehicles involved in fatal accidents60
- Fatal accidents involving drunk persons15
- Fatalities35
- Persons involved in fatal accidents104
Dark - Lighted
- Norfolk(Based on 33 reports) 60.6%
- Norfolk city County(Based on 33 reports) 60.6%
- Virginia(Based on 951 reports) 13.7%
Daylight
- Norfolk(Based on 33 reports) 30.3%
- Norfolk city County(Based on 33 reports) 30.3%
- Virginia(Based on 951 reports) 47.2%
Dark - Not Lighted
- Norfolk(Based on 33 reports) 9.1%
- Norfolk city County(Based on 33 reports) 9.1%
- Virginia(Based on 951 reports) 37.4%
Clear
- Norfolk(Based on 33 reports) 84.8%
- Norfolk city County(Based on 33 reports) 84.8%
- Virginia(Based on 953 reports) 86.1%
Rain
- Norfolk(Based on 33 reports) 15.2%
- Norfolk city County(Based on 33 reports) 15.2%
- Virginia(Based on 953 reports) 11.3%
| # | Date | Location | Vehicles | Drunk persons | Fatalites | Persons | Pedestrians |
|---|
| 1 | Jan 3, 1990 06:40 AM | Nmilitary | 1 | - | 1
| 1 | - |
| 2 | Jan 15, 1990 03:20 AM | C Avenue | 1 | - | 1
| 2 | - |
| 3 | Jan 29, 1990 10:30 PM | Rt460 | 2 | - | 1
| 2 | - |
| 4 | Feb 4, 1990 03:55 AM | I264wb | 2 | 2
| 1 | 3 | - |
| 5 | Jan 22, 1990 05:45 PM | Chesapeake | 1 | - | 1
| 2 | - |
| 6 | Mar 4, 1990 07:40 PM | Brambleton | 1 | 1
| 1 | 4 | - |
| 7 | Apr 15, 1990 02:00 PM | Tidewater | 2 | - | 1
| 3 | - |
| 8 | Apr 19, 1990 02:15 AM | Northampto | 2 | 1
| 1 | 5 | - |
| 9 | May 18, 1990 11:15 PM | Littlecrk | 2 | 2
| 1 | 5 | - |
| 10 | May 28, 1990 03:00 AM | I64e | 1 | - | 2
| 6 | - |
| 11 | May 23, 1990 11:04 PM | Shoredrive | 2 | - | 1
| 4 | - |
| 12 | May 24, 1990 01:05 AM | Chesapeake | 1 | - | 1
| 2 | - |
| 13 | May 26, 1990 11:40 PM | 6300merle | 1 | - | 1
| 1 | - |
| 14 | Jun 15, 1990 05:35 PM | I264w | 3 | - | 1
| 6 | - |
| 15 | Jul 9, 1990 08:50 AM | I264eb | 1 | - | 1
| 2 | - |
| 16 | Jul 10, 1990 11:20 PM | Wornocaave | 1 | 1
| 1 | 2 | - |
| 17 | Jul 17, 1990 06:50 AM | I64w | 2 | - | 1
| 2 | - |
| 18 | Aug 2, 1990 11:15 PM | Terminal | 1 | 1
| 1 | 2 | - |
| 19 | Aug 3, 1990 01:20 PM | I64w | 9 | - | 1
| 15 | - |
| 20 | Aug 7, 1990 02:10 PM | Evabeach | 2 | 1
| 2 | 4 | - |
| 21 | Aug 14, 1990 02:30 AM | I564 | 2 | - | 1
| 2 | - |
| 22 | Aug 18, 1990 06:15 AM | I64e | 1 | - | 1
| 1 | - |
| 23 | Sep 4, 1990 11:44 PM | I264e | 2 | 1
| 1 | 2 | - |
| 24 | Sep 5, 1990 00:29 AM | I264e | 2 | 1
| 1 | 2 | - |
| 25 | Sep 4, 1990 01:55 AM | Stpaulblvd | 3 | 1
| 1 | 5 | - |
| 26 | Oct 9, 1990 12:05 AM | I64w | 2 | 1
| 1 | 2 | - |
| 27 | Oct 13, 1990 06:20 AM | I64e | 1 | - | 1
| 2 | - |
| 28 | Oct 15, 1990 10:45 AM | Littlecrk | 1 | - | 1
| 2 | - |
| 29 | Oct 18, 1990 07:55 PM | Oceanview | 1 | - | 1
| 2 | - |
| 30 | Oct 21, 1990 05:35 AM | Eoceanview | 1 | - | 1
| 3 | - |
| 31 | Oct 20, 1990 03:25 PM | Cromwellrd | 2 | 1
| 1 | 2 | - |
| 32 | Oct 29, 1990 06:35 PM | Hampton | 3 | 1
| 1 | 4 | - |
| 33 | Nov 2, 1990 10:15 AM | Campostell | 1 | - | 1
| 2 | - |
Norfolk fatal car crash and road traffic accident list for 1989
- Fatal accident count19
- Vehicles involved in fatal accidents28
- Fatal accidents involving drunk persons8
- Fatalities21
- Persons involved in fatal accidents56
Dark - Lighted
- Norfolk(Based on 19 reports) 63.2%
- Norfolk city County(Based on 19 reports) 63.2%
- Virginia(Based on 915 reports) 12.8%
Daylight
- Norfolk(Based on 19 reports) 31.6%
- Norfolk city County(Based on 19 reports) 31.6%
- Virginia(Based on 915 reports) 45.8%
Dark - Not Lighted
- Norfolk(Based on 19 reports) 5.3%
- Norfolk city County(Based on 19 reports) 5.3%
- Virginia(Based on 915 reports) 38.6%
Clear
- Norfolk(Based on 19 reports) 73.7%
- Norfolk city County(Based on 19 reports) 73.7%
- Virginia(Based on 918 reports) 84.1%
Rain
- Norfolk(Based on 19 reports) 21.1%
- Norfolk city County(Based on 19 reports) 21.1%
- Virginia(Based on 918 reports) 13.1%
Sleet or Hail
- Norfolk(Based on 19 reports) 5.3%
- Norfolk city County(Based on 19 reports) 5.3%
- Virginia(Based on 918 reports) 0.9%
| # | Date | Location | Vehicles | Drunk persons | Fatalites | Persons | Pedestrians |
|---|
| 1 | Jan 5, 1989 04:00 PM | Monticell0 | 1 | - | 1
| 2 | - |
| 2 | Jan 13, 1989 06:50 PM | Newtown Rd | 1 | - | 1
| 2 | - |
| 3 | Feb 28, 1989 05:20 AM | Tidewater | 1 | - | 1
| 2 | - |
| 4 | Mar 7, 1989 10:30 PM | I64e | 1 | - | 1
| 1 | - |
| 5 | Mar 9, 1989 09:49 PM | Granbyst | 1 | 1
| 1 | 2 | - |
| 6 | Apr 21, 1989 09:40 PM | I264eb | 1 | - | 1
| 4 | - |
| 7 | May 8, 1989 04:10 PM | Wbrambleto | 1 | - | 1
| 2 | - |
| 8 | May 17, 1989 04:20 PM | Granbyst | 1 | - | 1
| 2 | - |
| 9 | Jun 4, 1989 00:14 AM | 460alt | 4 | 1
| 1 | 10 | - |
| 10 | Aug 2, 1989 02:35 PM | Chesapeake | 2 | 1
| 1 | 5 | - |
| 11 | Sep 3, 1989 09:40 PM | Auburnave | 1 | - | 1
| 3 | - |
| 12 | Sep 16, 1989 07:10 AM | 460 | 2 | - | 1
| 2 | - |
| 13 | Sep 21, 1989 01:38 AM | I264wb | 1 | 1
| 1 | 1 | - |
| 14 | Sep 28, 1989 03:50 AM | I64 | 1 | - | 1
| 4 | - |
| 15 | Oct 1, 1989 00:15 AM | Hampton | 2 | 1
| 1 | 2 | - |
| 16 | Oct 1, 1989 02:20 AM | Colleyave | 1 | - | 1
| 3 | - |
| 17 | Oct 5, 1989 10:30 PM | I264w | 2 | 2
| 2 | 3 | - |
| 18 | Oct 21, 1989 02:10 AM | I64eb | 2 | 1
| 2 | 3 | - |
| 19 | Dec 23, 1989 04:35 PM | Capehenry | 2 | - | 1
| 3 | - |
Norfolk fatal car crash and road traffic accident list for 1988
- Fatal accident count33
- Vehicles involved in fatal accidents47
- Fatal accidents involving drunk persons18
- Fatalities37
- Persons involved in fatal accidents72
Dark - Lighted
- Norfolk(Based on 33 reports) 57.6%
- Norfolk city County(Based on 33 reports) 57.6%
- Virginia(Based on 970 reports) 13.5%
Daylight
- Norfolk(Based on 33 reports) 30.3%
- Norfolk city County(Based on 33 reports) 30.3%
- Virginia(Based on 970 reports) 48.2%
Dark - Not Lighted
- Norfolk(Based on 33 reports) 9.1%
- Norfolk city County(Based on 33 reports) 9.1%
- Virginia(Based on 970 reports) 35.9%
Dawn
- Norfolk(Based on 33 reports) 3.0%
- Norfolk city County(Based on 33 reports) 3.0%
- Virginia(Based on 970 reports) 0.3%
Clear
- Norfolk(Based on 33 reports) 90.9%
- Norfolk city County(Based on 33 reports) 90.9%
- Virginia(Based on 971 reports) 86.0%
Rain
- Norfolk(Based on 33 reports) 9.1%
- Norfolk city County(Based on 33 reports) 9.1%
- Virginia(Based on 971 reports) 11.3%
| # | Date | Location | Vehicles | Drunk persons | Fatalites | Persons | Pedestrians |
|---|
| 1 | Jan 1, 1988 05:45 PM | Princessan | 1 | - | 1
| 2 | - |
| 2 | Jan 24, 1988 01:45 AM | Shore Dr | 1 | 1
| 1 | 3 | - |
| 3 | Jan 24, 1988 01:30 AM | 64 | 1 | 1
| 1 | 2 | - |
| 4 | Feb 8, 1988 04:15 AM | Elittlecrk | 1 | 1
| 1 | 2 | - |
| 5 | Feb 21, 1988 07:44 PM | 168 | 2 | 1
| 1 | 2 | - |
| 6 | Mar 5, 1988 08:15 PM | 264 | 2 | - | 5
| 6 | - |
| 7 | Apr 5, 1988 01:45 PM | N Militaty | 2 | - | 1
| 3 | - |
| 8 | Apr 15, 1988 11:55 AM | Vabeachblv | 2 | - | 1
| 4 | - |
| 9 | May 5, 1988 06:45 PM | 264 | 1 | - | 1
| 1 | - |
| 10 | May 9, 1988 08:30 PM | 44 | 2 | 1
| 1 | 2 | - |
| 11 | May 12, 1988 03:10 PM | Tidewater | 1 | - | 1
| 2 | - |
| 12 | May 28, 1988 10:00 PM | Litcreekrd | 2 | - | 1
| 2 | - |
| 13 | May 29, 1988 11:13 AM | Tidewater | 1 | - | 1
| 2 | - |
| 14 | Jul 3, 1988 02:30 AM | Tidewater | 2 | 1
| 1 | 2 | - |
| 15 | Jun 24, 1988 10:00 PM | 64 | 2 | - | 1
| 2 | - |
| 16 | Aug 6, 1988 12:25 AM | I264eb | 2 | 2
| 1 | 2 | - |
| 17 | Aug 11, 1988 01:35 AM | I64e | 1 | 1
| 1 | 1 | - |
| 18 | Aug 13, 1988 05:55 AM | Sewells Pt | 1 | 1
| 1 | 1 | - |
| 19 | Sep 2, 1988 01:00 AM | Shore Dr | 2 | 2
| 1 | 2 | - |
| 20 | Sep 3, 1988 03:50 PM | Tidewater | 1 | - | 1
| 2 | - |
| 21 | Sep 5, 1988 03:25 AM | I264 | 1 | 1
| 1 | 2 | - |
| 22 | Sep 28, 1988 10:33 PM | Sunset Dr | 1 | 1
| 1 | 1 | - |
| 23 | Sep 17, 1988 08:15 AM | I64 Eb | 1 | - | 1
| 1 | - |
| 24 | Oct 3, 1988 06:27 AM | I264e | 3 | - | 1
| 4 | - |
| 25 | Oct 13, 1988 10:10 PM | Newtown Rd | 1 | - | 1
| 2 | - |
| 26 | Nov 5, 1988 11:35 PM | I264e | 1 | 1
| 1 | 2 | - |
| 27 | Nov 11, 1988 11:15 PM | Militarhwy | 1 | 1
| 1 | 2 | - |
| 28 | Nov 11, 1988 09:35 PM | Hamptoblvd | 2 | 1
| 1 | 2 | - |
| 29 | Nov 9, 1988 08:30 AM | Eindiarivr | 2 | - | 1
| 4 | - |
| 30 | Nov 24, 1988 02:00 AM | Granby St | 1 | 1
| 1 | 2 | - |
| 31 | Nov 13, 1988 08:00 PM | Rt 166 | 1 | - | 1
| 2 | - |
| 32 | Dec 2, 1988 08:05 PM | Rt 58 | 1 | - | 1
| 2 | - |
| 33 | Dec 25, 1988 03:45 PM | Chesp Blvd | 1 | - | 1
| 1 | - |
Norfolk fatal car crash and road traffic accident list for 1987
- Fatal accident count30
- Vehicles involved in fatal accidents46
- Fatal accidents involving drunk persons17
- Fatalities33
- Persons involved in fatal accidents77
Dark - Lighted
- Norfolk(Based on 30 reports) 66.7%
- Norfolk city County(Based on 30 reports) 66.7%
- Virginia(Based on 905 reports) 11.9%
Daylight
- Norfolk(Based on 30 reports) 26.7%
- Norfolk city County(Based on 30 reports) 26.7%
- Virginia(Based on 905 reports) 46.3%
Dusk
- Norfolk(Based on 30 reports) 6.7%
- Norfolk city County(Based on 30 reports) 6.7%
- Virginia(Based on 905 reports) 2.3%
Clear
- Norfolk(Based on 30 reports) 80.0%
- Norfolk city County(Based on 30 reports) 80.0%
- Virginia(Based on 906 reports) 84.4%
Rain
- Norfolk(Based on 30 reports) 16.7%
- Norfolk city County(Based on 30 reports) 16.7%
- Virginia(Based on 906 reports) 12.1%
Fog, Smog, Smoke
- Norfolk(Based on 30 reports) 3.3%
- Norfolk city County(Based on 30 reports) 3.3%
- Virginia(Based on 906 reports) 1.0%
| # | Date | Location | Vehicles | Drunk persons | Fatalites | Persons | Pedestrians |
|---|
| 1 | Jan 101987 05:05 PM | | 1 | - | 1
| 2 | - |
| 2 | Jan 81987 10:25 PM | | 1 | 1
| 1 | 1 | - |
| 3 | Jan 181987 11:32 PM | | 1 | - | 1
| 2 | - |
| 4 | Feb 131987 11:25 PM | | 1 | 1
| 1 | 2 | - |
| 5 | Mar 71987 01:50 PM | | 1 | - | 1
| 1 | - |
| 6 | Mar 141987 09:35 PM | | 2 | 2
| 1 | 3 | - |
| 7 | Mar 221987 03:55 AM | | 1 | - | 1
| 1 | - |
| 8 | Apr 121987 07:15 PM | | 1 | 1
| 1 | 2 | - |
| 9 | Apr 141987 01:55 AM | | 1 | 1
| 1 | 1 | - |
| 10 | Apr 101987 11:25 PM | | 2 | - | 2
| 6 | - |
| 11 | Apr 171987 09:00 PM | | 1 | 1
| 1 | 1 | - |
| 12 | Jun 31987 08:05 PM | | 1 | - | 1
| 2 | - |
| 13 | Jul 131987 06:35 PM | | 2 | 1
| 1 | 3 | - |
| 14 | Jun 271987 02:40 AM | | 1 | 1
| 1 | 6 | - |
| 15 | Jul 151987 08:29 AM | | 3 | - | 2
| 6 | - |
| 16 | Jul 151987 10:30 PM | | 3 | 1
| 1 | 4 | - |
| 17 | Aug 11987 08:36 PM | | 1 | 1
| 1 | 2 | - |
| 18 | Sep 81987 07:50 PM | | 1 | - | 1
| 2 | - |
| 19 | Sep 241987 03:50 PM | | 4 | - | 1
| 4 | - |
| 20 | Sep 261987 03:50 PM | | 1 | - | 1
| 2 | - |
| 21 | Sep 191987 09:20 PM | | 1 | 1
| 1 | 2 | - |
| 22 | Oct 71987 01:05 AM | | 1 | - | 1
| 2 | - |
| 23 | Oct 61987 01:00 PM | | 1 | - | 1
| 2 | - |
| 24 | Oct 181987 02:05 AM | | 1 | 1
| 2 | 3 | - |
| 25 | Nov 21987 08:55 PM | | 2 | 1
| 1 | 2 | - |
| 26 | Oct 91987 02:05 AM | | 1 | 1
| 1 | 1 | - |
| 27 | Dec 4, 1987 04:30 PM | 999999999* | 2 | - | 1
| 3 | - |
| 28 | Dec 11987 10:25 PM | | 5 | 1
| 1 | 5 | - |
| 29 | Dec 21987 04:06 PM | | 1 | - | 1
| 2 | - |
| 30 | Dec 251987 00:15 AM | | 1 | 1
| 1 | 2 | - |
Norfolk fatal car crash and road traffic accident list for 1986
- Fatal accident count30
- Vehicles involved in fatal accidents42
- Fatal accidents involving drunk persons23
- Fatalities32
- Persons involved in fatal accidents64
Dark - Lighted
- Norfolk(Based on 30 reports) 63.3%
- Norfolk city County(Based on 30 reports) 63.3%
- Virginia(Based on 1,002 reports) 13.1%
Daylight
- Norfolk(Based on 30 reports) 30.0%
- Norfolk city County(Based on 30 reports) 30.0%
- Virginia(Based on 1,002 reports) 43.4%
Dark - Not Lighted
- Norfolk(Based on 30 reports) 6.7%
- Norfolk city County(Based on 30 reports) 6.7%
- Virginia(Based on 1,002 reports) 41.3%
Clear
- Norfolk(Based on 30 reports) 86.7%
- Norfolk city County(Based on 30 reports) 86.7%
- Virginia(Based on 1,002 reports) 87.6%
Rain
- Norfolk(Based on 30 reports) 10.0%
- Norfolk city County(Based on 30 reports) 10.0%
- Virginia(Based on 1,002 reports) 9.6%
Fog, Smog, Smoke
- Norfolk(Based on 30 reports) 3.3%
- Norfolk city County(Based on 30 reports) 3.3%
- Virginia(Based on 1,002 reports) 1.5%
| # | Date | Location | Vehicles | Drunk persons | Fatalites | Persons | Pedestrians |
|---|
| 1 | Jan 181986 11:11 PM | | 1 | 1
| 2 | 3 | - |
| 2 | Jan 241986 08:31 PM | | 1 | - | 1
| 2 | - |
| 3 | Feb 61986 87:99 PM | | 1 | 1
| 1 | 1 | - |
| 4 | Feb 271986 01:13 AM | | 2 | 1
| 1 | 3 | - |
| 5 | Feb 201986 02:00 AM | | 1 | 1
| 1 | 2 | - |
| 6 | Mar 41986 02:40 AM | | 1 | 1
| 1 | 1 | - |
| 7 | Mar 21986 03:20 AM | | 1 | 1
| 1 | 2 | - |
| 8 | Mar 141986 07:30 PM | | 2 | 1
| 1 | 2 | - |
| 9 | Apr 41986 01:40 AM | | 1 | 1
| 1 | 1 | - |
| 10 | May 11986 00:10 AM | | 2 | 2
| 1 | 3 | - |
| 11 | May 161986 11:25 AM | | 2 | - | 1
| 2 | - |
| 12 | Jun 51986 03:55 PM | | 2 | - | 1
| 4 | - |
| 13 | Jun 221986 02:10 AM | | 1 | - | 1
| 2 | - |
| 14 | Jul 91986 01:50 AM | | 1 | 1
| 1 | 2 | - |
| 15 | Jun 61986 08:00 PM | | 3 | 1
| 1 | 3 | - |
| 16 | Jul 181986 11:45 PM | | 1 | 1
| 1 | 2 | - |
| 17 | Jun 191986 09:00 PM | | 2 | - | 1
| 3 | - |
| 18 | Jul 271986 04:15 PM | | 1 | 1
| 1 | 1 | - |
| 19 | Jul 181986 03:20 PM | | 2 | 1
| 1 | 2 | - |
| 20 | Aug 71986 08:30 AM | | 2 | 1
| 1 | 3 | - |
| 21 | Sep 51986 09:47 AM | | 1 | - | 1
| 2 | - |
| 22 | Sep 201986 05:08 PM | | 1 | 1
| 1 | 1 | - |
| 23 | Sep 281986 10:40 PM | | 1 | 1
| 1 | 1 | - |
| 24 | Sep 201986 10:45 PM | | 1 | 1
| 1 | 3 | - |
| 25 | Oct 261986 01:15 AM | | 2 | 2
| 1 | 3 | - |
| 26 | Oct 261986 01:55 AM | | 1 | 1
| 1 | 1 | - |
| 27 | Oct 281986 08:00 PM | | 2 | - | 2
| 3 | - |
| 28 | Nov 281986 04:50 AM | | 1 | - | 1
| 2 | - |
| 29 | Dec 171986 02:30 PM | | 1 | - | 1
| 2 | - |
| 30 | Dec 201986 03:50 AM | | 1 | 1
| 1 | 2 | - |
Norfolk fatal car crash and road traffic accident list for 1985
- Fatal accident count43
- Vehicles involved in fatal accidents61
- Fatal accidents involving drunk persons21
- Fatalities47
- Persons involved in fatal accidents99
Dark - Lighted
- Norfolk(Based on 43 reports) 51.2%
- Norfolk city County(Based on 43 reports) 51.2%
- Virginia(Based on 895 reports) 13.2%
Daylight
- Norfolk(Based on 43 reports) 37.2%
- Norfolk city County(Based on 43 reports) 37.2%
- Virginia(Based on 895 reports) 46.5%
Dark - Not Lighted
- Norfolk(Based on 43 reports) 9.3%
- Norfolk city County(Based on 43 reports) 9.3%
- Virginia(Based on 895 reports) 38.0%
Dusk
- Norfolk(Based on 43 reports) 2.3%
- Norfolk city County(Based on 43 reports) 2.3%
- Virginia(Based on 895 reports) 2.0%
Clear
- Norfolk(Based on 43 reports) 81.4%
- Norfolk city County(Based on 43 reports) 81.4%
- Virginia(Based on 895 reports) 85.5%
Rain
- Norfolk(Based on 43 reports) 18.6%
- Norfolk city County(Based on 43 reports) 18.6%
- Virginia(Based on 895 reports) 12.2%
| # | Date | Location | Vehicles | Drunk persons | Fatalites | Persons | Pedestrians |
|---|
| 1 | Jan 71985 03:45 PM | | 1 | - | 1
| 2 | - |
| 2 | Feb 21985 08:35 PM | | 1 | - | 1
| 2 | - |
| 3 | Feb 241985 01:05 AM | | 2 | 1
| 1 | 2 | - |
| 4 | Feb 221985 07:05 PM | | 2 | - | 1
| 3 | - |
| 5 | Apr 11985 10:45 AM | | 1 | - | 1
| 1 | - |
| 6 | Apr 81985 04:05 PM | | 2 | 1
| 1 | 3 | - |
| 7 | Apr 51985 11:30 AM | | 2 | - | 1
| 3 | - |
| 8 | Apr 151985 02:55 PM | | 1 | - | 1
| 2 | - |
| 9 | Jun 191985 00:55 AM | | 1 | 1
| 1 | 1 | - |
| 10 | Jun 221985 05:50 PM | | 1 | - | 1
| 2 | - |
| 11 | Jun 271985 11:10 PM | | 1 | 1
| 2 | 3 | - |
| 12 | Jul 41985 01:40 AM | | 1 | - | 1
| 3 | - |
| 13 | Jul 71985 01:50 AM | | 2 | 2
| 1 | 2 | - |
| 14 | Jul 101985 08:39 PM | | 1 | - | 1
| 1 | - |
| 15 | Jul 111985 02:15 AM | | 1 | 1
| 1 | 1 | - |
| 16 | Jul 151985 01:50 AM | | 1 | - | 1
| 2 | - |
| 17 | Jul 241985 08:05 PM | | 1 | 1
| 1 | 2 | - |
| 18 | Jul 251985 02:45 PM | | 3 | - | 1
| 3 | - |
| 19 | Aug 101985 11:30 PM | | 2 | 1
| 3 | 5 | - |
| 20 | Aug 231985 05:15 AM | | 1 | - | 1
| 2 | - |
| 21 | Aug 221985 00:20 AM | | 3 | 1
| 1 | 4 | - |
| 22 | Sep 31985 08:05 PM | | 1 | - | 1
| 2 | - |
| 23 | Aug 211985 09:20 PM | | 1 | 1
| 1 | 2 | - |
| 24 | Apr 261985 08:40 PM | | 1 | - | 1
| 1 | - |
| 25 | Aug 311985 01:27 PM | | 1 | - | 1
| 1 | - |
| 26 | Aug 311985 08:42 PM | | 1 | 1
| 1 | 2 | - |
| 27 | Sep 151985 02:12 AM | | 2 | - | 1
| 11 | - |
| 28 | Oct 41985 10:15 AM | | 1 | - | 1
| 2 | - |
| 29 | Oct 61985 01:20 AM | | 1 | 1
| 1 | 1 | - |
| 30 | Aug 51985 12:13 AM | | 1 | - | 1
| 2 | - |
| 31 | Nov 161985 05:45 PM | | 1 | - | 1
| 2 | - |
| 32 | Sep 221985 09:10 AM | | 1 | - | 1
| 2 | - |
| 33 | Oct 101985 06:18 AM | | 1 | - | 1
| 2 | - |
| 34 | Dec 151985 06:50 PM | | 1 | - | 1
| 1 | - |
| 35 | Dec 191985 10:25 PM | | 2 | 2
| 1 | 2 | - |
| 36 | Oct 141985 07:10 PM | | 3 | 1
| 1 | 3 | - |
| 37 | Oct 221985 07:10 AM | | 1 | - | 1
| 1 | - |
| 38 | Nov 11985 03:00 AM | | 2 | 1
| 2 | 3 | - |
| 39 | Nov 21985 07:16 PM | | 1 | 1
| 1 | 2 | - |
| 40 | Nov 191985 10:50 PM | | 1 | 1
| 1 | 1 | - |
| 41 | Oct 101985 11:25 AM | | 2 | - | 1
| 2 | - |
| 42 | Oct 211985 02:50 PM | | 2 | 1
| 1 | 3 | - |
| 43 | Aug 271985 07:00 PM | | 2 | 1
| 1 | 2 | - |
Norfolk fatal car crash and road traffic accident list for 1984
- Fatal accident count39
- Vehicles involved in fatal accidents59
- Fatal accidents involving drunk persons25
- Fatalities43
- Persons involved in fatal accidents97
Dark - Lighted
- Norfolk(Based on 39 reports) 53.8%
- Norfolk city County(Based on 39 reports) 53.8%
- Virginia(Based on 918 reports) 13.0%
Daylight
- Norfolk(Based on 39 reports) 28.2%
- Norfolk city County(Based on 39 reports) 28.2%
- Virginia(Based on 918 reports) 41.2%
Dark - Not Lighted
- Norfolk(Based on 39 reports) 12.8%
- Norfolk city County(Based on 39 reports) 12.8%
- Virginia(Based on 918 reports) 41.7%
Dusk
- Norfolk(Based on 39 reports) 5.1%
- Norfolk city County(Based on 39 reports) 5.1%
- Virginia(Based on 918 reports) 3.4%
Clear
- Norfolk(Based on 39 reports) 87.2%
- Norfolk city County(Based on 39 reports) 87.2%
- Virginia(Based on 921 reports) 86.8%
Rain
- Norfolk(Based on 39 reports) 10.3%
- Norfolk city County(Based on 39 reports) 10.3%
- Virginia(Based on 921 reports) 9.9%
Fog, Smog, Smoke
- Norfolk(Based on 39 reports) 2.6%
- Norfolk city County(Based on 39 reports) 2.6%
- Virginia(Based on 921 reports) 2.1%
| # | Date | Location | Vehicles | Drunk persons | Fatalites | Persons | Pedestrians |
|---|
| 1 | Jan 101984 04:10 PM | | 2 | - | 1
| 2 | - |
| 2 | Jan 91984 07:50 PM | | 1 | - | 1
| 2 | - |
| 3 | Jan 141984 02:05 AM | | 1 | 1
| 1 | 2 | - |
| 4 | Jan 201984 08:50 PM | | 1 | - | 1
| 2 | - |
| 5 | Jan 301984 01:00 AM | | 1 | 1
| 1 | 3 | - |
| 6 | Feb 21984 02:50 PM | | 2 | - | 1
| 3 | - |
| 7 | Feb 61984 06:35 PM | | 4 | 1
| 2 | 5 | - |
| 8 | Mar 101984 04:45 PM | | 1 | - | 1
| 2 | - |
| 9 | Mar 91984 00:15 AM | | 1 | - | 1
| 2 | - |
| 10 | Apr 11984 03:18 PM | | 2 | - | 1
| 2 | - |
| 11 | Apr 121984 12:20 AM | | 2 | 1
| 1 | 2 | - |
| 12 | Apr 251984 05:45 PM | | 1 | - | 1
| 3 | - |
| 13 | Apr 241984 03:30 PM | | 1 | - | 1
| 2 | - |
| 14 | May 111984 10:45 PM | | 3 | 2
| 2 | 4 | - |
| 15 | May 101984 01:50 AM | | 2 | 2
| 1 | 2 | - |
| 16 | May 161984 01:30 AM | | 1 | 1
| 1 | 2 | - |
| 17 | Jun 21984 11:15 PM | | 2 | 1
| 1 | 2 | - |
| 18 | Jun 81984 09:15 PM | | 1 | 1
| 1 | 2 | - |
| 19 | Jun 11984 06:05 PM | | 2 | - | 1
| 3 | - |
| 20 | Jul 61984 11:05 PM | | 1 | - | 1
| 2 | - |
| 21 | Jul 231984 12:45 AM | | 2 | - | 1
| 2 | - |
| 22 | Jul 311984 11:15 PM | | 2 | 1
| 2 | 4 | - |
| 23 | Aug 31984 10:29 PM | | 1 | 1
| 1 | 2 | - |
| 24 | Aug 121984 00:25 AM | | 2 | 1
| 1 | 5 | - |
| 25 | Sep 11984 10:35 AM | | 1 | - | 1
| 2 | - |
| 26 | Sep 91984 00:10 AM | | 2 | 1
| 1 | 3 | - |
| 27 | Sep 251984 02:00 AM | | 1 | 1
| 1 | 1 | - |
| 28 | Oct 11984 09:57 PM | | 1 | 1
| 1 | 1 | - |
| 29 | Nov 31984 06:25 AM | | 1 | 1
| 1 | 1 | - |
| 30 | Nov 61984 01:15 AM | | 1 | - | 1
| 3 | - |
| 31 | Nov 19, 1984 04:23 PM | 999999999 | 2 | - | 1
| 2 | - |
| 32 | Dec 11984 04:30 PM | | 2 | 1
| 1 | 4 | - |
| 33 | Nov 201984 00:55 AM | | 1 | 1
| 1 | 2 | - |
| 34 | Nov 261984 06:00 PM | | 1 | - | 1
| 2 | - |
| 35 | Nov 251984 08:20 AM | | 2 | - | 2
| 4 | - |
| 36 | Nov 221984 10:50 PM | | 2 | 2
| 1 | 4 | - |
| 37 | Dec 131984 01:37 AM | | 1 | 1
| 1 | 3 | - |
| 38 | Dec 171984 10:33 PM | | 1 | 1
| 1 | 1 | - |
| 39 | Dec 91984 10:00 PM | | 1 | 1
| 1 | 2 | - |
Norfolk fatal car crash and road traffic accident list for 1983
- Fatal accident count24
- Vehicles involved in fatal accidents31
- Fatal accidents involving drunk persons11
- Fatalities25
- Persons involved in fatal accidents47
Dark - Lighted
- Norfolk(Based on 24 reports) 58.3%
- Norfolk city County(Based on 24 reports) 58.3%
- Virginia(Based on 803 reports) 14.2%
Daylight
- Norfolk(Based on 24 reports) 20.8%
- Norfolk city County(Based on 24 reports) 20.8%
- Virginia(Based on 803 reports) 43.6%
Dark - Not Lighted
- Norfolk(Based on 24 reports) 12.5%
- Norfolk city County(Based on 24 reports) 12.5%
- Virginia(Based on 803 reports) 39.2%
Dusk
- Norfolk(Based on 24 reports) 8.3%
- Norfolk city County(Based on 24 reports) 8.3%
- Virginia(Based on 803 reports) 1.9%
Clear
- Norfolk(Based on 24 reports) 83.3%
- Norfolk city County(Based on 24 reports) 83.3%
- Virginia(Based on 803 reports) 82.9%
Rain
- Norfolk(Based on 24 reports) 16.7%
- Norfolk city County(Based on 24 reports) 16.7%
- Virginia(Based on 803 reports) 14.3%
| # | Date | Location | Vehicles | Drunk persons | Fatalites | Persons | Pedestrians |
|---|
| 1 | Feb 31983 05:00 PM | | 2 | - | 1
| 3 | - |
| 2 | Feb 111983 10:45 AM | | 2 | 1
| 1 | 2 | - |
| 3 | Feb 231983 04:15 AM | | 2 | 1
| 1 | 2 | - |
| 4 | Mar 91983 03:05 PM | | 1 | - | 1
| 2 | - |
| 5 | Apr 191983 01:10 AM | | 1 | 1
| 2 | 2 | - |
| 6 | Apr 221983 05:50 AM | | 1 | - | 1
| 1 | - |
| 7 | May 181983 00:50 AM | | 2 | 1
| 1 | 2 | - |
| 8 | May 131983 12:00 PM | | 1 | - | 1
| 1 | - |
| 9 | May 271983 11:40 PM | | 1 | 1
| 1 | 1 | - |
| 10 | Jun 241983 12:50 AM | | 1 | - | 1
| 2 | - |
| 11 | Jul 201983 01:35 AM | | 1 | 1
| 1 | 2 | - |
| 12 | Jul 261983 08:55 PM | | 1 | - | 1
| 2 | - |
| 13 | Jul 121983 09:54 AM | | 1 | - | 1
| 1 | - |
| 14 | Sep 21983 01:48 AM | | 2 | 2
| 1 | 2 | - |
| 15 | Sep 31983 11:30 PM | | 1 | - | 1
| 4 | - |
| 16 | Oct 21983 10:06 PM | | 1 | - | 1
| 2 | - |
| 17 | Oct 281983 03:30 AM | | 2 | 1
| 1 | 3 | - |
| 18 | Oct 291983 11:45 PM | | 1 | 1
| 1 | 1 | - |
| 19 | Oct 311983 05:50 PM | | 1 | - | 1
| 2 | - |
| 20 | Nov 91983 07:05 PM | | 1 | - | 1
| 2 | - |
| 21 | Nov 221983 06:30 PM | | 1 | - | 1
| 2 | - |
| 22 | Dec 241983 06:50 PM | | 1 | - | 1
| 2 | - |
| 23 | Dec 271983 10:55 PM | | 1 | 1
| 1 | 1 | - |
| 24 | Dec 101983 05:40 AM | | 2 | - | 1
| 3 | - |
Norfolk fatal car crash and road traffic accident list for 1982
- Fatal accident count34
- Vehicles involved in fatal accidents50
- Fatal accidents involving drunk persons8
- Fatalities37
- Persons involved in fatal accidents89
Dark - Lighted
- Norfolk(Based on 34 reports) 44.1%
- Norfolk city County(Based on 35 reports) 42.9%
- Virginia(Based on 781 reports) 13.8%
Daylight
- Norfolk(Based on 34 reports) 41.2%
- Norfolk city County(Based on 35 reports) 42.9%
- Virginia(Based on 781 reports) 41.0%
Dark - Not Lighted
- Norfolk(Based on 34 reports) 8.8%
- Norfolk city County(Based on 35 reports) 8.6%
- Virginia(Based on 781 reports) 41.7%
Dawn
- Norfolk(Based on 34 reports) 2.9%
- Norfolk city County(Based on 35 reports) 2.9%
- Virginia(Based on 781 reports) 0.9%
Dusk
- Norfolk(Based on 34 reports) 2.9%
- Norfolk city County(Based on 35 reports) 2.9%
- Virginia(Based on 781 reports) 2.6%
Clear
- Norfolk(Based on 34 reports) 73.5%
- Norfolk city County(Based on 35 reports) 74.3%
- Virginia(Based on 782 reports) 79.8%
Rain
- Norfolk(Based on 34 reports) 23.5%
- Norfolk city County(Based on 35 reports) 22.9%
- Virginia(Based on 782 reports) 14.6%
Fog, Smog, Smoke
- Norfolk(Based on 34 reports) 2.9%
- Norfolk city County(Based on 35 reports) 2.9%
- Virginia(Based on 782 reports) 3.1%
| # | Date | Location | Vehicles | Drunk persons | Fatalites | Persons | Pedestrians |
|---|
| 1 | Jan 11982 02:30 AM | | 1 | - | 1
| 2 | - |
| 2 | Jan 11982 00:01 AM | | 1 | - | 1
| 2 | - |
| 3 | Feb 11982 02:10 AM | | 3 | 1
| 1 | 3 | - |
| 4 | Mar 121982 11:00 AM | | 2 | - | 1
| 3 | - |
| 5 | Mar 121982 03:00 PM | | 3 | 1
| 1 | 3 | - |
| 6 | Mar 281982 06:30 PM | | 2 | 1
| 1 | 3 | - |
| 7 | Apr 251982 05:55 AM | | 2 | - | 1
| 2 | - |
| 8 | Apr 101982 07:25 PM | | 1 | - | 1
| 2 | - |
| 9 | Apr 151982 06:50 PM | | 1 | - | 1
| 2 | - |
| 10 | May 61982 02:45 PM | | 1 | - | 1
| 2 | - |
| 11 | May 301982 02:27 AM | | 1 | 1
| 1 | 2 | - |
| 12 | Jun 21982 03:55 PM | | 1 | - | 1
| 2 | - |
| 13 | Jun 131982 02:00 AM | | 1 | - | 1
| 3 | - |
| 14 | Jun 151982 05:35 PM | | 1 | - | 1
| 2 | - |
| 15 | Jun 191982 05:30 PM | | 1 | - | 1
| 3 | - |
| 16 | Jul 31982 09:30 PM | | 2 | - | 1
| 5 | - |
| 17 | Jul 151982 08:25 PM | | 1 | 1
| 1 | 3 | - |
| 18 | Jul 271982 06:30 AM | | 1 | - | 1
| 1 | - |
| 19 | Aug 91982 00:20 AM | | 1 | - | 1
| 1 | - |
| 20 | Aug 121982 03:17 PM | | 2 | - | 1
| 3 | - |
| 21 | Sep 141982 11:55 AM | | 2 | - | 1
| 3 | - |
| 22 | Oct 41982 03:15 PM | | 1 | - | 1
| 2 | - |
| 23 | Oct 291982 07:41 PM | | 1 | - | 1
| 2 | - |
| 24 | Nov 91982 02:50 PM | | 1 | - | 1
| 2 | - |
| 25 | Nov 61982 05:53 AM | | 1 | - | 1
| 1 | - |
| 26 | Nov 21982 10:15 PM | | 1 | - | 1
| 1 | - |
| 27 | Dec 191982 05:40 PM | | 1 | - | 1
| 3 | - |
| 28 | Dec 231982 05:00 PM | | 2 | 1
| 1 | 3 | - |
| 29 | Dec 81982 05:48 AM | | 1 | 1
| 1 | 3 | - |
| 30 | Dec 181982 09:28 PM | | 1 | - | 1
| 2 | - |
| 31 | Dec 311982 02:25 PM | | 4 | - | 2
| 11 | - |
| 32 | Dec 171982 04:07 PM | | 2 | - | 1
| 2 | - |
| 33 | Nov 161982 01:42 AM | | 2 | 1
| 3 | 3 | - |
| 34 | Aug 41982 09:00 PM | | 1 | - | 1
| 2 | - |
Norfolk fatal car crash and road traffic accident list for 1981
- Fatal accident count26
- Vehicles involved in fatal accidents41
- Fatal accidents involving drunk persons16
- Fatalities32
- Persons involved in fatal accidents72
Dark - Lighted
- Norfolk(Based on 26 reports) 53.8%
- Norfolk city County(Based on 26 reports) 53.8%
- Virginia(Based on 905 reports) 14.6%
Dark - Not Lighted
- Norfolk(Based on 26 reports) 23.1%
- Norfolk city County(Based on 26 reports) 23.1%
- Virginia(Based on 905 reports) 41.1%
Daylight
- Norfolk(Based on 26 reports) 15.4%
- Norfolk city County(Based on 26 reports) 15.4%
- Virginia(Based on 905 reports) 40.3%
Dawn
- Norfolk(Based on 26 reports) 3.8%
- Norfolk city County(Based on 26 reports) 3.8%
- Virginia(Based on 905 reports) 1.5%
Dusk
- Norfolk(Based on 26 reports) 3.8%
- Norfolk city County(Based on 26 reports) 3.8%
- Virginia(Based on 905 reports) 2.4%
Clear
- Norfolk(Based on 26 reports) 92.3%
- Norfolk city County(Based on 26 reports) 92.3%
- Virginia(Based on 907 reports) 87.9%
Rain
- Norfolk(Based on 26 reports) 7.7%
- Norfolk city County(Based on 26 reports) 7.7%
- Virginia(Based on 907 reports) 10.7%
Norfolk fatal car crash and road traffic accident list for 1980
- Fatal accident count35
- Vehicles involved in fatal accidents45
- Fatal accidents involving drunk persons19
- Fatalities36
- Persons involved in fatal accidents78
Dark - Lighted
- Norfolk(Based on 35 reports) 54.3%
- Norfolk city County(Based on 37 reports) 54.1%
- Virginia(Based on 935 reports) 13.8%
Daylight
- Norfolk(Based on 35 reports) 31.4%
- Norfolk city County(Based on 37 reports) 32.4%
- Virginia(Based on 935 reports) 40.7%
Dark - Not Lighted
- Norfolk(Based on 35 reports) 14.3%
- Norfolk city County(Based on 37 reports) 13.5%
- Virginia(Based on 935 reports) 41.6%
Clear
- Norfolk(Based on 35 reports) 88.6%
- Norfolk city County(Based on 37 reports) 86.5%
- Virginia(Based on 938 reports) 88.2%
Rain
- Norfolk(Based on 35 reports) 8.6%
- Norfolk city County(Based on 37 reports) 10.8%
- Virginia(Based on 938 reports) 8.8%
Snow
- Norfolk(Based on 35 reports) 2.9%
- Norfolk city County(Based on 37 reports) 2.7%
- Virginia(Based on 938 reports) 1.0%
Norfolk fatal car crash and road traffic accident list for 1979
- Fatal accident count29
- Vehicles involved in fatal accidents40
- Fatal accidents involving drunk persons19
- Fatalities29
- Persons involved in fatal accidents77
Dark - Lighted
- Norfolk(Based on 29 reports) 62.1%
- Norfolk city County(Based on 29 reports) 62.1%
- Virginia(Based on 921 reports) 13.8%
Dark - Not Lighted
- Norfolk(Based on 29 reports) 20.7%
- Norfolk city County(Based on 29 reports) 20.7%
- Virginia(Based on 921 reports) 42.5%
Daylight
- Norfolk(Based on 29 reports) 17.2%
- Norfolk city County(Based on 29 reports) 17.2%
- Virginia(Based on 921 reports) 40.0%
Clear
- Norfolk(Based on 29 reports) 89.7%
- Norfolk city County(Based on 29 reports) 89.7%
- Virginia(Based on 923 reports) 82.9%
Rain
- Norfolk(Based on 29 reports) 6.9%
- Norfolk city County(Based on 29 reports) 6.9%
- Virginia(Based on 923 reports) 13.5%
Blowing Sand, Soil, Dirt
- Norfolk(Based on 29 reports) 3.4%
- Norfolk city County(Based on 29 reports) 3.4%
- Virginia(Based on 923 reports) 1.6%
Norfolk fatal car crash and road traffic accident list for 1978
- Fatal accident count33
- Vehicles involved in fatal accidents60
- Fatal accidents involving drunk persons19
- Fatalities35
- Persons involved in fatal accidents93
Dark - Lighted
- Norfolk(Based on 33 reports) 48.5%
- Norfolk city County(Based on 33 reports) 48.5%
- Virginia(Based on 951 reports) 11.1%
Daylight
- Norfolk(Based on 33 reports) 27.3%
- Norfolk city County(Based on 33 reports) 27.3%
- Virginia(Based on 951 reports) 41.4%
Dark - Not Lighted
- Norfolk(Based on 33 reports) 18.2%
- Norfolk city County(Based on 33 reports) 18.2%
- Virginia(Based on 951 reports) 43.5%
Dark - Unknown Lighting
- Norfolk(Based on 33 reports) 6.1%
- Norfolk city County(Based on 33 reports) 6.1%
- Virginia(Based on 951 reports) 3.9%
Clear
- Norfolk(Based on 33 reports) 93.9%
- Norfolk city County(Based on 33 reports) 93.9%
- Virginia(Based on 951 reports) 86.0%
Rain
- Norfolk(Based on 33 reports) 6.1%
- Norfolk city County(Based on 33 reports) 6.1%
- Virginia(Based on 951 reports) 10.8%
Norfolk fatal car crash and road traffic accident list for 1977
- Fatal accident count28
- Vehicles involved in fatal accidents42
- Fatal accidents involving drunk persons13
- Fatalities30
- Persons involved in fatal accidents66
Dark - Lighted
- Norfolk(Based on 28 reports) 42.9%
- Norfolk city County(Based on 28 reports) 42.9%
- Virginia(Based on 975 reports) 12.8%
Daylight
- Norfolk(Based on 28 reports) 28.6%
- Norfolk city County(Based on 28 reports) 28.6%
- Virginia(Based on 975 reports) 42.2%
Dark - Not Lighted
- Norfolk(Based on 28 reports) 28.6%
- Norfolk city County(Based on 28 reports) 28.6%
- Virginia(Based on 975 reports) 39.8%
Clear
- Norfolk(Based on 28 reports) 89.3%
- Norfolk city County(Based on 28 reports) 89.3%
- Virginia(Based on 975 reports) 86.9%
Rain
- Norfolk(Based on 28 reports) 7.1%
- Norfolk city County(Based on 28 reports) 7.1%
- Virginia(Based on 975 reports) 10.5%
Blowing Sand, Soil, Dirt
- Norfolk(Based on 28 reports) 3.6%
- Norfolk city County(Based on 28 reports) 3.6%
- Virginia(Based on 975 reports) 1.0%
Norfolk fatal car crash and road traffic accident list for 1976
- Fatal accident count28
- Vehicles involved in fatal accidents40
- Fatalities34
- Persons involved in fatal accidents68
Dark - Lighted
- Norfolk(Based on 28 reports) 50.0%
- Norfolk city County(Based on 28 reports) 50.0%
- Virginia(Based on 862 reports) 13.6%
Daylight
- Norfolk(Based on 28 reports) 32.1%
- Norfolk city County(Based on 28 reports) 32.1%
- Virginia(Based on 862 reports) 43.0%
Dark - Not Lighted
- Norfolk(Based on 28 reports) 14.3%
- Norfolk city County(Based on 28 reports) 14.3%
- Virginia(Based on 862 reports) 39.8%
Dark - Unknown Lighting
- Norfolk(Based on 28 reports) 3.6%
- Norfolk city County(Based on 28 reports) 3.6%
- Virginia(Based on 862 reports) 3.6%
Clear
- Norfolk(Based on 28 reports) 89.3%
- Norfolk city County(Based on 28 reports) 89.3%
- Virginia(Based on 867 reports) 84.0%
Rain
- Norfolk(Based on 28 reports) 7.1%
- Norfolk city County(Based on 28 reports) 7.1%
- Virginia(Based on 867 reports) 11.9%
Cloudy
- Norfolk(Based on 28 reports) 3.6%
- Norfolk city County(Based on 28 reports) 3.6%
- Virginia(Based on 867 reports) 1.8%
Norfolk fatal car crash and road traffic accident list for 1975
- Fatal accident count28
- Vehicles involved in fatal accidents40
- Fatalities34
- Persons involved in fatal accidents68
Dark - Lighted
- Norfolk(Based on 28 reports) 50.0%
- Norfolk city County(Based on 28 reports) 50.0%
- Virginia(Based on 862 reports) 13.6%
Daylight
- Norfolk(Based on 28 reports) 32.1%
- Norfolk city County(Based on 28 reports) 32.1%
- Virginia(Based on 862 reports) 43.0%
Dark - Not Lighted
- Norfolk(Based on 28 reports) 14.3%
- Norfolk city County(Based on 28 reports) 14.3%
- Virginia(Based on 862 reports) 39.8%
Dark - Unknown Lighting
- Norfolk(Based on 28 reports) 3.6%
- Norfolk city County(Based on 28 reports) 3.6%
- Virginia(Based on 862 reports) 3.6%
Clear
- Norfolk(Based on 28 reports) 89.3%
- Norfolk city County(Based on 28 reports) 89.3%
- Virginia(Based on 867 reports) 84.0%
Rain
- Norfolk(Based on 28 reports) 7.1%
- Norfolk city County(Based on 28 reports) 7.1%
- Virginia(Based on 867 reports) 11.9%
Cloudy
- Norfolk(Based on 28 reports) 3.6%
- Norfolk city County(Based on 28 reports) 3.6%
- Virginia(Based on 867 reports) 1.8%