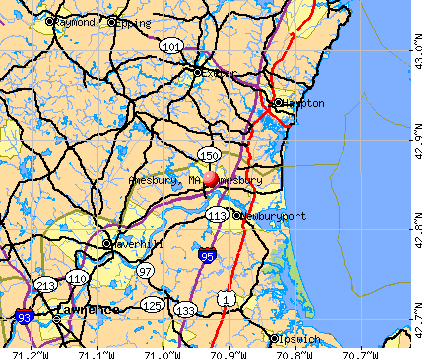
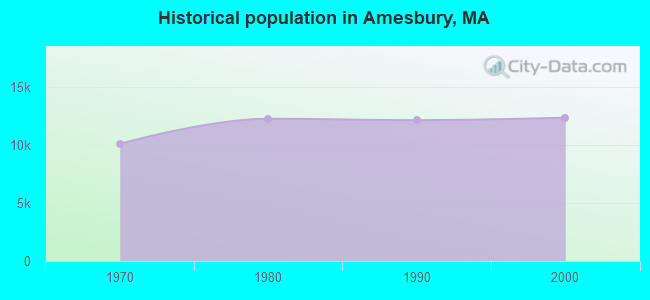
Amesbury, Massachusetts

Amesbury: A winter day looking across the Merrimack river in Amesbury

Amesbury: Snowy day in Amesbury,MA
- add
your
Submit your own pictures of this place and show them to the world
- OSM Map
- General Map
- Google Map
- MSN Map
| Males: 5,996 | |
| Females: 6,461 |
| Median resident age: | 36.1 years |
| Massachusetts median age: | 36.5 years |
Zip codes: 01913.
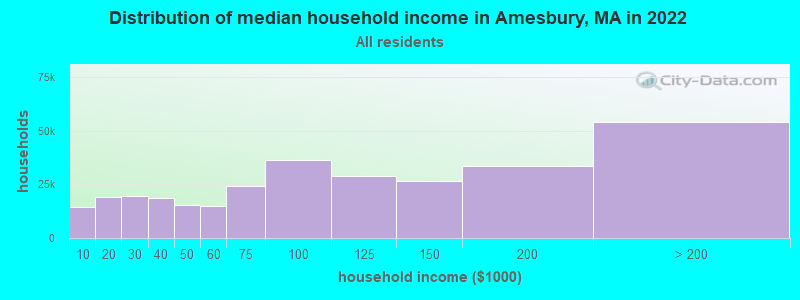
| Amesbury: | $89,655 |
| MA: | $94,488 |
Estimated per capita income in 2022: $44,050 (it was $22,657 in 2000)
Amesbury CDP income, earnings, and wages data
Estimated median house or condo value in 2022: $468,179 (it was $166,700 in 2000)
| Amesbury: | $468,179 |
| MA: | $534,700 |
Mean prices in 2022: all housing units: $645,471; detached houses: $712,185; townhouses or other attached units: $551,275; in 2-unit structures: $503,219; in 3-to-4-unit structures: $450,535; in 5-or-more-unit structures: $352,534; mobile homes: $123,118; occupied boats, rvs, vans, etc.: $131,058
Detailed information about poverty and poor residents in Amesbury, MA


- 11,86396.2%White alone
- 1511.2%Two or more races
- 1291.0%Hispanic
- 680.6%Black alone
- 740.6%Asian alone
- 200.2%American Indian alone
- 220.2%Other race alone
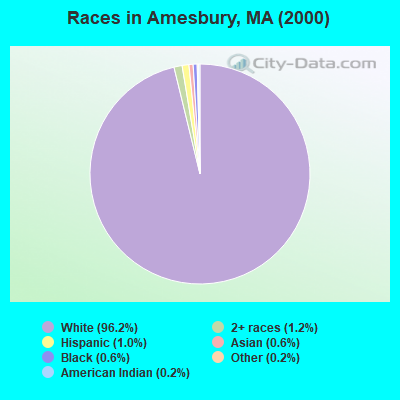
Races in Amesbury detailed stats: ancestries, foreign born residents, place of birth
According to our research of Massachusetts and other state lists, there were 7 registered sex offenders living in Amesbury, Massachusetts as of April 25, 2024.
The ratio of all residents to sex offenders in Amesbury is 1,780 to 1.
The ratio of registered sex offenders to all residents in this city is near the state average.
Type |
2009 |
2010 |
2011 |
2012 |
2013 |
2014 |
2015 |
2016 |
2017 |
2018 |
2019 |
2020 |
2021 |
2022 |
|---|---|---|---|---|---|---|---|---|---|---|---|---|---|---|
| Murders (per 100,000) | 0 (0.0) | 0 (0.0) | 0 (0.0) | 0 (0.0) | 0 (0.0) | 0 (0.0) | 0 (0.0) | 0 (0.0) | 0 (0.0) | 0 (0.0) | 0 (0.0) | 1 (5.7) | 0 (0.0) | 0 (0.0) |
| Rapes (per 100,000) | 2 (12.0) | 5 (30.7) | 4 (24.4) | 6 (36.2) | 3 (18.0) | 7 (41.7) | 7 (41.4) | 8 (45.6) | 6 (34.0) | 8 (45.4) | 3 (17.1) | 4 (22.8) | 2 (11.2) | 2 (11.6) |
| Robberies (per 100,000) | 0 (0.0) | 0 (0.0) | 2 (12.2) | 5 (30.2) | 2 (12.0) | 3 (17.9) | 0 (0.0) | 4 (22.8) | 0 (0.0) | 2 (11.3) | 3 (17.1) | 0 (0.0) | 3 (16.8) | 0 (0.0) |
| Assaults (per 100,000) | 26 (156.4) | 39 (239.5) | 22 (134.3) | 33 (199.3) | 37 (222.2) | 32 (190.7) | 81 (478.7) | 104 (592.2) | 44 (249.5) | 22 (124.8) | 19 (108.0) | 21 (119.5) | 15 (84.2) | 22 (127.3) |
| Burglaries (per 100,000) | 39 (234.6) | 52 (319.4) | 43 (262.5) | 48 (289.9) | 40 (240.2) | 23 (137.0) | 37 (218.7) | 34 (193.6) | 12 (68.0) | 18 (102.1) | 18 (102.3) | 10 (56.9) | 6 (33.7) | 11 (63.7) |
| Thefts (per 100,000) | 223 (1,342) | 201 (1,234) | 190 (1,160) | 193 (1,166) | 191 (1,147) | 125 (744.8) | 101 (596.9) | 82 (466.9) | 105 (595.4) | 117 (663.9) | 107 (608.1) | 51 (290.1) | 46 (258.3) | 114 (659.9) |
| Auto thefts (per 100,000) | 16 (96.3) | 13 (79.8) | 16 (97.7) | 16 (96.6) | 8 (48.0) | 7 (41.7) | 8 (47.3) | 7 (39.9) | 3 (17.0) | 8 (45.4) | 7 (39.8) | 4 (22.8) | 4 (22.5) | 5 (28.9) |
| Arson (per 100,000) | 0 (0.0) | 2 (12.3) | 1 (6.1) | 1 (6.0) | 2 (12.0) | 0 (0.0) | 0 (0.0) | 1 (5.7) | 0 (0.0) | 1 (5.7) | 0 (0.0) | 0 (0.0) | 0 (0.0) | 2 (11.6) |
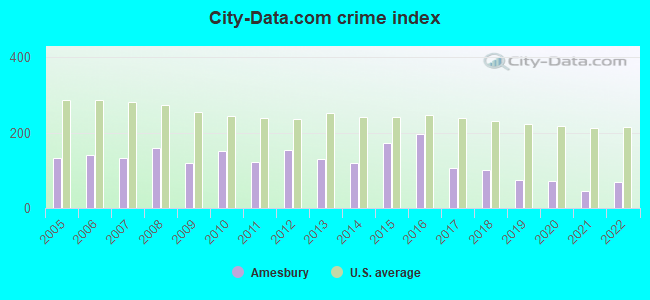
| City-Data.com crime index | 118.7 | 150.6 | 122.6 | 152.6 | 129.0 | 119.6 | 171.8 | 197.1 | 107.1 | 102.0 | 75.0 | 70.9 | 45.4 | 67.9 |
The City-Data.com crime index weighs serious crimes and violent crimes more heavily. Higher means more crime, U.S. average is 246.1. It adjusts for the number of visitors and daily workers commuting into cities.
Crime rate in Amesbury detailed stats: murders, rapes, robberies, assaults, burglaries, thefts, arson
Full-time law enforcement employees in 2021, including police officers: 39 (33 officers - 30 male; 3 female).
| Officers per 1,000 residents here: | 1.85 |
| Massachusetts average: | 2.53 |
 Recent articles from our blog. Our writers, many of them Ph.D. graduates or candidates, create easy-to-read articles on a wide variety of topics.

 | Chelmsford Relocation help - 495 Towns from Amesbury to Littleton (28 replies) |
| What is family life like in Amesbury, MA these days? (27 replies) |
| Question about Amesbury (8 replies) |
| Coronavirus in Massachusetts (18047 replies) |
| Pick a New England place for us (62 replies) |
| Drownings in the area (148 replies) |
Latest news from Amesbury, MA collected exclusively by city-data.com from local newspapers, TV, and radio stations
Amesbury, MA City Guides:
Ancestries: Irish (23.7%), English (17.6%), French (15.6%), Italian (12.1%), French Canadian (10.0%), German (7.7%).
Current Local Time: EST time zone
Elevation: 50 feet
Land area: 5.31 square miles.
Population density: 2,346 people per square mile (low).
381 residents are foreign born (1.2% Latin America, 1.0% Europe, 0.6% Asia).
| This place: | 3.1% |
| Massachusetts: | 12.2% |
| Amesbury CDP: | 1.5% ($2,545) |
| Massachusetts: | 1.3% ($2,336) |
Nearest city with pop. 50,000+: Haverhill, MA  (9.6 miles , pop. 58,969).
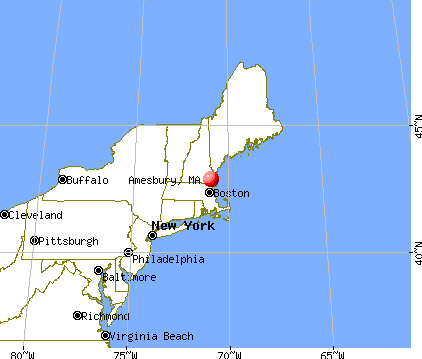
Nearest city with pop. 200,000+: Boston, MA (37.9 miles , pop. 589,141).
Nearest city with pop. 1,000,000+: Bronx, NY (205.7 miles , pop. 1,332,650).
Nearest cities:
), ), )Latitude: 42.86 N, Longitude: 70.93 W
Daytime population change due to commuting: -1,993 (-16.2%)
Workers who live and work in this place: 1,424 (22.6%)
Area code: 978
Amesbury, Massachusetts accommodation & food services, waste management - Economy and Business Data
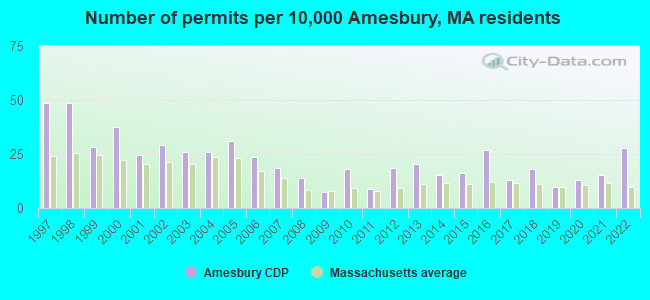
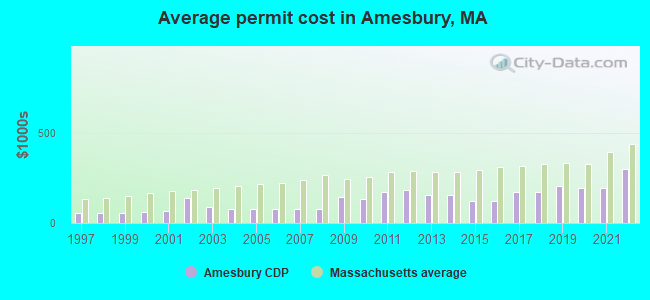
Single-family new house construction building permits:
- 2022: 34 buildings, average cost: $295,600
- 2021: 19 buildings, average cost: $193,100
- 2020: 16 buildings, average cost: $191,200
- 2019: 12 buildings, average cost: $203,200
- 2018: 22 buildings, average cost: $173,400
- 2017: 16 buildings, average cost: $173,500
- 2016: 33 buildings, average cost: $123,200
- 2015: 20 buildings, average cost: $120,200
- 2014: 19 buildings, average cost: $157,200
- 2013: 25 buildings, average cost: $156,700
- 2012: 23 buildings, average cost: $185,400
- 2011: 11 buildings, average cost: $173,300
- 2010: 22 buildings, average cost: $132,600
- 2009: 9 buildings, average cost: $142,500
- 2008: 17 buildings, average cost: $78,500
- 2007: 23 buildings, average cost: $78,100
- 2006: 29 buildings, average cost: $80,000
- 2005: 38 buildings, average cost: $80,100
- 2004: 32 buildings, average cost: $79,700
- 2003: 32 buildings, average cost: $85,800
- 2002: 36 buildings, average cost: $140,900
- 2001: 30 buildings, average cost: $67,900
- 2000: 46 buildings, average cost: $60,600
- 1999: 35 buildings, average cost: $56,500
- 1998: 60 buildings, average cost: $57,900
- 1997: 60 buildings, average cost: $56,700
| Here: | 3.6% |
| Massachusetts: | 3.5% |
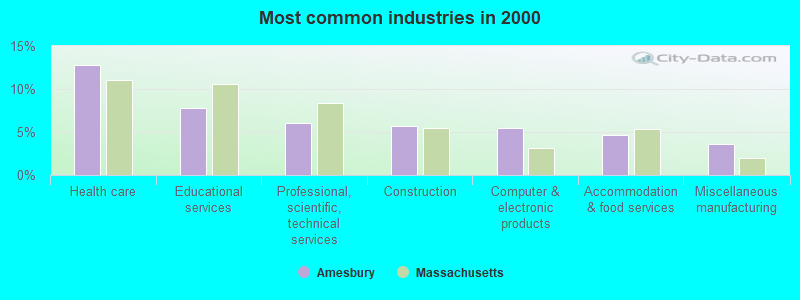
- Health care (12.8%)
- Educational services (7.7%)
- Professional, scientific, technical services (6.0%)
- Construction (5.7%)
- Computer & electronic products (5.4%)
- Accommodation & food services (4.6%)
- Miscellaneous manufacturing (3.6%)
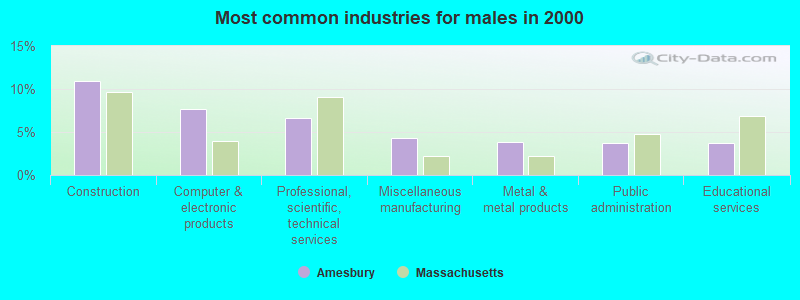
- Construction (10.9%)
- Computer & electronic products (7.7%)
- Professional, scientific, technical services (6.6%)
- Miscellaneous manufacturing (4.3%)
- Metal & metal products (3.8%)
- Public administration (3.8%)
- Educational services (3.7%)
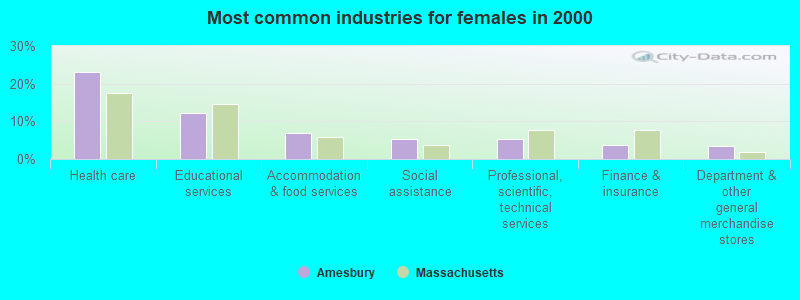
- Health care (23.0%)
- Educational services (12.1%)
- Accommodation & food services (6.8%)
- Social assistance (5.4%)
- Professional, scientific, technical services (5.3%)
- Finance & insurance (3.8%)
- Department & other general merchandise stores (3.4%)
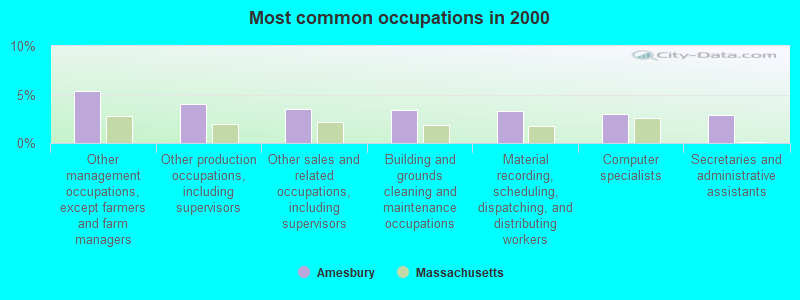
- Other management occupations, except farmers and farm managers (5.3%)
- Other production occupations, including supervisors (4.0%)
- Other sales and related occupations, including supervisors (3.5%)
- Building and grounds cleaning and maintenance occupations (3.4%)
- Material recording, scheduling, dispatching, and distributing workers (3.2%)
- Computer specialists (3.0%)
- Secretaries and administrative assistants (2.9%)
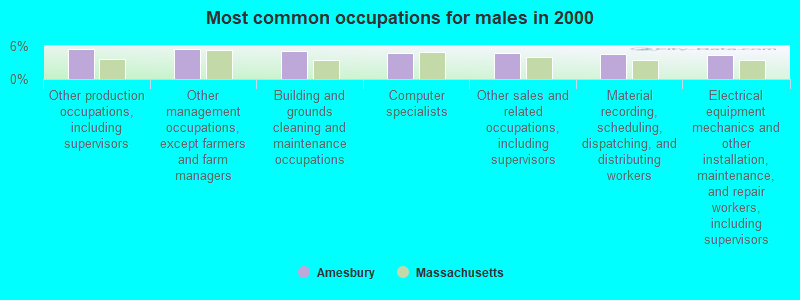
- Other production occupations, including supervisors (5.4%)
- Other management occupations, except farmers and farm managers (5.4%)
- Building and grounds cleaning and maintenance occupations (5.1%)
- Computer specialists (4.8%)
- Other sales and related occupations, including supervisors (4.7%)
- Material recording, scheduling, dispatching, and distributing workers (4.6%)
- Electrical equipment mechanics and other installation, maintenance, and repair workers, including supervisors (4.4%)
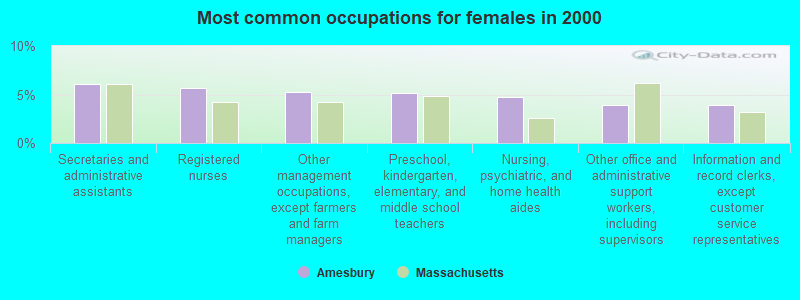
- Secretaries and administrative assistants (6.1%)
- Registered nurses (5.7%)
- Other management occupations, except farmers and farm managers (5.3%)
- Preschool, kindergarten, elementary, and middle school teachers (5.2%)
- Nursing, psychiatric, and home health aides (4.8%)
- Other office and administrative support workers, including supervisors (3.9%)
- Information and record clerks, except customer service representatives (3.9%)
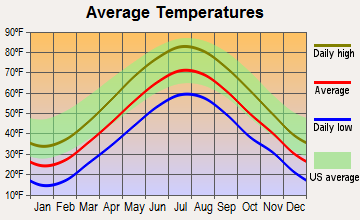
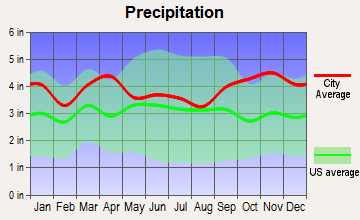
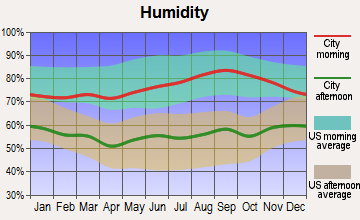
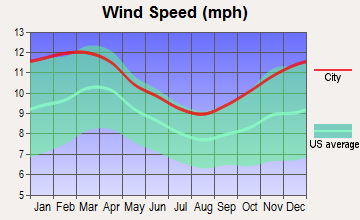
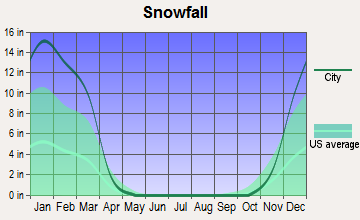
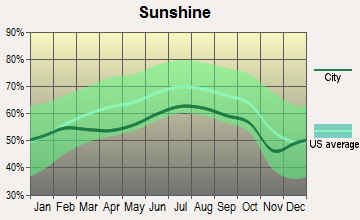
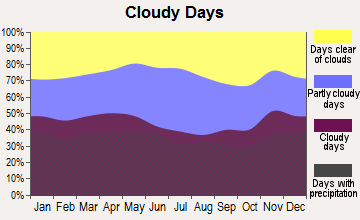
Average climate in Amesbury, Massachusetts
Based on data reported by over 4,000 weather stations
|
|

(lower is better)
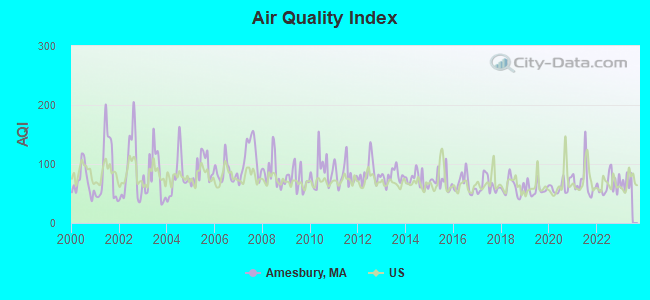
Air Quality Index (AQI) level in 2022 was 65.2. This is about average.
| City: | 65.2 |
| U.S.: | 72.6 |
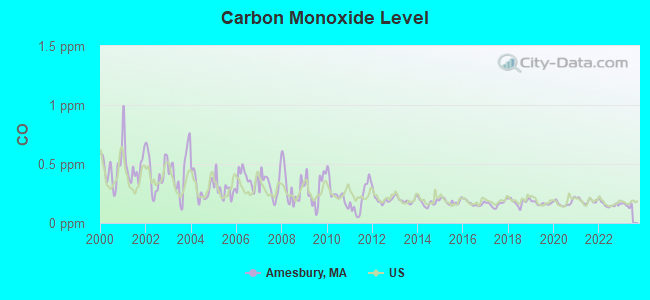
Carbon Monoxide (CO) [ppm] level in 2022 was 0.157. This is significantly better than average. Closest monitor was 17.4 miles away from the city center.
| City: | 0.157 |
| U.S.: | 0.251 |
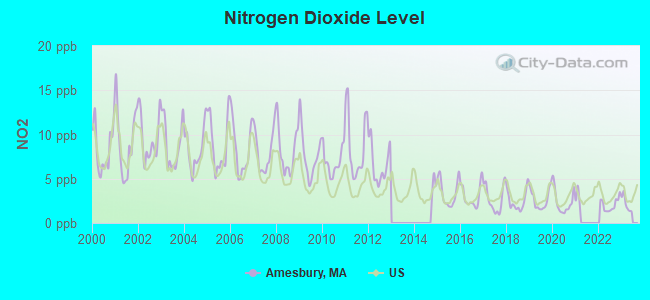
Nitrogen Dioxide (NO2) [ppb] level in 2022 was 2.05. This is significantly better than average. Closest monitor was 3.7 miles away from the city center.
| City: | 2.05 |
| U.S.: | 5.11 |
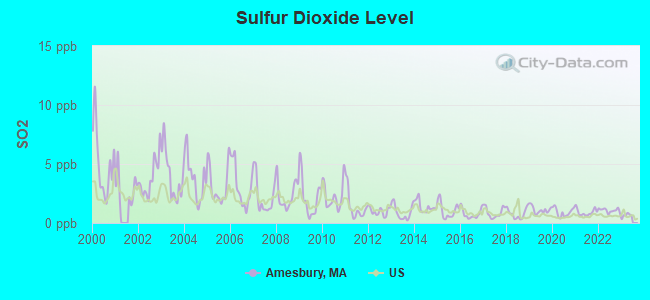
Sulfur Dioxide (SO2) [ppb] level in 2022 was 1.07. This is significantly better than average. Closest monitor was 3.7 miles away from the city center.
| City: | 1.07 |
| U.S.: | 1.51 |
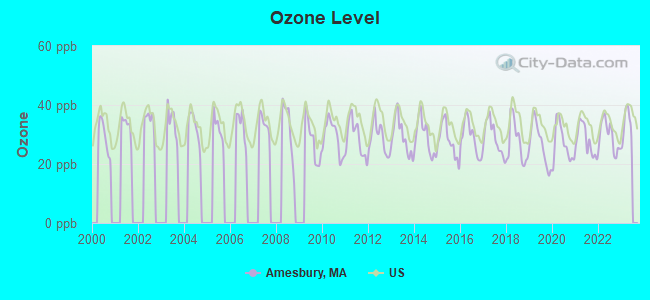
Ozone [ppb] level in 2022 was 29.5. This is about average. Closest monitor was 6.6 miles away from the city center.
| City: | 29.5 |
| U.S.: | 33.3 |
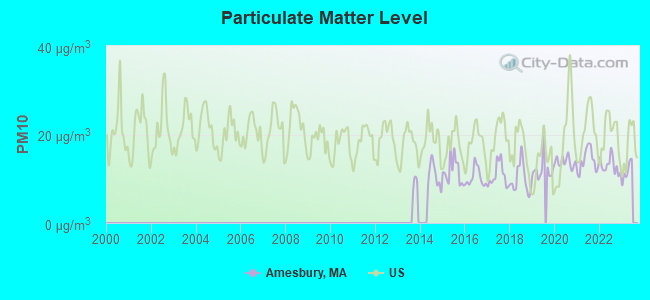
Particulate Matter (PM10) [µg/m3] level in 2022 was 13.0. This is significantly better than average. Closest monitor was 15.0 miles away from the city center.
| City: | 13.0 |
| U.S.: | 19.2 |
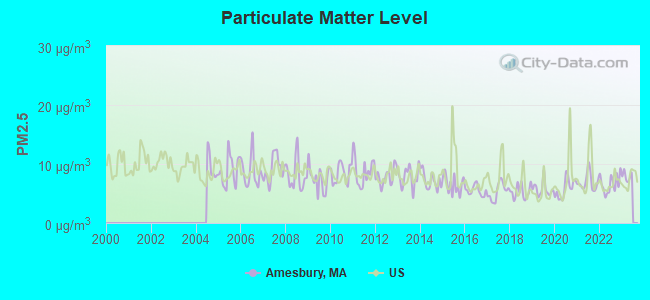
Particulate Matter (PM2.5) [µg/m3] level in 2022 was 6.63. This is better than average. Closest monitor was 10.6 miles away from the city center.
| City: | 6.63 |
| U.S.: | 8.11 |
Tornado activity:
Amesbury-area historical tornado activity is slightly below Massachusetts state average. It is 49% smaller than the overall U.S. average.
On 6/9/1953, a category F3 (max. wind speeds 158-206 mph) tornado 8.2 miles away from the Amesbury place center injured 5 people and caused between $5000 and $50,000 in damages.
On 9/29/1974, a category F3 tornado 21.4 miles away from the place center injured one person and caused between $50,000 and $500,000 in damages.
Earthquake activity:
Amesbury-area historical earthquake activity is significantly above Massachusetts state average. It is 73% smaller than the overall U.S. average.On 4/20/2002 at 10:50:47, a magnitude 5.3 (5.3 ML, Depth: 3.0 mi, Class: Moderate, Intensity: VI - VII) earthquake occurred 179.7 miles away from the city center
On 10/16/2012 at 23:12:25, a magnitude 4.7 (4.7 ML, Depth: 10.0 mi, Class: Light, Intensity: IV - V) earthquake occurred 53.1 miles away from Amesbury center
On 1/19/1982 at 00:14:42, a magnitude 4.7 (4.5 MB, 4.7 MD, 4.5 LG) earthquake occurred 56.0 miles away from the city center
On 10/7/1983 at 10:18:46, a magnitude 5.3 (5.1 MB, 5.3 LG, 5.1 ML) earthquake occurred 187.6 miles away from the city center
On 4/20/2002 at 10:50:47, a magnitude 5.2 (5.2 MB, 4.2 MS, 5.2 MW, 5.0 MW) earthquake occurred 179.5 miles away from Amesbury center
On 8/22/1992 at 12:20:32, a magnitude 4.8 (4.8 MB, 3.8 MS, 4.7 LG, Depth: 6.2 mi) earthquake occurred 261.3 miles away from the city center
Magnitude types: regional Lg-wave magnitude (LG), body-wave magnitude (MB), duration magnitude (MD), local magnitude (ML), surface-wave magnitude (MS), moment magnitude (MW)
Natural disasters:
The number of natural disasters in Essex County (33) is a lot greater than the US average (15).Major Disasters (Presidential) Declared: 20
Emergencies Declared: 13
Causes of natural disasters: Floods: 14, Storms: 11, Hurricanes: 6, Snowstorms: 5, Winter Storms: 5, Snows: 3, Blizzards: 2, Fire: 1, Heavy Rain: 1, Snowfall: 1, Water Main Break: 1, Wind: 1 (Note: some incidents may be assigned to more than one category).

Hospitals and medical centers in Amesbury:
- AMESBURY HOSPITAL (provides emergency services, 24 MORRILL PLACE)
- AMESBURY VILLAGE (22 MAPLE STREET)
- MAPLEWOOD CARE AND REHABILITATION CENTER (6 MORRILL PLACE)
- MAPLEWOOD MANOR NURS HOME (MORILL PLACE)
- MERRIMACK VALLEY NSG AND REH CTR (22 MAPLE ST)
- DSI AMESBURY RENAL CENTER (24 MORRILL PLACE)
- EXCELLA HOMECARE INC (110 HAVERHILL ROAD, SUITE 402)
Airports, heliports and other landing facilities located in Amesbury:
- Meadowbrook Airport (6MA2) (Runways: 1)
- Hat Factory Heliport (MA35)
- Lake Gardner Seaplane Base (6MA0)
Operable nuclear power plant near Amesbury:
- 5 miles: Seabrook in Seabrook, NH.
Colleges/universities with over 2000 students nearest to Amesbury:
- Northern Essex Community College (about 8 miles; Haverhill, MA; Full-time enrollment: 4,737)
- Merrimack College (about 17 miles; North Andover, MA; FT enrollment: 2,734)
- North Shore Community College (about 19 miles; Danvers, MA; FT enrollment: 5,195)
- University of New Hampshire-Main Campus (about 20 miles; Durham, NH; FT enrollment: 15,243)
- Endicott College (about 22 miles; Beverly, MA; FT enrollment: 4,064)
- Salem State University (about 25 miles; Salem, MA; FT enrollment: 8,027)
- University of Massachusetts-Lowell (about 25 miles; Lowell, MA; FT enrollment: 12,341)
Public high schools in Amesbury:
- AMESBURY HIGH (Students: 709, Location: 5 HIGHLAND STREET, Grades: 9-12)
- AMESBURY ACADEMY CHARTER PUBLIC SCHOOL (Location: 71 FRIEND STREET, Grades: 9-12, Charter school)
Private high school in Amesbury:
Public elementary/middle schools in Amesbury:
- AMESBURY MIDDLE (Students: 751, Location: 220 MAIN STREET, Grades: 5-8)
- CHARLES C CASHMAN ELEMENTARY (Students: 530, Location: 193 LIONS MOUTH ROAD, Grades: PK-4)
- AMESBURY ELEMENTARY (Students: 443, Location: 20 SOUTH HAMPTON ROAD, Grades: PK-4)
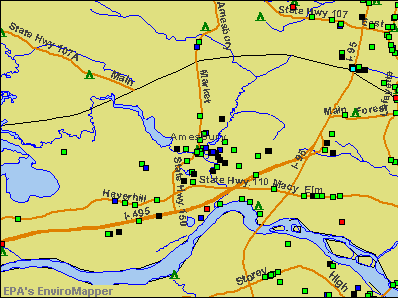
Points of interest:
Notable locations in Amesbury: Amesbury Industrial Park (A), Amesbury Town Landing (B), Atlantic Forest Ski Area (C), Amesbury Country Club (D), Cross Roads Shopping Plaza (E), Amesbury Fire Department Station 1 Headquarters (F), Amesbury Town Hall (G), Cashman Elementary School Library (H), Amesbury Public Library (I), Bartlett Museum (J). Display/hide their locations on the map
Cemeteries: Saint Josephs Cemetery (1), Mount Prospect Cemetery (2), Union Cemetery (3), Salisbury Cemetery (4). Display/hide their locations on the map
Reservoirs: Lake Gardner (A), Bailey Pond (B), Pattens Pond (C), Clarks Pond (D). Display/hide their locations on the map
River: Powwow River (A). Display/hide its location on the map
Parks in Amesbury include: Alliance Park (1), Amesbury and Salisbury Mills Village Historic District (2), Amesbury Town Park (3), Collins Street Playground (4), Batchelder Park (5). Display/hide their locations on the map
Hotel: Fairfield Inn Amesbury (35 Clarks Road).
Court: Lallier Law Office (159 Main Street).
Birthplace of: Don Matthews - Football player and coach, Josiah Bartlett - (1729-1795), a signatory of the Declaration of Independence, Brian Lees - Politician, Ephraim Morse - Railroad executive, Jeffrey Donovan - Film actor, Paine Wingate - Politician, Tom Bannon - Major League Baseball player, Wayne Lucier - 2005 NFL player (New York Giants, born: Dec 5, 1979), Jimmy Bannon - Baseball player and coach, Charles Harold Davis - Artist.
Drinking water stations with addresses in Amesbury and their reported violations in the past:
AMESBURY DPW WATER DIV. (Population served: 16,283, Surface water):Past monitoring violations:
- 2 routine major monitoring violations
- 26 regular monitoring violations
| This place: | 2.5 people |
| Massachusetts: | 2.5 people |
| This place: | 63.0% |
| Whole state: | 65.0% |
| This place: | 7.1% |
| Whole state: | 5.4% |
Likely homosexual households (counted as self-reported same-sex unmarried-partner households)
- Lesbian couples: 0.2% of all households
- Gay men: 0.2% of all households
| This place: | 7.0% |
| Whole state: | 9.3% |
| This place: | 3.3% |
| Whole state: | 4.4% |
People in group quarters in Amesbury in 2000:
- 207 people in nursing homes
- 29 people in homes for the mentally retarded
- 18 people in homes or halfway houses for drug/alcohol abuse
- 14 people in mental (psychiatric) hospitals or wards
- 5 people in residential treatment centers for emotionally disturbed children
- 5 people in homes for the mentally ill
- 4 people in homes for the physically handicapped
- 2 people in religious group quarters
Banks with branches in Amesbury (2011 data):
- Newburyport Five Cents Savings Bank: Amesbury Main Street Branch at 43 Main Street, branch established on 2008/06/12; Amesbury Branch at 40 Friend Street, branch established on 2007/06/25. Info updated 2012/02/07: Bank assets: $634.6 mil, Deposits: $460.4 mil, headquarters in Newburyport, MA, positive income, Commercial Lending Specialization, 7 total offices, Holding Company: Newburyport Five Cents Bancorp Mhc
- The Provident Bank: Haverhill Road Branch at 1 Haverhill Road, branch established on 1988/12/05; at Five Market Street, branch established on 1828/01/01. Info updated 2006/11/03: Bank assets: $530.8 mil, Deposits: $404.6 mil, local headquarters, positive income, Commercial Lending Specialization, 7 total offices, Holding Company: Provident Bancorp
- RBS Citizens, National Association: Amesbury Stop & Shop Branch at 100 Macy Street, branch established on 2002/03/13. Info updated 2007/09/19: Bank assets: $106,940.6 mil, Deposits: $75,690.2 mil, headquarters in Providence, RI, positive income, 1135 total offices, Holding Company: Uk Financial Investments Limited
- TD Bank, National Association: Amesbury Massachusetts Branch at 150 Main Street, branch established on 1973/09/08. Info updated 2010/10/04: Bank assets: $188,912.6 mil, Deposits: $153,149.8 mil, headquarters in Wilmington, DE, positive income, 1314 total offices, Holding Company: Toronto-Dominion Bank, The
For population 15 years and over in Amesbury:
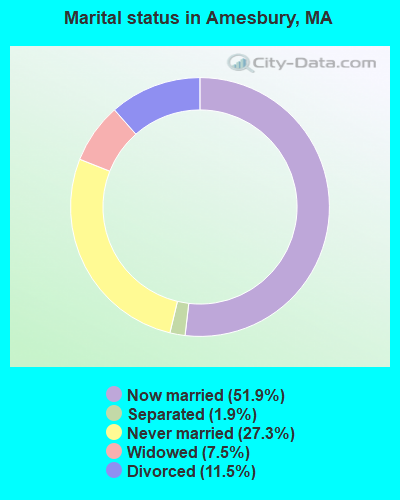
- Never married: 27.3%
- Now married: 51.9%
- Separated: 1.9%
- Widowed: 7.5%
- Divorced: 11.5%
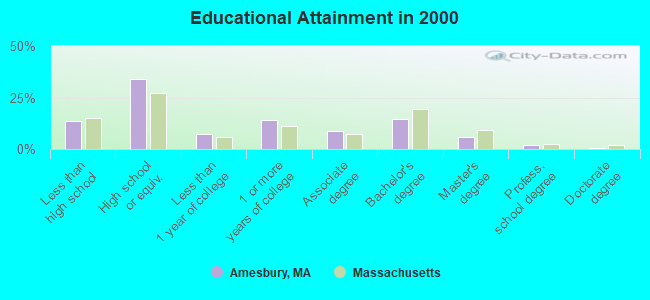
For population 25 years and over in Amesbury:
- High school or higher: 86.6%
- Bachelor's degree or higher: 22.6%
- Graduate or professional degree: 8.2%
- Unemployed: 4.2%
- Mean travel time to work (commute): 27.9 minutes
| Here: | 10.7 |
| Massachusetts average: | 13.1 |
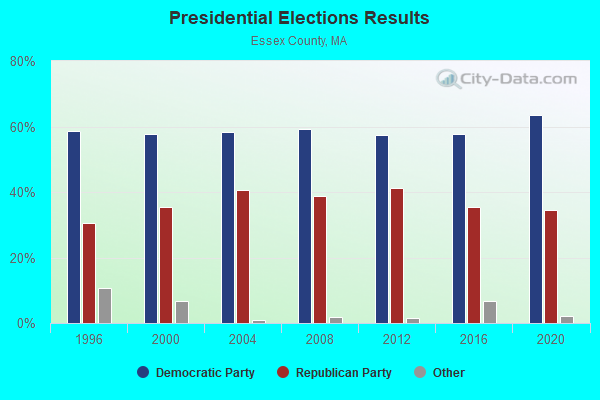
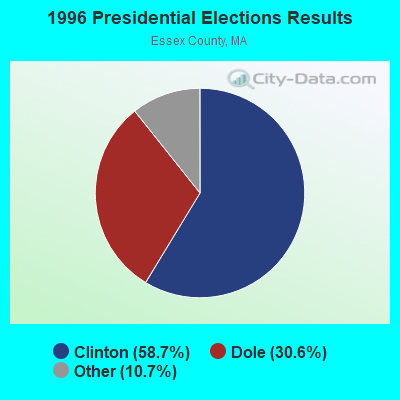
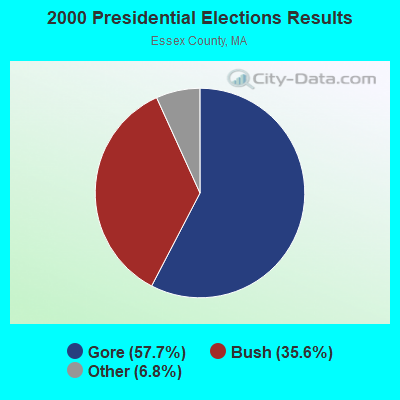
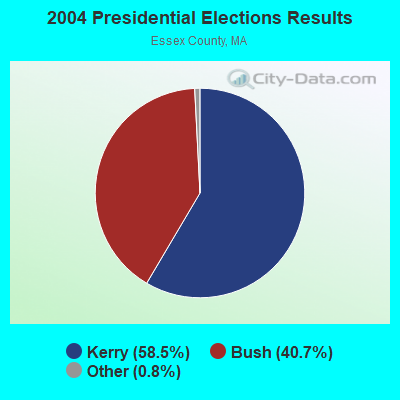
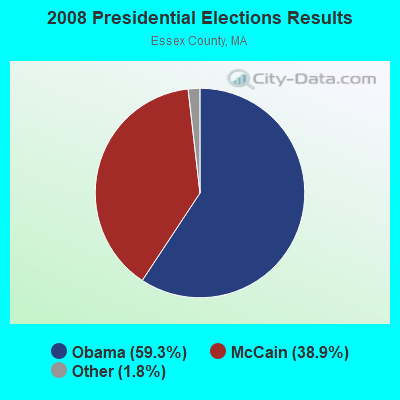
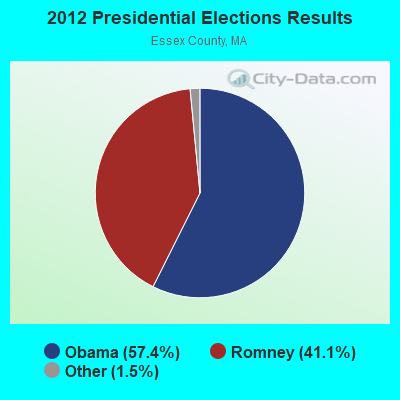
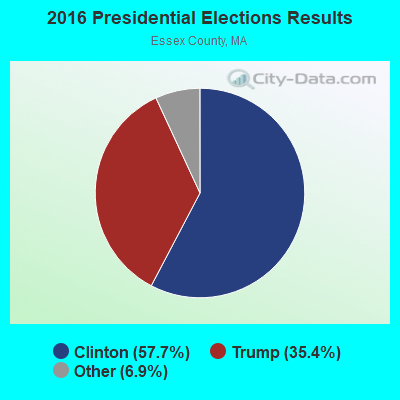
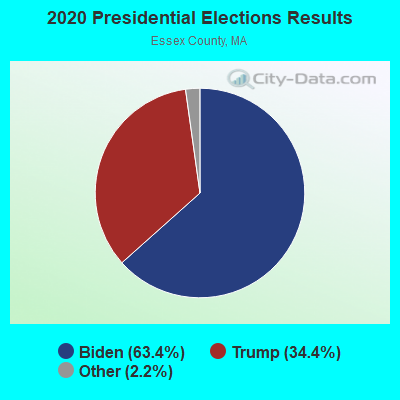
Graphs represent county-level data. Detailed 2008 Election Results
Religion statistics for Amesbury, MA (based on Essex County data)
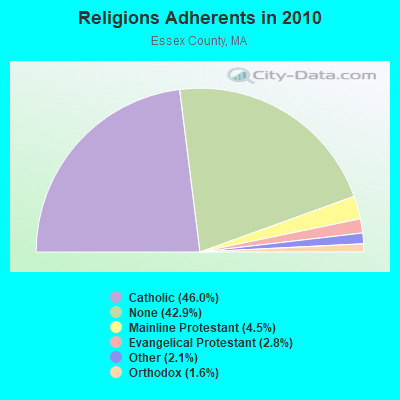
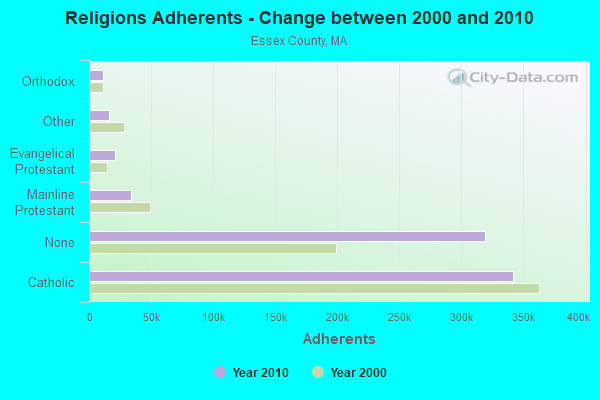
| Religion | Adherents | Congregations |
|---|---|---|
| Catholic | 341,970 | 55 |
| Mainline Protestant | 33,710 | 140 |
| Evangelical Protestant | 20,925 | 160 |
| Other | 15,882 | 63 |
| Orthodox | 11,590 | 13 |
| Black Protestant | 376 | 3 |
| None | 318,706 | - |
Food Environment Statistics:
| Essex County: | 1.98 / 10,000 pop. |
| Massachusetts: | 1.98 / 10,000 pop. |
| This county: | 0.04 / 10,000 pop. |
| State: | 0.05 / 10,000 pop. |
| Essex County: | 1.97 / 10,000 pop. |
| Massachusetts: | 2.22 / 10,000 pop. |
| Essex County: | 1.30 / 10,000 pop. |
| State: | 1.77 / 10,000 pop. |
| Here: | 7.60 / 10,000 pop. |
| State: | 8.76 / 10,000 pop. |
| This county: | 8.4% |
| Massachusetts: | 8.1% |
| Essex County: | 23.7% |
| Massachusetts: | 22.5% |
| This county: | 20.7% |
| State: | 16.5% |
| Local government employment and payroll (March 2022) | |||||
| Function | Full-time employees | Monthly full-time payroll | Average yearly full-time wage | Part-time employees | Monthly part-time payroll |
|---|---|---|---|---|---|
| Elementary and Secondary - Instruction | 334 | $1,855,128 | $66,651 | 38 | $43,127 |
| Elementary and Secondary - Other Total | 36 | $200,441 | $66,814 | 17 | $24,352 |
| Police Protection - Officers | 34 | $239,172 | $84,414 | 0 | $0 |
| Streets and Highways | 28 | $143,721 | $61,595 | 0 | $0 |
| Firefighters | 17 | $94,418 | $66,648 | 1 | $46 |
| Financial Administration | 11 | $61,256 | $66,825 | 0 | $0 |
| Police - Other | 11 | $49,309 | $53,792 | 1 | $4,284 |
| Other Government Administration | 9 | $59,015 | $78,687 | 6 | $4,217 |
| Solid Waste Management | 3 | $12,124 | $48,496 | 0 | $0 |
| Parks and Recreation | 3 | $17,003 | $68,012 | 6 | $3,159 |
| Welfare | 3 | $16,772 | $67,088 | 0 | $0 |
| Fire - Other | 2 | $16,606 | $99,636 | 0 | $0 |
| Other and Unallocable | 2 | $8,599 | $51,594 | 0 | $0 |
| Airports | 0 | $0 | 2 | $7,387 | |
| Totals for Government | 493 | $2,773,564 | $67,511 | 71 | $86,572 |
5.09% of this county's 2021 resident taxpayers lived in other counties in 2020 ($96,821 average adjusted gross income)
| Here: | 5.09% |
| Massachusetts average: | 6.35% |
0.01% of residents moved from foreign countries ($21 average AGI)
Essex County: 0.01% Massachusetts average: 0.01%
Top counties from which taxpayers relocated into this county between 2020 and 2021:
| from Middlesex County, MA | |
| from Suffolk County, MA | |
| from Rockingham County, NH |
5.47% of this county's 2020 resident taxpayers moved to other counties in 2021 ($95,440 average adjusted gross income)
| Here: | 5.47% |
| Massachusetts average: | 7.18% |
0.01% of residents moved to foreign countries ($53 average AGI)
Essex County: 0.01% Massachusetts average: 0.02%
Top counties to which taxpayers relocated from this county between 2020 and 2021:
| to Middlesex County, MA | |
| to Rockingham County, NH | |
| to Suffolk County, MA |
| Businesses in Amesbury, MA | ||||
| Name | Count | Name | Count | |
|---|---|---|---|---|
| AT&T | 1 | Marriott | 1 | |
| Burger King | 1 | MasterBrand Cabinets | 3 | |
| CVS | 1 | McDonald's | 1 | |
| Chevrolet | 1 | Rite Aid | 1 | |
| Circle K | 1 | Stop & Shop | 1 | |
| Dunkin Donuts | 1 | Subway | 1 | |
| FedEx | 3 | True Value | 1 | |
| H&R Block | 1 | UPS | 3 | |
Strongest AM radio stations in Amesbury:
- WRKO (680 AM; 50 kW; BOSTON, MA; Owner: ENTERCOM BOSTON LICENSE, LLC)
- WNBP (1450 AM; 1 kW; NEWBURYPORT, MA; Owner: RADIO NEWBURYPORT, LLC)
- WGIP (1540 AM; 5 kW; EXETER, NH; Owner: CAPSTAR TX LIMITED PARTNERSHIP)
- WEEI (850 AM; 50 kW; BOSTON, MA; Owner: ENTERCOM BOSTON LICENSE, LLC)
- WBZ (1030 AM; 50 kW; BOSTON, MA; Owner: INFINITY BROADCASTING OPERATIONS, INC.)
- WWZN (1510 AM; 50 kW; BOSTON, MA; Owner: ROSE CITY RADIO CORPORATION)
- WDER (1320 AM; 10 kW; DERRY, NH; Owner: BLOUNT COMMUNICATIONS, INC. OF NH)
- WKOX (1200 AM; 50 kW; FRAMINGHAM, MA; Owner: CAPSTAR TX LIMITED PARTNERSHIP)
- WBIX (1060 AM; 40 kW; NATICK, MA; Owner: LANGER BROADCASTING CORPORATION)
- WCRN (830 AM; 50 kW; WORCESTER, MA; Owner: CARTER BROADCASTING CORPORATION)
- WCEC (1110 AM; daytime; 5 kW; SALEM, NH; Owner: COSTA-EAGLE RADIO VENTURES LTD PARTNERSHIP)
- WRCA (1330 AM; 25 kW; WALTHAM, MA; Owner: WRCA LICENSE, LLC)
- WGIN (930 AM; 10 kW; ROCHESTER, NH; Owner: CAPSTAR TX LIMITED PARTNERSHIP)
Strongest FM radio stations in Amesbury:
- WNEF (91.7 FM; NEWBURYPORT, MA; Owner: UNIVERSITY OF MASSACHUSETTS)
- WSAK (102.1 FM; HAMPTON, NH; Owner: CITADEL BROADCASTING COMPANY)
- WXRV (92.5 FM; HAVERHILL, MA; Owner: BEANPOT BROADCASTING CORP.)
- WERZ (107.1 FM; EXETER, NH; Owner: CAPSTAR TX LIMITED PARTNERSHIP)
- WKLB-FM (99.5 FM; LOWELL, MA; Owner: GREATER BOSTON RADIO, INC.)
- WHEB (100.3 FM; PORTSMOUTH, NH; Owner: CAPSTAR TX LIMITED PARTNERSHIP)
- W227AM (93.3 FM; ANDOVER, MA; Owner: GREATER BOSTON RADIO, INC.)
- WQSX (93.7 FM; LAWRENCE, MA; Owner: ENTERCOM BOSTON LICENSE, LLC)
- WXKS-FM (107.9 FM; MEDFORD, MA; Owner: AMFM RADIO LICENSES, L.L.C.)
- WMJX (106.7 FM; BOSTON, MA; Owner: GREATER BOSTON RADIO, INC.)
- WGIR-FM (101.1 FM; MANCHESTER, NH; Owner: CAPSTAR TX LIMITED PARTNERSHIP)
- WQLL (96.5 FM; BEDFORD, NH; Owner: SAGA COMMUNICATIONS OF NEW ENGLAND, LLC)
- WBMX (98.5 FM; BOSTON, MA; Owner: INFINITY RADIO OPERATIONS INC.)
- WLMW (90.7 FM; MANCHESTER, NH; Owner: KNOWLEDGE FOR LIFE)
- WJMN (94.5 FM; BOSTON, MA; Owner: AMFM RADIO LICENSES, L.L.C.)
- WCRB (102.5 FM; WALTHAM, MA; Owner: CHARLES RIVER BROADCASTING WCRB LICE)
- WTKK (96.9 FM; BOSTON, MA; Owner: GREATER BOSTON RADIO, INC.)
- WZID (95.7 FM; MANCHESTER, NH; Owner: SAGA COMMUNICATIONS OF NEW ENGLAND, LLC)
- WBOS (92.9 FM; BROOKLINE, MA; Owner: GREATER BOSTON RADIO, INC.)
- WROR-FM (105.7 FM; FRAMINGHAM, MA; Owner: GREATER BOSTON RADIO, INC.)
TV broadcast stations around Amesbury:
- WHDN-LP (Channel 26; BOSTON, MA; Owner: GUENTER MARKSTEINER)
- WFXZ-CA (Channel 24; BOSTON, MA; Owner: BOSTON BROADCASTING CORP.)
- WMEA-TV (Channel 26; BIDDEFORD, ME; Owner: MAINE PUBLIC BROADCASTING CORP.)
- WCVB-TV (Channel 5; BOSTON, MA; Owner: WCVB HEARST-ARGYLE TV, INC.)
- WGBH-TV (Channel 2; BOSTON, MA; Owner: WGBH EDUCATIONAL FOUNDATION)
- WHDH-TV (Channel 7; BOSTON, MA; Owner: WHDH-TV)
- WMFP (Channel 62; LAWRENCE, MA; Owner: WSAH LICENSE, INC.)
- WSBK-TV (Channel 38; BOSTON, MA; Owner: VIACOM INC.)
- WLVI-TV (Channel 56; CAMBRIDGE, MA; Owner: WLVI, INC.)
- WBZ-TV (Channel 4; BOSTON, MA; Owner: VIACOM INC.)
- WGBX-TV (Channel 44; BOSTON, MA; Owner: WGBH EDUCATIONAL FOUNDATION)
- WBPX (Channel 68; BOSTON, MA; Owner: PAXSON BOSTON-68 LICENSE, INC.)
- WFXT (Channel 25; BOSTON, MA; Owner: FOX TELEVISION STATIONS INC.)
- WUTF (Channel 66; MARLBOROUGH, MA; Owner: TELEFUTURA BOSTON LLC)
- WENH-TV (Channel 11; DURHAM, NH; Owner: UNIVERSITY OF NEW HAMPSHIRE)
- WTMU-LP (Channel 32; BOSTON, MA; Owner: ZGS BOSTON, INC.)
- WCEA-LP (Channel 58; BOSTON, MA; Owner: CHANNEL 19 TV CORPORATION)
- WNDS (Channel 50; DERRY, NH; Owner: CTV OF DERRY, INC)
- W40BO (Channel 40; BOSTON, MA; Owner: PAXSON COMMUNICATIONS LPTV, INC.)
- National Bridge Inventory (NBI) Statistics
- 30Number of bridges
- 545ft / 166mTotal length
- $61,662,000Total costs
- 818,394Total average daily traffic
- 72,386Total average daily truck traffic
- 992,086Total future (year 2031) average daily traffic
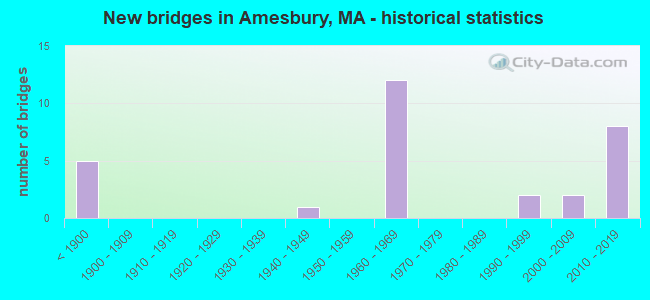
- New bridges - historical statistics
- 5Before 1900
- 11940-1949
- 121960-1969
- 21990-1999
- 22000-2009
- 82010-2019
FCC Registered Cell Phone Towers:
1 (See the full list of FCC Registered Cell Phone Towers in Amesbury)FCC Registered Antenna Towers:
27 (See the full list of FCC Registered Antenna Towers)FCC Registered Private Land Mobile Towers:
7 (See the full list of FCC Registered Private Land Mobile Towers in Amesbury, MA)FCC Registered Broadcast Land Mobile Towers:
8 (See the full list of FCC Registered Broadcast Land Mobile Towers)FCC Registered Microwave Towers:
10 (See the full list of FCC Registered Microwave Towers in this town)FCC Registered Paging Towers:
10 (See the full list of FCC Registered Paging Towers)FCC Registered Amateur Radio Licenses:
63 (See the full list of FCC Registered Amateur Radio Licenses in Amesbury)FAA Registered Aircraft:
6- Aircraft: PIPER PA-28-161 (Category: Land, Seats: 4, Weight: Up to 12,499 Pounds, Speed: 108 mph), Engine: LYCOMING 0-320 SERIES (180 HP) (Reciprocating)
N-Number: 2117E, N2117E, N-2117E, Serial Number: 28-7916163, Year manufactured: 1978, Airworthiness Date: 11/10/1978, Certificate Issue Date: 02/09/2009
Registrant (Individual): William D Smith, 51 Fern Ave, Amesbury, MA 01913 - Aircraft: PIPER J3C-50 (Category: Land, Seats: 2, Weight: Up to 12,499 Pounds, Speed: 67 mph), Engine: CONT MOTOR C85 SERIES (85 HP) (Reciprocating)
N-Number: 23267, N23267, N-23267, Serial Number: 3033, Year manufactured: 1939, Airworthiness Date: 07/20/1981, Certificate Issue Date: 07/24/2012
Registrant (Individual): Scott W Sr Scherbon, 40 Haverhill Rd, Amesbury, MA 01913 - Aircraft: PIPER J3C-65 (Category: Land, Seats: 2, Weight: Up to 12,499 Pounds, Speed: 67 mph), Engine: Reciprocating
N-Number: 343WS, N343WS, N-343WS, Serial Number: 18086, Certificate Issue Date: 09/07/2012
Registrant (Individual): Scott W Sr Scherbon, 40 Haverhill Rd, Amesbury, MA 01913
Deregistered: Cancel Date: 08/02/2005, Exported to: Switzerland - Aircraft: PIPER PA-17 (Category: Land, Seats: 2, Weight: Up to 12,499 Pounds, Speed: 75 mph), Engine: CONT MOTOR A&C65 SERIES (65 HP) (Reciprocating)
N-Number: 4676H, N4676H, N-4676H, Serial Number: 17-77, Year manufactured: 1948, Airworthiness Date: 06/10/1956, Certificate Issue Date: 02/09/2010
Registrant (Individual): Daniel P Lavalley, 5 Meadowbrook Rd, Amesbury, MA 01913 - Aircraft: PIPER PA-24-260 (Category: Land, Seats: 4, Weight: Up to 12,499 Pounds, Speed: 135 mph), Engine: LYCOMING TI0-540 SER (310 HP) (Reciprocating)
N-Number: 9088P, N9088P, N-9088P, Serial Number: 24-4561, Year manufactured: 1966, Certificate Issue Date: 08/22/2005
Registrant (Individual): Laurie E Legrand, 25 Cedar St Unit 10, Amesbury, MA 01913 - Aircraft: CESSNA 310 (Category: Land, Engines: 2, Seats: 5, Weight: Up to 12,499 Pounds, Speed: 167 mph), Engine: CONT MOTOR O-470 SERIES (230 HP) (Reciprocating)
N-Number: 310PA, N310PA, N-310PA, Serial Number: 35235, Year manufactured: 1955, Airworthiness Date: 12/15/1955, Certificate Issue Date: 10/28/1997
Registrant (Co-Owned): Kenneth R Harris, 137 Pleasant Valley Rd, Amesbury, MA 01913, Other Owners: Anita S Harris
Deregistered: Cancel Date: 07/21/2017
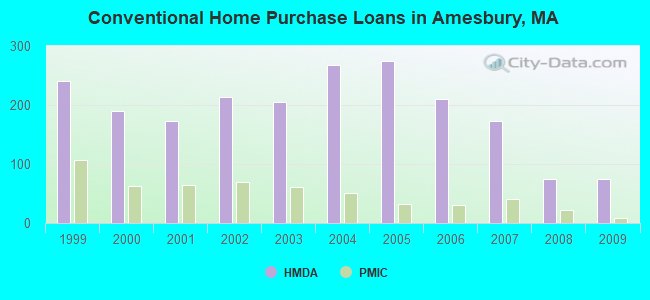
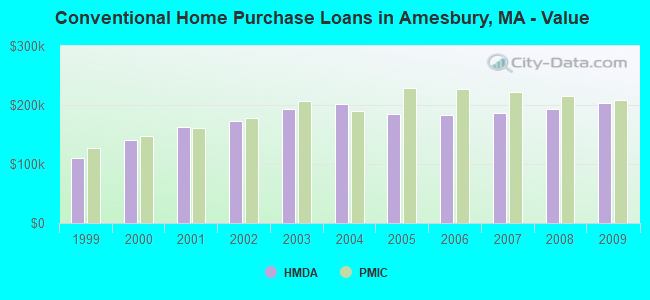
| Home Mortgage Disclosure Act Aggregated Statistics For Year 2009 (Based on 1 full and 2 partial tracts) | ||||||||||||||
| A) FHA, FSA/RHS & VA Home Purchase Loans | B) Conventional Home Purchase Loans | C) Refinancings | D) Home Improvement Loans | E) Loans on Dwellings For 5+ Families | F) Non-occupant Loans on < 5 Family Dwellings (A B C & D) | G) Loans On Manufactured Home Dwelling (A B C & D) | ||||||||
|---|---|---|---|---|---|---|---|---|---|---|---|---|---|---|
| Number | Average Value | Number | Average Value | Number | Average Value | Number | Average Value | Number | Average Value | Number | Average Value | Number | Average Value | |
| LOANS ORIGINATED | 44 | $234,520 | 74 | $202,601 | 241 | $220,034 | 19 | $113,052 | 2 | $289,500 | 13 | $237,208 | 0 | $0 |
| APPLICATIONS APPROVED, NOT ACCEPTED | 4 | $193,250 | 2 | $168,160 | 23 | $236,572 | 0 | $0 | 0 | $0 | 0 | $0 | 0 | $0 |
| APPLICATIONS DENIED | 6 | $219,487 | 12 | $132,004 | 79 | $231,856 | 7 | $66,623 | 0 | $0 | 4 | $267,055 | 1 | $42,620 |
| APPLICATIONS WITHDRAWN | 3 | $269,780 | 6 | $176,510 | 66 | $232,617 | 3 | $239,963 | 0 | $0 | 3 | $204,603 | 0 | $0 |
| FILES CLOSED FOR INCOMPLETENESS | 1 | $133,000 | 1 | $155,010 | 21 | $232,785 | 0 | $0 | 0 | $0 | 1 | $254,100 | 0 | $0 |
Detailed HMDA statistics for the following Tracts: 2662.00 , 2663.00, 2664.00
| Private Mortgage Insurance Companies Aggregated Statistics For Year 2009 (Based on 1 full and 2 partial tracts) | ||||
| A) Conventional Home Purchase Loans | B) Refinancings | |||
|---|---|---|---|---|
| Number | Average Value | Number | Average Value | |
| LOANS ORIGINATED | 9 | $207,921 | 6 | $297,498 |
| APPLICATIONS APPROVED, NOT ACCEPTED | 3 | $233,250 | 3 | $191,803 |
| APPLICATIONS DENIED | 1 | $83,040 | 4 | $245,382 |
| APPLICATIONS WITHDRAWN | 2 | $191,660 | 0 | $0 |
| FILES CLOSED FOR INCOMPLETENESS | 0 | $0 | 0 | $0 |
Detailed PMIC statistics for the following Tracts: 2662.00 , 2663.00, 2664.00
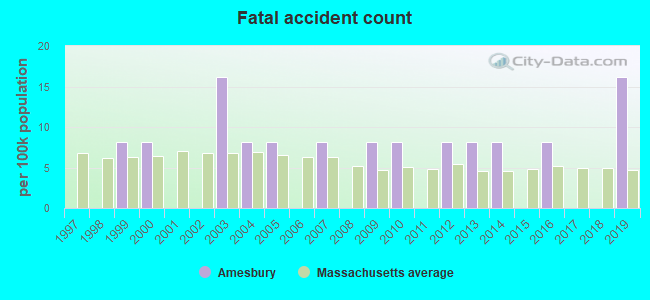
2002 - 2018 National Fire Incident Reporting System (NFIRS) incidents
- Fire incident types reported to NFIRS in Amesbury, MA
- 54356.2%Structure Fires
- 25226.1%Outside Fires
- 11712.1%Mobile Property/Vehicle Fires
- 555.7%Other
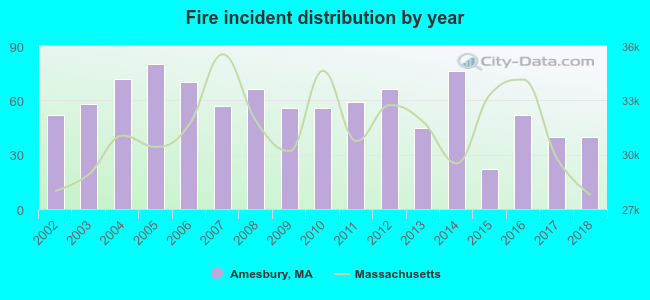 Based on the data from the years 2002 - 2018 the average number of fire incidents per year is 57. The highest number of fires - 80 took place in 2005, and the least - 22 in 2015. The data has a dropping trend.
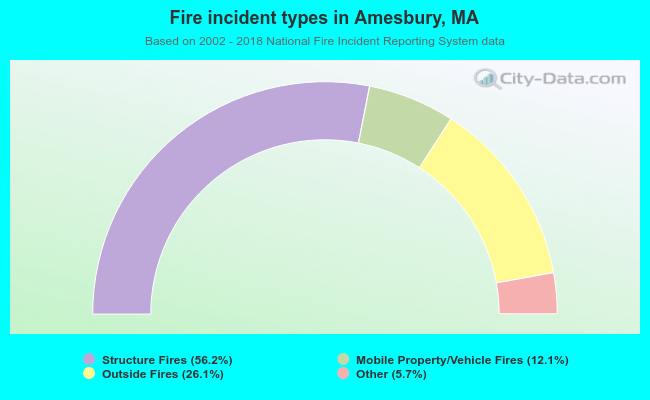 When looking into fire subcategories, the most reports belonged to: Structure Fires (56.2%), and Outside Fires (26.1%).
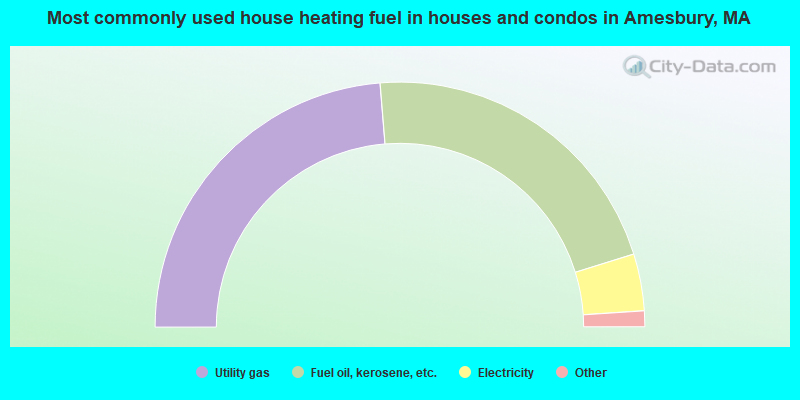
- 47.4%Utility gas
- 43.0%Fuel oil, kerosene, etc.
- 7.5%Electricity
- 1.6%Wood
- 0.5%Other fuel
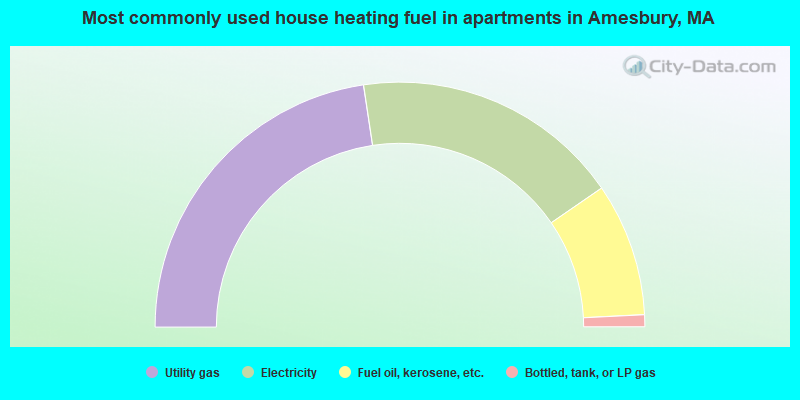
- 45.3%Utility gas
- 35.6%Electricity
- 17.6%Fuel oil, kerosene, etc.
- 1.6%Bottled, tank, or LP gas
Amesbury compared to Massachusetts state average:
- Unemployed percentage significantly below state average.
- Black race population percentage significantly below state average.
- Hispanic race population percentage significantly below state average.
- Foreign-born population percentage significantly below state average.
- Renting percentage significantly below state average.
- Length of stay since moving in significantly above state average.
- Number of rooms per house significantly below state average.
- House age significantly below state average.
- Institutionalized population percentage significantly above state average.
Amesbury on our top lists:
- #19 on the list of "Top 101 cities with largest percentage of females in industries: recyclable material merchant wholesalers (population 5,000+)"
- #37 on the list of "Top 101 cities with largest percentage of males in industries: electrical and electronic goods merchant wholesalers (population 5,000+)"
- #38 on the list of "Top 101 cities with largest percentage of males in industries: miscellaneous manufacturing (population 5,000+)"
- #46 on the list of "Top 101 cities with largest percentage of males in occupations: bookkeeping, accounting, and auditing clerks (population 5,000+)"
- #46 on the list of "Top 101 cities with largest percentage of females in industries: radio, tv, and computer stores (population 5,000+)"
- #48 on the list of "Top 101 cities with largest percentage of females in occupations: supervisors of transportation and material moving workers (population 5,000+)"
- #48 on the list of "Top 101 cities with largest percentage of males in industries: apparel (population 5,000+)"
- #53 on the list of "Top 101 cities with largest percentage of females in industries: health care (population 5,000+)"
- #63 on the list of "Top 101 cities with largest percentage of males in industries: social assistance (population 5,000+)"
- #65 on the list of "Top 101 cities with largest percentage of males in industries: computer and electronic products (population 5,000+)"
- #78 on the list of "Top 101 cities with largest percentage of females in occupations: art and design workers (population 5,000+)"
- #91 on the list of "Top 101 cities with largest percentage of females in occupations: other healthcare support occupations (population 5,000+)"
- #92 on the list of "Top 101 cities with largest percentage of males in industries: drugs, sundries, and chemical and allied products merchant wholesalers (population 5,000+)"
- #98 on the list of "Top 101 cities with largest percentage of females in occupations: nursing, psychiatric, and home health aides (population 5,000+)"
- #100 on the list of "Top 101 cities with largest percentage of females in industries: miscellaneous manufacturing (population 5,000+)"
- #21 on the list of "Top 101 counties with the lowest percentage of residents that keep firearms around their homes"
- #21 on the list of "Top 101 counties with the most Orthodox adherents"
- #23 on the list of "Top 101 counties with the highest carbon monoxide air pollution readings in 2012 (ppm)"
- #30 on the list of "Top 101 counties with the most Catholic adherents"
- #36 on the list of "Top 101 counties with the most Orthodox congregations (pop. 50,000+)"

|
|
Total of 365 patent applications in 2008-2024.