According to our research of New York and other state lists, there was 1 registered sex offender living in Aquebogue, New York as of April 23, 2024. The ratio of all residents to sex offenders in Aquebogue is 1,878 to 1. The ratio of registered sex offenders to all residents in this city is lower than the state average.
Recent articles from our blog. Our writers, many of them Ph.D. graduates or candidates, create easy-to-read articles on a wide variety of topics.
Latest news from Aquebogue, NY collected exclusively by city-data.com from local newspapers, TV, and radio stations
Ancestries: American (30.8%), Irish (18.3%), Italian (16.0%), Polish (5.9%), English (2.8%), Scotch-Irish (2.5%).
Current Local Time: EST time zone
Elevation: 30 feet
Land area: 3.84 square miles.
Population density: 635 people per square mile (low).
67 residents are foreign born (2.4% Latin America, 1.1% Europe).
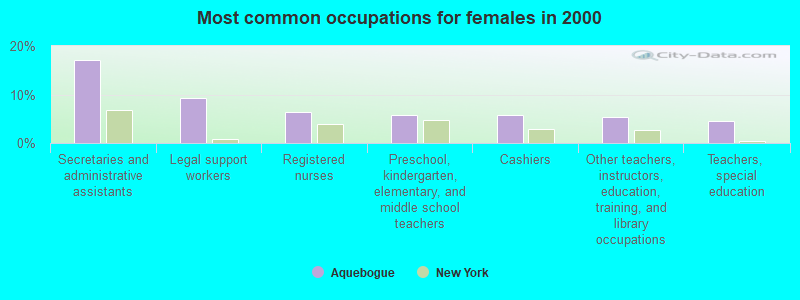
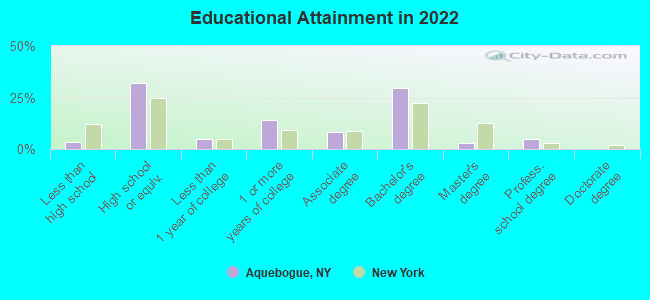
This place:
3.5%
New York:
22.6%
Median real estate property taxes paid for housing units with mortgages in 2022: $10,001 (1.6%) Median real estate property taxes paid for housing units with no mortgage in 2022: $8,555 (1.6%)
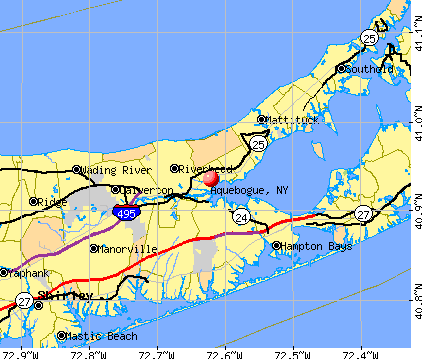
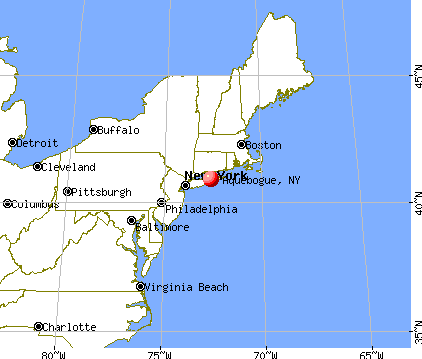
Nearest city with pop. 50,000+: West Haven, CT (29.4 miles , pop. 52,360).
Nearest city with pop. 200,000+: North Hempstead, NY (55.8 miles , pop. 222,611).
Nearest city with pop. 1,000,000+: Queens, NY (64.6 miles , pop. 2,229,379).
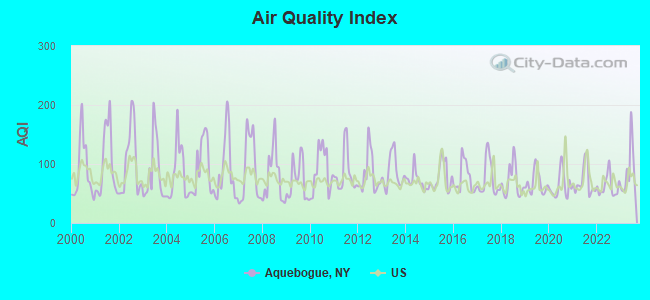
Air Quality Index (AQI) level in 2023 was 87.8. This is worse than average.
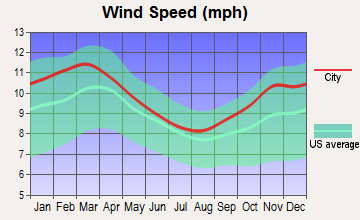
City:
87.8
U.S.:
72.6
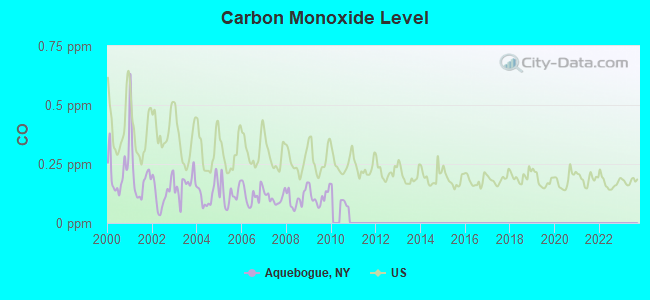
Carbon Monoxide (CO) [ppm] level in 2009 was 0.112. This is significantly better than average.Closest monitor was 24.0 miles away from the city center.
City:
0.112
U.S.:
0.251
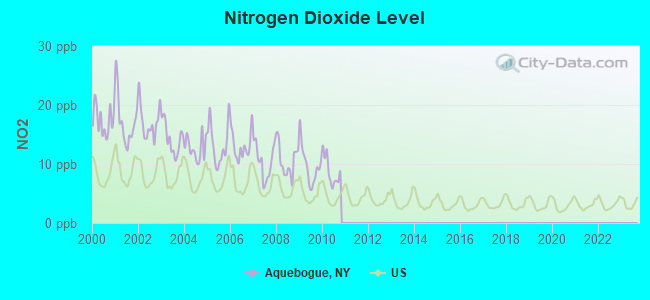
Nitrogen Dioxide (NO2) [ppb] level in 2010 was 8.78. This is significantly worse than average.Closest monitor was 2.8 miles away from the city center.
City:
8.78
U.S.:
5.11
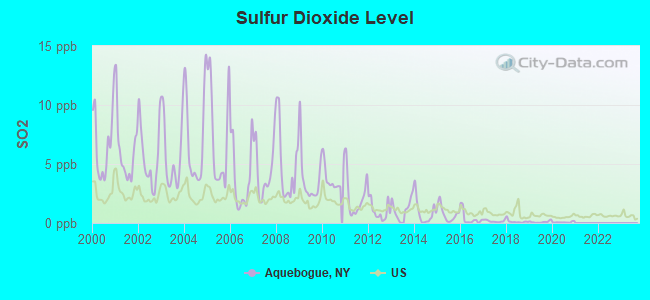
Sulfur Dioxide (SO2) [ppb] level in 2020 was 0.0629. This is significantly better than average.Closest monitor was 2.8 miles away from the city center.
City:
0.0629
U.S.:
1.5147
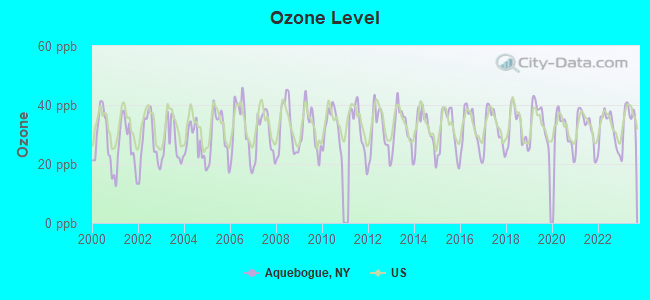
Ozone [ppb] level in 2023 was 35.2. This is about average.Closest monitor was 5.1 miles away from the city center.
City:
35.2
U.S.:
33.3
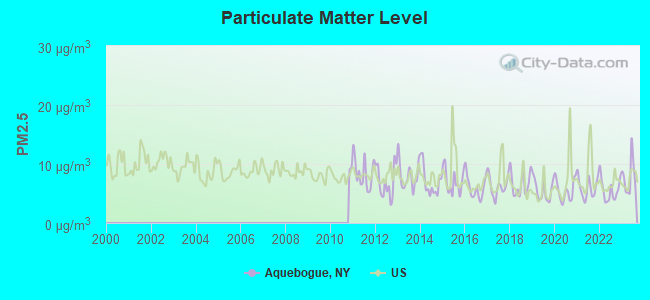
Particulate Matter (PM2.5) [µg/m3] level in 2023 was 7.79. This is about average.There were 0 monitors within city limits.
City:
7.79
U.S.:
8.11
Tornado activity:
Aquebogue-area historical tornado activity is near New York state average. It is 64% smaller than the overall U.S. average.
On 7/10/1989, a category F4 (max. wind speeds 207-260 mph) tornado 30.8 miles away from the Aquebogue place center injured 40 peopleand causedbetween $50,000,000 and $500,000,000 in damages.
On 8/8/1999, a category F2 (max. wind speeds 113-157 mph) tornado 6.9 miles away from the place center injured one personand caused $1 million in damages.
Earthquake activity:
Aquebogue-area historical earthquake activity is significantly above New York state average. It is 72% smaller than the overall U.S. average.
On 10/7/1983 at 10:18:46, a magnitude 5.3 (5.1 MB, 5.3 LG, 5.1 ML, Class: Moderate, Intensity: VI - VII) earthquake occurred 226.4 miles away from Aquebogue center On 4/20/2002 at 10:50:47, a magnitude 5.3 (5.3 ML, Depth: 3.0 mi) earthquake occurred 253.4 miles away from the city center On 8/23/2011 at 17:51:04, a magnitude 5.8 (5.8 MW, Depth: 3.7 mi) earthquake occurred 352.7 miles away from Aquebogue center On 4/20/2002 at 10:50:47, a magnitude 5.2 (5.2 MB, 4.2 MS, 5.2 MW, 5.0 MW) earthquake occurred 251.9 miles away from Aquebogue center On 8/22/1992 at 12:20:32, a magnitude 4.8 (4.8 MB, 3.8 MS, 4.7 LG, Depth: 6.2 mi, Class: Light, Intensity: IV - V) earthquake occurred 175.7 miles away from the city center On 1/19/1982 at 00:14:42, a magnitude 4.7 (4.5 MB, 4.7 MD, 4.5 LG) earthquake occurred 184.9 miles away from Aquebogue center Magnitude types: regional Lg-wave magnitude (LG), body-wave magnitude (MB), duration magnitude (MD), local magnitude (ML), surface-wave magnitude (MS), moment magnitude (MW)
Natural disasters:
The number of natural disasters in Suffolk County (28) is a lot greater than the US average (15). Major Disasters (Presidential) Declared: 19 Emergencies Declared: 7
Causes of natural disasters: Hurricanes: 9, Floods: 7, Storms: 7, Snowstorms: 4, Winter Storms: 3, Blizzards: 2, Heavy Rain: 1, Power Outage: 1, Tropical Depression: 1, Tropical Storm: 1, Water Shortage: 1, Other: 3 (Note: some incidents may be assigned to more than one category).
Hospitals and medical centers near Aquebogue:
GENTIVA HEALTH SVS HAUPPAUGE - RIVERHEAD SUB-UNIT (Home Health Center, about 2 miles away; RIVERHEAD, NY)
PECONIC BAY HOMEHEALTH SVS (Home Health Center, about 3 miles away; RIVERHEAD, NY)
PECONIC BAY MEDICAL CENTER Acute Care Hospitals (about 3 miles away; RIVERHEAD, NY)
PECONIC BAY SKILLED NURSING FACILITY (Nursing Home, about 3 miles away; RIVERHEAD, NY)
EAST END DIALYSIS MANAGEMENT LLC (Dialysis Facility, about 3 miles away; RIVERHEAD, NY)
AID TO THE DEVELOPMENTALLY DISABLED, INC (Hospital, about 4 miles away; RIVERHEAD, NY)
RIVERHEAD CARE CENTER L L C (Nursing Home, about 4 miles away; RIVERHEAD, NY)
Colleges/universities with over 2000 students nearest to Aquebogue:
Suffolk County Community College (about 24 miles; Selden, NY; Full-time enrollment: 18,540)
Stony Brook University (about 27 miles; Stony Brook, NY; FT enrollment: 22,071)
Gateway Community College (about 31 miles; New Haven, CT; FT enrollment: 4,672)
University of New Haven (about 31 miles; West Haven, CT; FT enrollment: 6,205)
Yale University (about 31 miles; New Haven, CT; FT enrollment: 13,121)
Dowling College (about 32 miles; Oakdale, NY; FT enrollment: 2,598)
Porter and Chester Institute of Stratford (about 32 miles; Stratford, CT; FT enrollment: 2,822)
Churches in Aquebogue include: Old Steeple Community Church (A), Our Redeemer Lutheran Church (B), Living Water Full Gospel Church (C). Display/hide their locations on the map
Birthplace of: Edward Danforth Hale - Music educator.
Suffolk County has a predicted average indoor radon screening level less than 2 pCi/L (pico curies per liter) - Low Potential
Drinking water stations with addresses in Aquebogue that have no violations reported:
PALMER VINEYARD (Population served: 100,Primary Water Source Type: Groundwater)
Average household size:
This place:
2.6 people
New York:
2.6 people
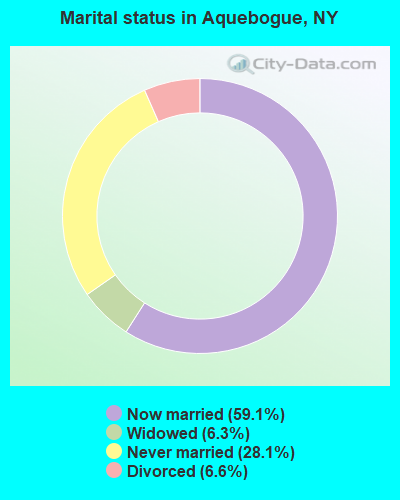
Percentage of family households:
This place:
68.9%
Whole state:
63.5%
Percentage of households with unmarried partners:
This place:
7.0%
Whole state:
6.8%
Likely homosexual households (counted as self-reported same-sex unmarried-partner households)
Lesbian couples: 0.8% of all households
Gay men: 0.8% of all households
20 people in group homes intended for adults in 2010
5 people in residential treatment centers for adults in 2010
9 people in homes for the mentally ill in 2000
Religion statistics for Aquebogue, NY (based on Suffolk County data)
Religion
Adherents
Congregations
Catholic
879,457
75
Mainline Protestant
69,205
182
Evangelical Protestant
58,909
264
Other
50,771
124
Orthodox
10,190
10
Black Protestant
8,298
49
None
416,520
-
Source: Clifford Grammich, Kirk Hadaway, Richard Houseal, Dale E.Jones, Alexei Krindatch, Richie Stanley and Richard H.Taylor. 2012. 2010 U.S.Religion Census: Religious Congregations & Membership Study. Association of Statisticians of American Religious Bodies. Jones, Dale E., et al. 2002. Congregations and Membership in the United States 2000. Nashville, TN: Glenmary Research Center. Graphs represent county-level data
Call Sign: KB2TKT, Licensee ID: L00310598, Grant Date: 01/30/1995, Expiration Date: 01/30/2005, Cancellation Date: 01/31/2007, Registrant: William G Burnett, 27 Church Ln, Aquebogue, NY 11931
Call Sign: KG2FN, Licensee ID: L00967376, Grant Date: 01/03/2015, Expiration Date: 02/02/2025, Registrant: Peter G Spaeth, Aquebogue, NY 11931-2624
Call Sign: W2FCH, Grant Date: 10/20/1994, Expiration Date: 10/20/2004, Cancellation Date: 10/21/2006, Registrant: Herbert L Snell, Meetinghouse Creek Rd, Aquebogue, NY 11931
Call Sign: KC2LRP, Licensee ID: L00706088, Grant Date: 06/24/2003, Expiration Date: 06/24/2013, Cancellation Date: 11/14/2012, Certifier: Robert M Rosenthal, Registrant: Robert M Rosenthal, Aquebogue, NY 11931
Call Sign: W2OHM, Previous Call Sign: KC2LRP, Licensee ID: L00706088, Grant Date: 10/12/2022, Expiration Date: 11/14/2032, Certifier: Robert M Rosenthal, Registrant: Robert M Rosenthal, Aquebogue, NY 11931
Call Sign: AC2ZB, Licensee ID: L02263684, Grant Date: 05/06/2019, Expiration Date: 05/06/2029, Cancellation Date: 05/25/2019, Certifier: Keith Menotti, Registrant: Keith Menotti, Aquebogue, NY 11931
Call Sign: K2AOS, Previous Call Sign: AC2ZB, Licensee ID: L02263684, Grant Date: 05/25/2019, Expiration Date: 05/25/2029, Certifier: Keith Menotti, Registrant: Keith Menotti, Aquebogue, NY 11931
FAA Registered Aircraft:
2
Aircraft: CESSNA 150L (Category: Land, Seats: 2, Weight: Up to 12,499 Pounds, Speed: 90 mph), Engine: CONT MOTOR 0-200 SERIES (100 HP) (Reciprocating) N-Number: 16012, N16012, N-16012, Serial Number: 15073410, Year manufactured: 1972, Airworthiness Date: 04/14/1972, Certificate Issue Date: 01/04/2005 Registrant (Individual): Joseph J Filasky, Po Box 372, Aquebogue, NY 11931
Aircraft: MOONEY M20J (Category: Land, Seats: 4, Weight: Up to 12,499 Pounds, Speed: 126 mph), Engine: Reciprocating N-Number: 5772M, N5772M, N-5772M, Serial Number: 24-1501, Year manufactured: 1984, Airworthiness Date: 10/29/1984, Certificate Issue Date: 05/14/2015 Registrant (Individual): Pasquale T Rutigliano, Po Box 2606, Aquebogue, NY 11931
Home Mortgage Disclosure Act Aggregated Statistics For Year 2009 (Based on 1 partial tract)
A) FHA, FSA/RHS & VA Home Purchase Loans
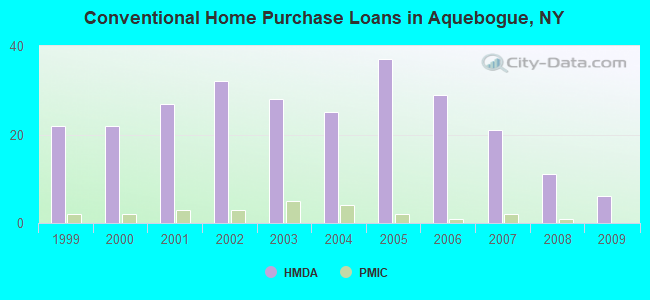
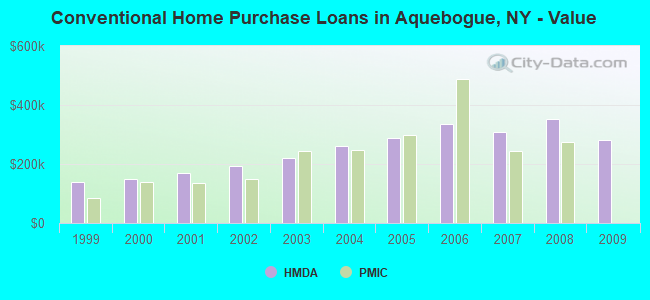
B) Conventional Home Purchase Loans
C) Refinancings
D) Home Improvement Loans
F) Non-occupant Loans on < 5 Family Dwellings (A B C & D)
Number
Average Value
Number
Average Value
Number
Average Value
Number
Average Value
Number
Average Value
LOANS ORIGINATED
1
$562,940
6
$282,520
25
$279,968
3
$196,573
5
$408,108
APPLICATIONS APPROVED, NOT ACCEPTED
0
$0
1
$279,150
4
$353,318
0
$0
1
$363,980
APPLICATIONS DENIED
1
$493,080
1
$334,660
12
$311,355
1
$137,780
2
$384,395
APPLICATIONS WITHDRAWN
1
$171,140
2
$351,410
8
$295,479
0
$0
0
$0
FILES CLOSED FOR INCOMPLETENESS
0
$0
0
$0
2
$307,950
0
$0
0
$0
Aggregated Statistics For Year 2008 (Based on 1 partial tract)
A) FHA, FSA/RHS & VA Home Purchase Loans
B) Conventional Home Purchase Loans
C) Refinancings
D) Home Improvement Loans
F) Non-occupant Loans on < 5 Family Dwellings (A B C & D)
G) Loans On Manufactured Home Dwelling (A B C & D)
Number
Average Value
Number
Average Value
Number
Average Value
Number
Average Value
Number
Average Value
Number
Average Value
LOANS ORIGINATED
1
$394,200
11
$353,410
13
$249,222
4
$127,010
6
$436,133
1
$39,790
APPLICATIONS APPROVED, NOT ACCEPTED
0
$0
3
$383,523
3
$342,883
1
$115,040
1
$374,900
0
$0
APPLICATIONS DENIED
0
$0
3
$234,723
12
$289,302
4
$118,820
2
$283,865
0
$0
APPLICATIONS WITHDRAWN
0
$0
1
$601,990
7
$251,434
1
$174,280
1
$367,720
0
$0
FILES CLOSED FOR INCOMPLETENESS
0
$0
0
$0
2
$261,500
0
$0
0
$0
0
$0
Aggregated Statistics For Year 2007 (Based on 1 partial tract)
B) Conventional Home Purchase Loans
C) Refinancings
D) Home Improvement Loans
F) Non-occupant Loans on < 5 Family Dwellings (A B C & D)
G) Loans On Manufactured Home Dwelling (A B C & D)
Number
Average Value
Number
Average Value
Number
Average Value
Number
Average Value
Number
Average Value
LOANS ORIGINATED
21
$307,520
27
$290,318
9
$166,721
9
$522,253
1
$44,880
APPLICATIONS APPROVED, NOT ACCEPTED
3
$267,583
7
$280,607
2
$87,965
2
$266,065
0
$0
APPLICATIONS DENIED
5
$249,772
21
$311,909
4
$147,805
1
$377,590
0
$0
APPLICATIONS WITHDRAWN
2
$390,905
7
$267,250
1
$140,620
1
$239,960
0
$0
FILES CLOSED FOR INCOMPLETENESS
0
$0
3
$349,713
1
$67,620
0
$0
0
$0
Aggregated Statistics For Year 2006 (Based on 1 partial tract)
A) FHA, FSA/RHS & VA Home Purchase Loans
B) Conventional Home Purchase Loans
C) Refinancings
D) Home Improvement Loans
F) Non-occupant Loans on < 5 Family Dwellings (A B C & D)
G) Loans On Manufactured Home Dwelling (A B C & D)
Number
Average Value
Number
Average Value
Number
Average Value
Number
Average Value
Number
Average Value
Number
Average Value
LOANS ORIGINATED
1
$207,940
29
$335,542
34
$269,403
11
$118,674
8
$374,411
0
$0
APPLICATIONS APPROVED, NOT ACCEPTED
0
$0
3
$376,993
10
$257,207
2
$115,940
1
$131,800
0
$0
APPLICATIONS DENIED
0
$0
6
$281,922
17
$307,622
4
$192,685
1
$296,510
1
$42,640
APPLICATIONS WITHDRAWN
0
$0
5
$327,924
12
$291,957
2
$166,880
1
$387,020
0
$0
FILES CLOSED FOR INCOMPLETENESS
0
$0
1
$293,660
6
$306,455
1
$154,840
1
$144,060
0
$0
Aggregated Statistics For Year 2005 (Based on 1 partial tract)
B) Conventional Home Purchase Loans
C) Refinancings
D) Home Improvement Loans
F) Non-occupant Loans on < 5 Family Dwellings (A B C & D)
G) Loans On Manufactured Home Dwelling (A B C & D)
Number
Average Value
Number
Average Value
Number
Average Value
Number
Average Value
Number
Average Value
LOANS ORIGINATED
37
$288,073
43
$252,459
7
$111,003
8
$361,471
1
$48,620
APPLICATIONS APPROVED, NOT ACCEPTED
5
$261,412
8
$287,625
2
$168,150
2
$335,255
0
$0
APPLICATIONS DENIED
10
$240,258
20
$259,758
4
$105,020
1
$399,580
1
$46,820
APPLICATIONS WITHDRAWN
7
$307,364
14
$297,683
2
$245,420
2
$410,280
0
$0
FILES CLOSED FOR INCOMPLETENESS
3
$200,363
9
$277,973
0
$0
1
$130,000
0
$0
Aggregated Statistics For Year 2004 (Based on 1 partial tract)
A) FHA, FSA/RHS & VA Home Purchase Loans
B) Conventional Home Purchase Loans
C) Refinancings
D) Home Improvement Loans
F) Non-occupant Loans on < 5 Family Dwellings (A B C & D)
G) Loans On Manufactured Home Dwelling (A B C & D)
Number
Average Value
Number
Average Value
Number
Average Value
Number
Average Value
Number
Average Value
Number
Average Value
LOANS ORIGINATED
0
$0
25
$262,111
42
$205,027
9
$103,822
8
$253,815
1
$29,170
APPLICATIONS APPROVED, NOT ACCEPTED
0
$0
6
$320,118
11
$202,939
1
$108,910
2
$342,585
0
$0
APPLICATIONS DENIED
1
$142,120
5
$264,284
17
$202,902
3
$82,280
3
$326,027
1
$17,800
APPLICATIONS WITHDRAWN
0
$0
4
$314,460
13
$185,228
1
$133,890
0
$0
0
$0
FILES CLOSED FOR INCOMPLETENESS
0
$0
1
$197,320
9
$205,069
1
$64,630
0
$0
0
$0
Aggregated Statistics For Year 2003 (Based on 1 partial tract)
A) FHA, FSA/RHS & VA Home Purchase Loans
B) Conventional Home Purchase Loans
C) Refinancings
D) Home Improvement Loans
F) Non-occupant Loans on < 5 Family Dwellings (A B C & D)
Number
Average Value
Number
Average Value
Number
Average Value
Number
Average Value
Number
Average Value
LOANS ORIGINATED
1
$192,830
28
$219,538
79
$181,120
9
$49,518
9
$273,569
APPLICATIONS APPROVED, NOT ACCEPTED
0
$0
6
$229,087
13
$190,153
1
$62,380
1
$314,610
APPLICATIONS DENIED
0
$0
4
$201,660
24
$184,706
1
$91,850
3
$159,173
APPLICATIONS WITHDRAWN
0
$0
3
$208,593
14
$169,924
2
$43,610
0
$0
FILES CLOSED FOR INCOMPLETENESS
0
$0
1
$317,750
4
$171,255
0
$0
0
$0
Aggregated Statistics For Year 2002 (Based on 1 partial tract)
A) FHA, FSA/RHS & VA Home Purchase Loans
B) Conventional Home Purchase Loans
C) Refinancings
D) Home Improvement Loans
F) Non-occupant Loans on < 5 Family Dwellings (A B C & D)
Number
Average Value
Number
Average Value
Number
Average Value
Number
Average Value
Number
Average Value
LOANS ORIGINATED
1
$221,110
32
$192,142
50
$162,128
7
$50,521
7
$192,066
APPLICATIONS APPROVED, NOT ACCEPTED
0
$0
3
$197,920
7
$179,969
2
$33,810
1
$240,710
APPLICATIONS DENIED
0
$0
3
$170,443
17
$150,814
3
$50,367
1
$242,950
APPLICATIONS WITHDRAWN
0
$0
4
$184,008
10
$149,884
2
$57,220
0
$0
FILES CLOSED FOR INCOMPLETENESS
0
$0
2
$278,930
6
$178,922
0
$0
1
$224,700
Aggregated Statistics For Year 2001 (Based on 1 partial tract)
A) FHA, FSA/RHS & VA Home Purchase Loans
B) Conventional Home Purchase Loans
C) Refinancings
D) Home Improvement Loans
F) Non-occupant Loans on < 5 Family Dwellings (A B C & D)
Number
Average Value
Number
Average Value
Number
Average Value
Number
Average Value
Number
Average Value
LOANS ORIGINATED
2
$177,575
27
$167,951
33
$141,852
6
$39,170
5
$179,160
APPLICATIONS APPROVED, NOT ACCEPTED
0
$0
3
$202,160
6
$133,143
2
$48,845
1
$167,850
APPLICATIONS DENIED
1
$111,750
5
$189,364
14
$126,583
3
$54,903
2
$86,020
APPLICATIONS WITHDRAWN
0
$0
3
$139,377
11
$121,475
2
$34,485
0
$0
FILES CLOSED FOR INCOMPLETENESS
0
$0
1
$161,270
2
$116,090
0
$0
0
$0
Aggregated Statistics For Year 2000 (Based on 1 partial tract)
A) FHA, FSA/RHS & VA Home Purchase Loans
B) Conventional Home Purchase Loans
C) Refinancings
D) Home Improvement Loans
F) Non-occupant Loans on < 5 Family Dwellings (A B C & D)
Number
Average Value
Number
Average Value
Number
Average Value
Number
Average Value
Number
Average Value
LOANS ORIGINATED
2
$115,040
22
$148,825
9
$108,976
6
$26,405
3
$138,980
APPLICATIONS APPROVED, NOT ACCEPTED
0
$0
3
$124,767
3
$87,817
2
$34,185
1
$108,760
APPLICATIONS DENIED
0
$0
7
$162,187
9
$107,994
4
$32,053
2
$101,805
APPLICATIONS WITHDRAWN
1
$137,780
4
$164,148
7
$87,303
1
$12,270
1
$148,850
FILES CLOSED FOR INCOMPLETENESS
0
$0
1
$225,600
1
$157,380
0
$0
0
$0
Aggregated Statistics For Year 1999 (Based on 1 partial tract)
A) FHA, FSA/RHS & VA Home Purchase Loans
B) Conventional Home Purchase Loans
C) Refinancings
D) Home Improvement Loans
F) Non-occupant Loans on < 5 Family Dwellings (A B C & D)


 Recent articles from our blog. Our writers, many of them Ph.D. graduates or candidates, create easy-to-read articles on a wide variety of topics.

 (29.4 miles