Bethesda, Maryland Submit your own pictures of this place and show them to the world
OSM Map
General Map
Google Map
MSN Map
OSM Map
General Map
Google Map
MSN Map
OSM Map
General Map
Google Map
MSN Map
OSM Map
General Map
Google Map
MSN Map
Please wait while loading the map...
Population in 2022: 68,522 (100% urban, 0% rural). Population change since 2000: +24.0%Males: 33,983 Females: 34,539
March 2022 cost of living index in Bethesda: 189.6 (very high, U.S. average is 100) Percentage of residents living in poverty in 2022: 3.4%for White Non-Hispanic residents , 15.6% for Black residents , 3.6% for Hispanic or Latino residents , 11.1% for other race residents , 3.1% for two or more races residents )
Profiles of local businesses
Business Search - 14 Million verified businesses
Data:
Median household income ($)
Median household income (% change since 2000)
Household income diversity
Ratio of average income to average house value (%)
Ratio of average income to average rent
Median household income ($) - White
Median household income ($) - Black or African American
Median household income ($) - Asian
Median household income ($) - Hispanic or Latino
Median household income ($) - American Indian and Alaska Native
Median household income ($) - Multirace
Median household income ($) - Other Race
Median household income for houses/condos with a mortgage ($)
Median household income for apartments without a mortgage ($)
Races - White alone (%)
Races - White alone (% change since 2000)
Races - Black alone (%)
Races - Black alone (% change since 2000)
Races - American Indian alone (%)
Races - American Indian alone (% change since 2000)
Races - Asian alone (%)
Races - Asian alone (% change since 2000)
Races - Hispanic (%)
Races - Hispanic (% change since 2000)
Races - Native Hawaiian and Other Pacific Islander alone (%)
Races - Native Hawaiian and Other Pacific Islander alone (% change since 2000)
Races - Two or more races (%)
Races - Two or more races (% change since 2000)
Races - Other race alone (%)
Races - Other race alone (% change since 2000)
Racial diversity
Unemployment (%)
Unemployment (% change since 2000)
Unemployment (%) - White
Unemployment (%) - Black or African American
Unemployment (%) - Asian
Unemployment (%) - Hispanic or Latino
Unemployment (%) - American Indian and Alaska Native
Unemployment (%) - Multirace
Unemployment (%) - Other Race
Population density (people per square mile)
Population - Males (%)
Population - Females (%)
Population - Males (%) - White
Population - Males (%) - Black or African American
Population - Males (%) - Asian
Population - Males (%) - Hispanic or Latino
Population - Males (%) - American Indian and Alaska Native
Population - Males (%) - Multirace
Population - Males (%) - Other Race
Population - Females (%) - White
Population - Females (%) - Black or African American
Population - Females (%) - Asian
Population - Females (%) - Hispanic or Latino
Population - Females (%) - American Indian and Alaska Native
Population - Females (%) - Multirace
Population - Females (%) - Other Race
Coronavirus confirmed cases (Apr 23, 2024)
Deaths caused by coronavirus (Apr 23, 2024)
Coronavirus confirmed cases (per 100k population) (Apr 23, 2024)
Deaths caused by coronavirus (per 100k population) (Apr 23, 2024)
Daily increase in number of cases (Apr 23, 2024)
Weekly increase in number of cases (Apr 23, 2024)
Cases doubled (in days) (Apr 23, 2024)
Hospitalized patients (Apr 18, 2022)
Negative test results (Apr 18, 2022)
Total test results (Apr 18, 2022)
COVID Vaccine doses distributed (per 100k population) (Sep 19, 2023)
COVID Vaccine doses administered (per 100k population) (Sep 19, 2023)
COVID Vaccine doses distributed (Sep 19, 2023)
COVID Vaccine doses administered (Sep 19, 2023)
Likely homosexual households (%)
Likely homosexual households (% change since 2000)
Likely homosexual households - Lesbian couples (%)
Likely homosexual households - Lesbian couples (% change since 2000)
Likely homosexual households - Gay men (%)
Likely homosexual households - Gay men (% change since 2000)
Cost of living index
Median gross rent ($)
Median contract rent ($)
Median monthly housing costs ($)
Median house or condo value ($)
Median house or condo value ($ change since 2000)
Mean house or condo value by units in structure - 1, detached ($)
Mean house or condo value by units in structure - 1, attached ($)
Mean house or condo value by units in structure - 2 ($)
Mean house or condo value by units in structure by units in structure - 3 or 4 ($)
Mean house or condo value by units in structure - 5 or more ($)
Mean house or condo value by units in structure - Boat, RV, van, etc. ($)
Mean house or condo value by units in structure - Mobile home ($)
Median house or condo value ($) - White
Median house or condo value ($) - Black or African American
Median house or condo value ($) - Asian
Median house or condo value ($) - Hispanic or Latino
Median house or condo value ($) - American Indian and Alaska Native
Median house or condo value ($) - Multirace
Median house or condo value ($) - Other Race
Median resident age
Resident age diversity
Median resident age - Males
Median resident age - Females
Median resident age - White
Median resident age - Black or African American
Median resident age - Asian
Median resident age - Hispanic or Latino
Median resident age - American Indian and Alaska Native
Median resident age - Multirace
Median resident age - Other Race
Median resident age - Males - White
Median resident age - Males - Black or African American
Median resident age - Males - Asian
Median resident age - Males - Hispanic or Latino
Median resident age - Males - American Indian and Alaska Native
Median resident age - Males - Multirace
Median resident age - Males - Other Race
Median resident age - Females - White
Median resident age - Females - Black or African American
Median resident age - Females - Asian
Median resident age - Females - Hispanic or Latino
Median resident age - Females - American Indian and Alaska Native
Median resident age - Females - Multirace
Median resident age - Females - Other Race
Commute - mean travel time to work (minutes)
Travel time to work - Less than 5 minutes (%)
Travel time to work - Less than 5 minutes (% change since 2000)
Travel time to work - 5 to 9 minutes (%)
Travel time to work - 5 to 9 minutes (% change since 2000)
Travel time to work - 10 to 19 minutes (%)
Travel time to work - 10 to 19 minutes (% change since 2000)
Travel time to work - 20 to 29 minutes (%)
Travel time to work - 20 to 29 minutes (% change since 2000)
Travel time to work - 30 to 39 minutes (%)
Travel time to work - 30 to 39 minutes (% change since 2000)
Travel time to work - 40 to 59 minutes (%)
Travel time to work - 40 to 59 minutes (% change since 2000)
Travel time to work - 60 to 89 minutes (%)
Travel time to work - 60 to 89 minutes (% change since 2000)
Travel time to work - 90 or more minutes (%)
Travel time to work - 90 or more minutes (% change since 2000)
Marital status - Never married (%)
Marital status - Now married (%)
Marital status - Separated (%)
Marital status - Widowed (%)
Marital status - Divorced (%)
Median family income ($)
Median family income (% change since 2000)
Median non-family income ($)
Median non-family income (% change since 2000)
Median per capita income ($)
Median per capita income (% change since 2000)
Median family income ($) - White
Median family income ($) - Black or African American
Median family income ($) - Asian
Median family income ($) - Hispanic or Latino
Median family income ($) - American Indian and Alaska Native
Median family income ($) - Multirace
Median family income ($) - Other Race
Median year house/condo built
Median year apartment built
Year house built - Built 2005 or later (%)
Year house built - Built 2000 to 2004 (%)
Year house built - Built 1990 to 1999 (%)
Year house built - Built 1980 to 1989 (%)
Year house built - Built 1970 to 1979 (%)
Year house built - Built 1960 to 1969 (%)
Year house built - Built 1950 to 1959 (%)
Year house built - Built 1940 to 1949 (%)
Year house built - Built 1939 or earlier (%)
Average household size
Household density (households per square mile)
Average household size - White
Average household size - Black or African American
Average household size - Asian
Average household size - Hispanic or Latino
Average household size - American Indian and Alaska Native
Average household size - Multirace
Average household size - Other Race
Occupied housing units (%)
Vacant housing units (%)
Owner occupied housing units (%)
Renter occupied housing units (%)
Vacancy status - For rent (%)
Vacancy status - For sale only (%)
Vacancy status - Rented or sold, not occupied (%)
Vacancy status - For seasonal, recreational, or occasional use (%)
Vacancy status - For migrant workers (%)
Vacancy status - Other vacant (%)
Residents with income below the poverty level (%)
Residents with income below 50% of the poverty level (%)
Children below poverty level (%)
Poor families by family type - Married-couple family (%)
Poor families by family type - Male, no wife present (%)
Poor families by family type - Female, no husband present (%)
Poverty status for native-born residents (%)
Poverty status for foreign-born residents (%)
Poverty among high school graduates not in families (%)
Poverty among people who did not graduate high school not in families (%)
Residents with income below the poverty level (%) - White
Residents with income below the poverty level (%) - Black or African American
Residents with income below the poverty level (%) - Asian
Residents with income below the poverty level (%) - Hispanic or Latino
Residents with income below the poverty level (%) - American Indian and Alaska Native
Residents with income below the poverty level (%) - Multirace
Residents with income below the poverty level (%) - Other Race
Air pollution - Air Quality Index (AQI)
Air pollution - CO
Air pollution - NO2
Air pollution - SO2
Air pollution - Ozone
Air pollution - PM10
Air pollution - PM25
Air pollution - Pb
Crime - Murders per 100,000 population
Crime - Rapes per 100,000 population
Crime - Robberies per 100,000 population
Crime - Assaults per 100,000 population
Crime - Burglaries per 100,000 population
Crime - Thefts per 100,000 population
Crime - Auto thefts per 100,000 population
Crime - Arson per 100,000 population
Crime - City-data.com crime index
Crime - Violent crime index
Crime - Property crime index
Crime - Murders per 100,000 population (5 year average)
Crime - Rapes per 100,000 population (5 year average)
Crime - Robberies per 100,000 population (5 year average)
Crime - Assaults per 100,000 population (5 year average)
Crime - Burglaries per 100,000 population (5 year average)
Crime - Thefts per 100,000 population (5 year average)
Crime - Auto thefts per 100,000 population (5 year average)
Crime - Arson per 100,000 population (5 year average)
Crime - City-data.com crime index (5 year average)
Crime - Violent crime index (5 year average)
Crime - Property crime index (5 year average)
1996 Presidential Elections Results (%) - Democratic Party (Clinton)
1996 Presidential Elections Results (%) - Republican Party (Dole)
1996 Presidential Elections Results (%) - Other
2000 Presidential Elections Results (%) - Democratic Party (Gore)
2000 Presidential Elections Results (%) - Republican Party (Bush)
2000 Presidential Elections Results (%) - Other
2004 Presidential Elections Results (%) - Democratic Party (Kerry)
2004 Presidential Elections Results (%) - Republican Party (Bush)
2004 Presidential Elections Results (%) - Other
2008 Presidential Elections Results (%) - Democratic Party (Obama)
2008 Presidential Elections Results (%) - Republican Party (McCain)
2008 Presidential Elections Results (%) - Other
2012 Presidential Elections Results (%) - Democratic Party (Obama)
2012 Presidential Elections Results (%) - Republican Party (Romney)
2012 Presidential Elections Results (%) - Other
2016 Presidential Elections Results (%) - Democratic Party (Clinton)
2016 Presidential Elections Results (%) - Republican Party (Trump)
2016 Presidential Elections Results (%) - Other
2020 Presidential Elections Results (%) - Democratic Party (Biden)
2020 Presidential Elections Results (%) - Republican Party (Trump)
2020 Presidential Elections Results (%) - Other
Ancestries Reported - Arab (%)
Ancestries Reported - Czech (%)
Ancestries Reported - Danish (%)
Ancestries Reported - Dutch (%)
Ancestries Reported - English (%)
Ancestries Reported - French (%)
Ancestries Reported - French Canadian (%)
Ancestries Reported - German (%)
Ancestries Reported - Greek (%)
Ancestries Reported - Hungarian (%)
Ancestries Reported - Irish (%)
Ancestries Reported - Italian (%)
Ancestries Reported - Lithuanian (%)
Ancestries Reported - Norwegian (%)
Ancestries Reported - Polish (%)
Ancestries Reported - Portuguese (%)
Ancestries Reported - Russian (%)
Ancestries Reported - Scotch-Irish (%)
Ancestries Reported - Scottish (%)
Ancestries Reported - Slovak (%)
Ancestries Reported - Subsaharan African (%)
Ancestries Reported - Swedish (%)
Ancestries Reported - Swiss (%)
Ancestries Reported - Ukrainian (%)
Ancestries Reported - United States (%)
Ancestries Reported - Welsh (%)
Ancestries Reported - West Indian (%)
Ancestries Reported - Other (%)
Educational Attainment - No schooling completed (%)
Educational Attainment - Less than high school (%)
Educational Attainment - High school or equivalent (%)
Educational Attainment - Less than 1 year of college (%)
Educational Attainment - 1 or more years of college (%)
Educational Attainment - Associate degree (%)
Educational Attainment - Bachelor's degree (%)
Educational Attainment - Master's degree (%)
Educational Attainment - Professional school degree (%)
Educational Attainment - Doctorate degree (%)
School Enrollment - Nursery, preschool (%)
School Enrollment - Kindergarten (%)
School Enrollment - Grade 1 to 4 (%)
School Enrollment - Grade 5 to 8 (%)
School Enrollment - Grade 9 to 12 (%)
School Enrollment - College undergrad (%)
School Enrollment - Graduate or professional (%)
School Enrollment - Not enrolled in school (%)
School enrollment - Public schools (%)
School enrollment - Private schools (%)
School enrollment - Not enrolled (%)
Median number of rooms in houses and condos
Median number of rooms in apartments
Housing units lacking complete plumbing facilities (%)
Housing units lacking complete kitchen facilities (%)
Density of houses
Urban houses (%)
Rural houses (%)
Households with people 60 years and over (%)
Households with people 65 years and over (%)
Households with people 75 years and over (%)
Households with one or more nonrelatives (%)
Households with no nonrelatives (%)
Population in households (%)
Family households (%)
Nonfamily households (%)
Population in families (%)
Family households with own children (%)
Median number of bedrooms in owner occupied houses
Mean number of bedrooms in owner occupied houses
Median number of bedrooms in renter occupied houses
Mean number of bedrooms in renter occupied houses
Median number of vehichles in owner occupied houses
Mean number of vehichles in owner occupied houses
Median number of vehichles in renter occupied houses
Mean number of vehichles in renter occupied houses
Mortgage status - with mortgage (%)
Mortgage status - with second mortgage (%)
Mortgage status - with home equity loan (%)
Mortgage status - with both second mortgage and home equity loan (%)
Mortgage status - without a mortgage (%)
Average family size
Average family size - White
Average family size - Black or African American
Average family size - Asian
Average family size - Hispanic or Latino
Average family size - American Indian and Alaska Native
Average family size - Multirace
Average family size - Other Race
Geographical mobility - Same house 1 year ago (%)
Geographical mobility - Moved within same county (%)
Geographical mobility - Moved from different county within same state (%)
Geographical mobility - Moved from different state (%)
Geographical mobility - Moved from abroad (%)
Place of birth - Born in state of residence (%)
Place of birth - Born in other state (%)
Place of birth - Native, outside of US (%)
Place of birth - Foreign born (%)
Housing units in structures - 1, detached (%)
Housing units in structures - 1, attached (%)
Housing units in structures - 2 (%)
Housing units in structures - 3 or 4 (%)
Housing units in structures - 5 to 9 (%)
Housing units in structures - 10 to 19 (%)
Housing units in structures - 20 to 49 (%)
Housing units in structures - 50 or more (%)
Housing units in structures - Mobile home (%)
Housing units in structures - Boat, RV, van, etc. (%)
House/condo owner moved in on average (years ago)
Renter moved in on average (years ago)
Year householder moved into unit - Moved in 1999 to March 2000 (%)
Year householder moved into unit - Moved in 1995 to 1998 (%)
Year householder moved into unit - Moved in 1990 to 1994 (%)
Year householder moved into unit - Moved in 1980 to 1989 (%)
Year householder moved into unit - Moved in 1970 to 1979 (%)
Year householder moved into unit - Moved in 1969 or earlier (%)
Means of transportation to work - Drove car alone (%)
Means of transportation to work - Carpooled (%)
Means of transportation to work - Public transportation (%)
Means of transportation to work - Bus or trolley bus (%)
Means of transportation to work - Streetcar or trolley car (%)
Means of transportation to work - Subway or elevated (%)
Means of transportation to work - Railroad (%)
Means of transportation to work - Ferryboat (%)
Means of transportation to work - Taxicab (%)
Means of transportation to work - Motorcycle (%)
Means of transportation to work - Bicycle (%)
Means of transportation to work - Walked (%)
Means of transportation to work - Other means (%)
Working at home (%)
Industry diversity
Most Common Industries - Agriculture, forestry, fishing and hunting, and mining (%)
Most Common Industries - Agriculture, forestry, fishing and hunting (%)
Most Common Industries - Mining, quarrying, and oil and gas extraction (%)
Most Common Industries - Construction (%)
Most Common Industries - Manufacturing (%)
Most Common Industries - Wholesale trade (%)
Most Common Industries - Retail trade (%)
Most Common Industries - Transportation and warehousing, and utilities (%)
Most Common Industries - Transportation and warehousing (%)
Most Common Industries - Utilities (%)
Most Common Industries - Information (%)
Most Common Industries - Finance and insurance, and real estate and rental and leasing (%)
Most Common Industries - Finance and insurance (%)
Most Common Industries - Real estate and rental and leasing (%)
Most Common Industries - Professional, scientific, and management, and administrative and waste management services (%)
Most Common Industries - Professional, scientific, and technical services (%)
Most Common Industries - Management of companies and enterprises (%)
Most Common Industries - Administrative and support and waste management services (%)
Most Common Industries - Educational services, and health care and social assistance (%)
Most Common Industries - Educational services (%)
Most Common Industries - Health care and social assistance (%)
Most Common Industries - Arts, entertainment, and recreation, and accommodation and food services (%)
Most Common Industries - Arts, entertainment, and recreation (%)
Most Common Industries - Accommodation and food services (%)
Most Common Industries - Other services, except public administration (%)
Most Common Industries - Public administration (%)
Occupation diversity
Most Common Occupations - Management, business, science, and arts occupations (%)
Most Common Occupations - Management, business, and financial occupations (%)
Most Common Occupations - Management occupations (%)
Most Common Occupations - Business and financial operations occupations (%)
Most Common Occupations - Computer, engineering, and science occupations (%)
Most Common Occupations - Computer and mathematical occupations (%)
Most Common Occupations - Architecture and engineering occupations (%)
Most Common Occupations - Life, physical, and social science occupations (%)
Most Common Occupations - Education, legal, community service, arts, and media occupations (%)
Most Common Occupations - Community and social service occupations (%)
Most Common Occupations - Legal occupations (%)
Most Common Occupations - Education, training, and library occupations (%)
Most Common Occupations - Arts, design, entertainment, sports, and media occupations (%)
Most Common Occupations - Healthcare practitioners and technical occupations (%)
Most Common Occupations - Health diagnosing and treating practitioners and other technical occupations (%)
Most Common Occupations - Health technologists and technicians (%)
Most Common Occupations - Service occupations (%)
Most Common Occupations - Healthcare support occupations (%)
Most Common Occupations - Protective service occupations (%)
Most Common Occupations - Fire fighting and prevention, and other protective service workers including supervisors (%)
Most Common Occupations - Law enforcement workers including supervisors (%)
Most Common Occupations - Food preparation and serving related occupations (%)
Most Common Occupations - Building and grounds cleaning and maintenance occupations (%)
Most Common Occupations - Personal care and service occupations (%)
Most Common Occupations - Sales and office occupations (%)
Most Common Occupations - Sales and related occupations (%)
Most Common Occupations - Office and administrative support occupations (%)
Most Common Occupations - Natural resources, construction, and maintenance occupations (%)
Most Common Occupations - Farming, fishing, and forestry occupations (%)
Most Common Occupations - Construction and extraction occupations (%)
Most Common Occupations - Installation, maintenance, and repair occupations (%)
Most Common Occupations - Production, transportation, and material moving occupations (%)
Most Common Occupations - Production occupations (%)
Most Common Occupations - Transportation occupations (%)
Most Common Occupations - Material moving occupations (%)
People in Group quarters - Institutionalized population (%)
People in Group quarters - Correctional institutions (%)
People in Group quarters - Federal prisons and detention centers (%)
People in Group quarters - Halfway houses (%)
People in Group quarters - Local jails and other confinement facilities (including police lockups) (%)
People in Group quarters - Military disciplinary barracks (%)
People in Group quarters - State prisons (%)
People in Group quarters - Other types of correctional institutions (%)
People in Group quarters - Nursing homes (%)
People in Group quarters - Hospitals/wards, hospices, and schools for the handicapped (%)
People in Group quarters - Hospitals/wards and hospices for chronically ill (%)
People in Group quarters - Hospices or homes for chronically ill (%)
People in Group quarters - Military hospitals or wards for chronically ill (%)
People in Group quarters - Other hospitals or wards for chronically ill (%)
People in Group quarters - Hospitals or wards for drug/alcohol abuse (%)
People in Group quarters - Mental (Psychiatric) hospitals or wards (%)
People in Group quarters - Schools, hospitals, or wards for the mentally retarded (%)
People in Group quarters - Schools, hospitals, or wards for the physically handicapped (%)
People in Group quarters - Institutions for the deaf (%)
People in Group quarters - Institutions for the blind (%)
People in Group quarters - Orthopedic wards and institutions for the physically handicapped (%)
People in Group quarters - Wards in general hospitals for patients who have no usual home elsewhere (%)
People in Group quarters - Wards in military hospitals for patients who have no usual home elsewhere (%)
People in Group quarters - Juvenile institutions (%)
People in Group quarters - Long-term care (%)
People in Group quarters - Homes for abused, dependent, and neglected children (%)
People in Group quarters - Residential treatment centers for emotionally disturbed children (%)
People in Group quarters - Training schools for juvenile delinquents (%)
People in Group quarters - Short-term care, detention or diagnostic centers for delinquent children (%)
People in Group quarters - Type of juvenile institution unknown (%)
People in Group quarters - Noninstitutionalized population (%)
People in Group quarters - College dormitories (includes college quarters off campus) (%)
People in Group quarters - Military quarters (%)
People in Group quarters - On base (%)
People in Group quarters - Barracks, unaccompanied personnel housing (UPH), (Enlisted/Officer), ;and similar group living quarters for military personnel (%)
People in Group quarters - Transient quarters for temporary residents (%)
People in Group quarters - Military ships (%)
People in Group quarters - Group homes (%)
People in Group quarters - Homes or halfway houses for drug/alcohol abuse (%)
People in Group quarters - Homes for the mentally ill (%)
People in Group quarters - Homes for the mentally retarded (%)
People in Group quarters - Homes for the physically handicapped (%)
People in Group quarters - Other group homes (%)
People in Group quarters - Religious group quarters (%)
People in Group quarters - Dormitories (%)
People in Group quarters - Agriculture workers' dormitories on farms (%)
People in Group quarters - Job Corps and vocational training facilities (%)
People in Group quarters - Other workers' dormitories (%)
People in Group quarters - Crews of maritime vessels (%)
People in Group quarters - Other nonhousehold living situations (%)
People in Group quarters - Other noninstitutional group quarters (%)
Residents speaking English at home (%)
Residents speaking English at home - Born in the United States (%)
Residents speaking English at home - Native, born elsewhere (%)
Residents speaking English at home - Foreign born (%)
Residents speaking Spanish at home (%)
Residents speaking Spanish at home - Born in the United States (%)
Residents speaking Spanish at home - Native, born elsewhere (%)
Residents speaking Spanish at home - Foreign born (%)
Residents speaking other language at home (%)
Residents speaking other language at home - Born in the United States (%)
Residents speaking other language at home - Native, born elsewhere (%)
Residents speaking other language at home - Foreign born (%)
Class of Workers - Employee of private company (%)
Class of Workers - Self-employed in own incorporated business (%)
Class of Workers - Private not-for-profit wage and salary workers (%)
Class of Workers - Local government workers (%)
Class of Workers - State government workers (%)
Class of Workers - Federal government workers (%)
Class of Workers - Self-employed workers in own not incorporated business and Unpaid family workers (%)
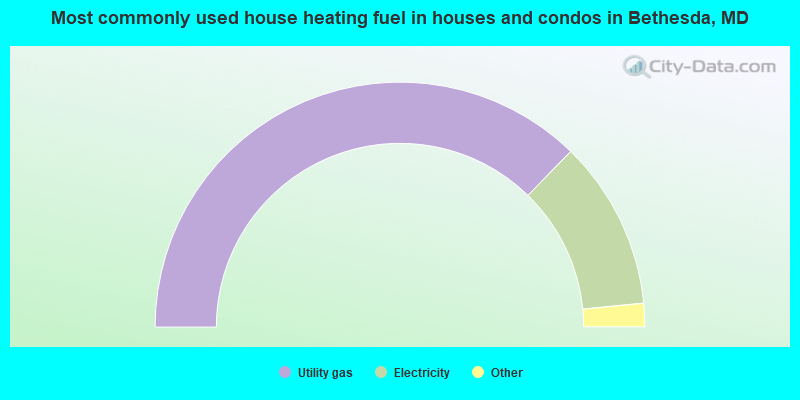
House heating fuel used in houses and condos - Utility gas (%)
House heating fuel used in houses and condos - Bottled, tank, or LP gas (%)
House heating fuel used in houses and condos - Electricity (%)
House heating fuel used in houses and condos - Fuel oil, kerosene, etc. (%)
House heating fuel used in houses and condos - Coal or coke (%)
House heating fuel used in houses and condos - Wood (%)
House heating fuel used in houses and condos - Solar energy (%)
House heating fuel used in houses and condos - Other fuel (%)
House heating fuel used in houses and condos - No fuel used (%)
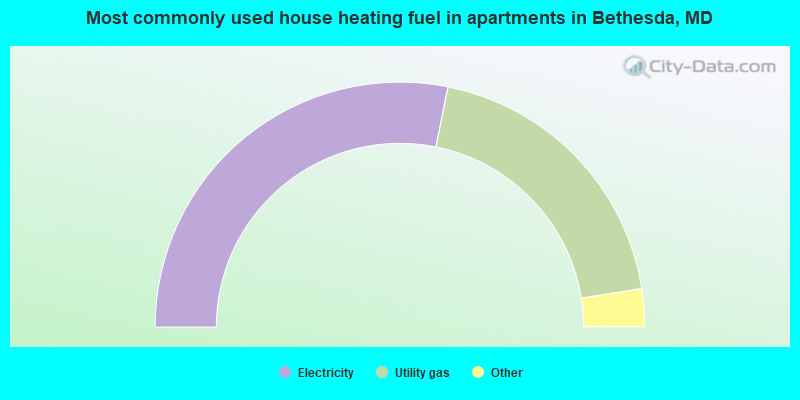
House heating fuel used in apartments - Utility gas (%)
House heating fuel used in apartments - Bottled, tank, or LP gas (%)
House heating fuel used in apartments - Electricity (%)
House heating fuel used in apartments - Fuel oil, kerosene, etc. (%)
House heating fuel used in apartments - Coal or coke (%)
House heating fuel used in apartments - Wood (%)
House heating fuel used in apartments - Solar energy (%)
House heating fuel used in apartments - Other fuel (%)
House heating fuel used in apartments - No fuel used (%)
Armed forces status - In Armed Forces (%)
Armed forces status - Civilian (%)
Armed forces status - Civilian - Veteran (%)
Armed forces status - Civilian - Nonveteran (%)
Fatal accidents locations in years 2005-2021
Fatal accidents locations in 2005
Fatal accidents locations in 2006
Fatal accidents locations in 2007
Fatal accidents locations in 2008
Fatal accidents locations in 2009
Fatal accidents locations in 2010
Fatal accidents locations in 2011
Fatal accidents locations in 2012
Fatal accidents locations in 2013
Fatal accidents locations in 2014
Fatal accidents locations in 2015
Fatal accidents locations in 2016
Fatal accidents locations in 2017
Fatal accidents locations in 2018
Fatal accidents locations in 2019
Fatal accidents locations in 2020
Fatal accidents locations in 2021
Alcohol use - People drinking some alcohol every month (%)
Alcohol use - People not drinking at all (%)
Alcohol use - Average days/month drinking alcohol
Alcohol use - Average drinks/week
Alcohol use - Average days/year people drink much
Audiometry - Average condition of hearing (%)
Audiometry - People that can hear a whisper from across a quiet room (%)
Audiometry - People that can hear normal voice from across a quiet room (%)
Audiometry - Ears ringing, roaring, buzzing (%)
Audiometry - Had a job exposure to loud noise (%)
Audiometry - Had off-work exposure to loud noise (%)
Blood Pressure & Cholesterol - Has high blood pressure (%)
Blood Pressure & Cholesterol - Checking blood pressure at home (%)
Blood Pressure & Cholesterol - Frequently checking blood cholesterol (%)
Blood Pressure & Cholesterol - Has high cholesterol level (%)
Consumer Behavior - Money monthly spent on food at supermarket/grocery store
Consumer Behavior - Money monthly spent on food at other stores
Consumer Behavior - Money monthly spent on eating out
Consumer Behavior - Money monthly spent on carryout/delivered foods
Consumer Behavior - Income spent on food at supermarket/grocery store (%)
Consumer Behavior - Income spent on food at other stores (%)
Consumer Behavior - Income spent on eating out (%)
Consumer Behavior - Income spent on carryout/delivered foods (%)
Current Health Status - General health condition (%)
Current Health Status - Blood donors (%)
Current Health Status - Has blood ever tested for HIV virus (%)
Current Health Status - Left-handed people (%)
Dermatology - People using sunscreen (%)
Diabetes - Diabetics (%)
Diabetes - Had a blood test for high blood sugar (%)
Diabetes - People taking insulin (%)
Diet Behavior & Nutrition - Diet health (%)
Diet Behavior & Nutrition - Milk product consumption (# of products/month)
Diet Behavior & Nutrition - Meals not home prepared (#/week)
Diet Behavior & Nutrition - Meals from fast food or pizza place (#/week)
Diet Behavior & Nutrition - Ready-to-eat foods (#/month)
Diet Behavior & Nutrition - Frozen meals/pizza (#/month)
Drug Use - People that ever used marijuana or hashish (%)
Drug Use - Ever used hard drugs (%)
Drug Use - Ever used any form of cocaine (%)
Drug Use - Ever used heroin (%)
Drug Use - Ever used methamphetamine (%)
Health Insurance - People covered by health insurance (%)
Kidney Conditions-Urology - Avg. # of times urinating at night
Medical Conditions - People with asthma (%)
Medical Conditions - People with anemia (%)
Medical Conditions - People with psoriasis (%)
Medical Conditions - People with overweight (%)
Medical Conditions - Elderly people having difficulties in thinking or remembering (%)
Medical Conditions - People who ever received blood transfusion (%)
Medical Conditions - People having trouble seeing even with glass/contacts (%)
Medical Conditions - People with arthritis (%)
Medical Conditions - People with gout (%)
Medical Conditions - People with congestive heart failure (%)
Medical Conditions - People with coronary heart disease (%)
Medical Conditions - People with angina pectoris (%)
Medical Conditions - People who ever had heart attack (%)
Medical Conditions - People who ever had stroke (%)
Medical Conditions - People with emphysema (%)
Medical Conditions - People with thyroid problem (%)
Medical Conditions - People with chronic bronchitis (%)
Medical Conditions - People with any liver condition (%)
Medical Conditions - People who ever had cancer or malignancy (%)
Mental Health - People who have little interest in doing things (%)
Mental Health - People feeling down, depressed, or hopeless (%)
Mental Health - People who have trouble sleeping or sleeping too much (%)
Mental Health - People feeling tired or having little energy (%)
Mental Health - People with poor appetite or overeating (%)
Mental Health - People feeling bad about themself (%)
Mental Health - People who have trouble concentrating on things (%)
Mental Health - People moving or speaking slowly or too fast (%)
Mental Health - People having thoughts they would be better off dead (%)
Oral Health - Average years since last visit a dentist
Oral Health - People embarrassed because of mouth (%)
Oral Health - People with gum disease (%)
Oral Health - General health of teeth and gums (%)
Oral Health - Average days a week using dental floss/device
Oral Health - Average days a week using mouthwash for dental problem
Oral Health - Average number of teeth
Pesticide Use - Households using pesticides to control insects (%)
Pesticide Use - Households using pesticides to kill weeds (%)
Physical Activity - People doing vigorous-intensity work activities (%)
Physical Activity - People doing moderate-intensity work activities (%)
Physical Activity - People walking or bicycling (%)
Physical Activity - People doing vigorous-intensity recreational activities (%)
Physical Activity - People doing moderate-intensity recreational activities (%)
Physical Activity - Average hours a day doing sedentary activities
Physical Activity - Average hours a day watching TV or videos
Physical Activity - Average hours a day using computer
Physical Functioning - People having limitations keeping them from working (%)
Physical Functioning - People limited in amount of work they can do (%)
Physical Functioning - People that need special equipment to walk (%)
Physical Functioning - People experiencing confusion/memory problems (%)
Physical Functioning - People requiring special healthcare equipment (%)
Prescription Medications - Average number of prescription medicines taking
Preventive Aspirin Use - Adults 40+ taking low-dose aspirin (%)
Reproductive Health - Vaginal deliveries (%)
Reproductive Health - Cesarean deliveries (%)
Reproductive Health - Deliveries resulted in a live birth (%)
Reproductive Health - Pregnancies resulted in a delivery (%)
Reproductive Health - Women breastfeeding newborns (%)
Reproductive Health - Women that had a hysterectomy (%)
Reproductive Health - Women that had both ovaries removed (%)
Reproductive Health - Women that have ever taken birth control pills (%)
Reproductive Health - Women taking birth control pills (%)
Reproductive Health - Women that have ever used Depo-Provera or injectables (%)
Reproductive Health - Women that have ever used female hormones (%)
Sexual Behavior - People 18+ that ever had sex (vaginal, anal, or oral) (%)
Sexual Behavior - Males 18+ that ever had vaginal sex with a woman (%)
Sexual Behavior - Males 18+ that ever performed oral sex on a woman (%)
Sexual Behavior - Males 18+ that ever had anal sex with a woman (%)
Sexual Behavior - Males 18+ that ever had any sex with a man (%)
Sexual Behavior - Females 18+ that ever had vaginal sex with a man (%)
Sexual Behavior - Females 18+ that ever performed oral sex on a man (%)
Sexual Behavior - Females 18+ that ever had anal sex with a man (%)
Sexual Behavior - Females 18+ that ever had any kind of sex with a woman (%)
Sexual Behavior - Average age people first had sex
Sexual Behavior - Average number of female sex partners in lifetime (males 18+)
Sexual Behavior - Average number of female vaginal sex partners in lifetime (males 18+)
Sexual Behavior - Average age people first performed oral sex on a woman (18+)
Sexual Behavior - Average number of woman performed oral sex on in lifetime (18+)
Sexual Behavior - Average number of male sex partners in lifetime (males 18+)
Sexual Behavior - Average number of male anal sex partners in lifetime (males 18+)
Sexual Behavior - Average age people first performed oral sex on a man (18+)
Sexual Behavior - Average number of male oral sex partners in lifetime (18+)
Sexual Behavior - People using protection when performing oral sex (%)
Sexual Behavior - Average number of times people have vaginal or anal sex a year
Sexual Behavior - People having sex without condom (%)
Sexual Behavior - Average number of male sex partners in lifetime (females 18+)
Sexual Behavior - Average number of male vaginal sex partners in lifetime (females 18+)
Sexual Behavior - Average number of female sex partners in lifetime (females 18+)
Sexual Behavior - Circumcised males 18+ (%)
Sleep Disorders - Average hours sleeping at night
Sleep Disorders - People that has trouble sleeping (%)
Smoking-Cigarette Use - People smoking cigarettes (%)
Taste & Smell - People 40+ having problems with smell (%)
Taste & Smell - People 40+ having problems with taste (%)
Taste & Smell - People 40+ that ever had wisdom teeth removed (%)
Taste & Smell - People 40+ that ever had tonsils teeth removed (%)
Taste & Smell - People 40+ that ever had a loss of consciousness because of a head injury (%)
Taste & Smell - People 40+ that ever had a broken nose or other serious injury to face or skull (%)
Taste & Smell - People 40+ that ever had two or more sinus infections (%)
Weight - Average height (inches)
Weight - Average weight (pounds)
Weight - Average BMI
Weight - People that are obese (%)
Weight - People that ever were obese (%)
Weight - People trying to lose weight (%)
According to our research of Maryland and other state lists, there were 11 registered sex offenders living in Bethesda, Maryland as of April 23, 2024 . The ratio of all residents to sex offenders in Bethesda is 5,789 to 1.The ratio of registered sex offenders to all residents in this city is much lower than the state average.
Latest news from Bethesda, MD collected exclusively by city-data.com from local newspapers, TV, and radio stations
Bethesda, MD City Guides: Ancestries: Irish (6.2%), Eastern European (5.8%), English (4.9%), American (4.8%), European (4.6%), Russian (4.5%).
Current Local Time:
Land area: 13.1 square miles.
Population density: 5,214 people per square mile (average).
16,729 residents are foreign born (9.9% Asia , 6.5% Europe , 4.7% Latin America ).
This place:
25.3%Maryland:
15.7%
Median real estate property taxes paid for housing units with mortgages in 2022: $10,001 (0.9%)Median real estate property taxes paid for housing units with no mortgage in 2022: $9,325 (0.9%)
Nearest city with pop. 200,000+: Washington, DC
Nearest city with pop. 1,000,000+: Philadelphia, PA
Nearest cities:
Latitude: 38.98 N, Longitude: 77.11 W
Daytime population change due to commuting: +42,134 (+61.5%)Workers who live and work in this place: 19,948 (55.8%)
Property values in Bethesda, MD
Bethesda tourist attractions:
Unemployment in December 2023:
Most common industries in Bethesda, MD (%)
Both Males Females
Professional, scientific, technical services (25.1%)
Public administration (12.5%)
Educational services (9.4%)
Health care (8.6%)
Finance & insurance (8.3%)
Religious, grantmaking, civic, professional, similar organizations (4.8%)
Real estate & rental & leasing (3.0%)
Professional, scientific, technical services (28.8%)
Public administration (14.0%)
Finance & insurance (10.5%)
Health care (6.9%)
Educational services (5.5%)
Real estate & rental & leasing (3.6%)
Religious, grantmaking, civic, professional, similar organizations (3.4%)
Professional, scientific, technical services (21.2%)
Educational services (13.5%)
Public administration (10.8%)
Health care (10.4%)
Religious, grantmaking, civic, professional, similar organizations (6.2%)
Finance & insurance (6.1%)
Private households (3.1%)
Tornado activity:
Bethesda-area historical tornado activity is slightly above Maryland state average. It is 11% greater than the overall U.S. average.
On 4/28/2002, a category F4 (max. wind speeds 207-260 mph) tornado 30.3 miles away from the Bethesda place center killed 3 people and injured 122 people and caused $124 million in damages.
On 9/24/2001, a category F3 (max. wind speeds 158-206 mph) tornado 8.1 miles away from the place center killed 2 people and injured 55 people and caused $101 million in damages.
Earthquake activity:
Bethesda-area historical earthquake activity is significantly above Maryland state average. It is 57% smaller than the overall U.S. average. On 8/23/2011 at 17:51:04, a magnitude 5.8 (5.8 MW, Depth: 3.7 mi, Class: Moderate, Intensity: VI - VII) earthquake occurred 86.7 miles away from Bethesda center On 8/25/2011 at 05:07:52, a magnitude 4.5 (4.5 ML, Depth: 4.2 mi, Class: Light, Intensity: IV - V) earthquake occurred 85.4 miles away from the city center On 1/16/1994 at 01:49:16, a magnitude 4.6 (4.6 MB, 4.6 LG, Depth: 3.1 mi) earthquake occurred 109.3 miles away from Bethesda center On 12/9/2003 at 20:59:18, a magnitude 4.5 (4.5 ML, Depth: 6.2 mi) earthquake occurred 99.4 miles away from Bethesda center On 12/9/2003 at 20:59:14, a magnitude 4.5 (4.5 MB, 4.5 LG) earthquake occurred 105.8 miles away from Bethesda center On 9/25/1998 at 19:52:52, a magnitude 5.2 (4.8 MB, 4.3 MS, 5.2 LG, 4.5 MW, Depth: 3.1 mi) earthquake occurred 245.1 miles away from Bethesda center Magnitude types: regional Lg-wave magnitude (LG), body-wave magnitude (MB), local magnitude (ML), surface-wave magnitude (MS), moment magnitude (MW) Natural disasters: The number of natural disasters in Montgomery County (19) is greater than the US average (15).Major Disasters (Presidential) Declared: 14Emergencies Declared: 5Hurricanes: 5, Winter Storms: 5, Snowstorms: 4, Storms: 4, Floods: 3, Winds: 2, Blizzard: 1, Heavy Rain: 1, Snowfall: 1, Tornado: 1, Tropical Storm: 1, Other: 1 (Note: some incidents may be assigned to more than one category). Main business address for: AMERICAN CAPITAL STRATEGIES LTD SERVICES-BUSINESS SERVICES, NEC ), MARRIOTT INTERNATIONAL INC /MD/ HOTELS & MOTELS ), HOST MARRIOTT L P HOTELS & MOTELS ), HOST MARRIOTT CORP/ REAL ESTATE INVESTMENT TRUSTS ), EAGLE BANCORP INC STATE COMMERCIAL BANKS ), COVENTRY HEALTH CARE INC HOSPITAL & MEDICAL SERVICE PLANS ), SBM CERTIFICATE CO and 8 other public companies .
Hospitals and medical centers in Bethesda: SUBURBAN HOSPITAL (Voluntary non-profit - Private, 8600 OLD GEORGETOWN RD) BETHESDA HEALTH AND REHABILITATION (5721 GROSVENOR LANE)
CARRIAGE HILL BETHESDA (5215 CEDAR LANE)
MANORCARE HEALTH SERVICES - BETHESDA (6530 DEMOCRACY BOULEVARD)
MAPLEWOOD PARK PLACE (9707 OLD GEORGETOWN ROAD)
SUBURBAN HOSPITAL SKILLED NSG (8600 OLD GEORGETOWN ROAD)
BMA - BETHESDA (6420 ROCKLEDGE DR)
US RENAL CARE - CHEVY CHASE (3 BETHESDA METRO CENTER STE B005)
PROFESSIONAL HEALTHCARE RESOURCES OF MARYLAND (10114 MOTOR CITY DRIVE, SUITE 300)
Amtrak stations near Bethesda: 8 miles: ROCKVILLE (HUNGERFORD DR. & PARK ST.) Services: partially wheelchair accessible, public payphones, paid short-term parking, paid long-term parking, call for taxi service, public transit connection.
9 miles: WASHINGTON (50 MASSACHUSETTS AVE. N.E.) Services: ticket office, fully wheelchair accessible, enclosed waiting area, public restrooms, public payphones, full-service food facilities and snack bar, ATM, paid short-term parking, paid long-term parking, car rental agency, taxi stand, public transit connection.
13 miles: ALEXANDRIA (110 CALLAHAN DR.) Services: ticket office, partially wheelchair accessible, enclosed waiting area, public restrooms, public payphones, vending machines, ATM, free short-term parking, free long-term parking, call for car rental service, call for taxi service, public transit connection.
Colleges/Universities in Bethesda: DeVry University-Maryland Full-time enrollment: 178; Location: 4550 Montgomery Ave., Ste 100 N; Private, for-profit; Website: www.devry.edu; Offers Master's degree )
DeVry University's Keller Graduate School of Management-Maryland Location: 4550 Montgomery Avenue, Suite 100 North; Private, for-profit; Website: www.keller.edu; Offers Master's degree )
DeVry University-Maryland Location: 4550 Montgomery Ave, Suite 100 North; Private, for-profit; Website: www.devry.edu)
Colleges/universities with over 2000 students nearest to Bethesda:
American University (about 4 miles; Washington, DC ; Full-time enrollment: 9,850)
University of the District of Columbia (about 4 miles; Washington, DC ; FT enrollment: 3,675)
Marymount University (about 6 miles; Arlington, VA ; FT enrollment: 3,361)
Georgetown University (about 6 miles; Washington, DC ; FT enrollment: 12,535)
Strayer University-Virginia (about 7 miles; Arlington, VA ; FT enrollment: 7,005)
Howard University (about 7 miles; Washington, DC ; FT enrollment: 7,838)
George Washington University (about 7 miles; Washington, DC ; FT enrollment: 18,928)
Public high schools in Bethesda:
Private high schools in Bethesda: STONE RIDGE SCHOOL OF THE SACRED HEART Students: 661, Location: 9101 ROCKVILLE PIKE, Grades: PK-12, Girls only )
HOLTON-ARMS SCHOOL Students: 644, Location: 7303 RIVER RD, Grades: 3-12, Girls only )
WASHINGTON WALDORF SCHOOL Students: 205, Location: 4800 SANGAMORE RD, Grades: 1-12)
THE GREENTREE SCHOOL Students: 4, Location: 6301 GREENTREE RD, Grades: UG-9)
Biggest public elementary/middle schools in Bethesda: ASHBURTON ELEMENTARY Location: 6314 LONE OAK DR, Grades: PK-5)BANNOCKBURN ELEMENTARY Location: 6520 DALROY LN, Grades: PK-5)BETHESDA ELEMENTARY Location: 7600 ARLINGTON RD, Grades: PK-5)BRADLEY HILLS ELEMENTARY Location: 8701 HARTSDALE AVE, Grades: PK-5)BURNING TREE ELEMENTARY Location: 7900 BEECH TREE RD, Grades: PK-6)CARDEROCK SPRINGS ELEMENTARY Location: 7401 PERSIMMON TREE LANE, Grades: KG-5)ROCK CREEK FOREST ELEMENTARY Location: 7000 RADNOR RD, Grades: PK-5)
SEVEN LOCKS ELEMENTARY Location: 9500 SEVEN LOCKS ROAD, Grades: PK-5)WESTBROOK ELEMENTARY Location: 5110 ALLAN TER, Grades: PK-5)WESTLAND MIDDLE Location: 5511 MASSACHUSETTS AVE, Grades: 6-8)Biggest private elementary/middle schools in Bethesda: ST JANE DE CHANTAL SCHOOL Students: 501, Location: 9525 OLD GEORGETOWN RD, Grades: KG-8)
THE WOODS ACADEMY Students: 295, Location: 6801 GREENTREE RD, Grades: PK-8)
WASHINGTON EPISCOPAL SCHOOL Students: 281, Location: 5600 LITTLE FALLS PKWY, Grades: PK-8)
LITTLE FLOWER SCHOOL Students: 280, Location: 5601 MASSACHUSETTS AVE, Grades: PK-8)
OUR LADY OF LOURDES SCHOOL Students: 257, Location: 7500 PEARL ST, Grades: PK-8)
MATER DEI SCHOOL Students: 223, Location: 9600 SEVEN LOCKS RD, Grades: 1-8, Boys only )
ST BARTHOLOMEWS SCHOOL Students: 216, Location: 6900 RIVER RD, Grades: PK-8)
THE PRIMARY DAY SCHOOL Students: 135, Location: 7300 RIVER RD, Grades: PK-2)
HARBOR SCHOOL Students: 106, Location: 7701 BRADLEY BLVD UNIT A, Grades: PK-2)LONE OAK MONTESSORI SCHOOL OLD GEORGETOWN CAMPUS Students: 81, Location: 10100 OLD GEORGETOWN RD, Grades: UG-5)
See full list of schools located in Bethesda User-submitted facts and corrections:
Bethesda-Chevy Chase High School should be added to the list of public high schools in Bethesda, MD. added by a B-CC parent
The major public high school is Bethesda Chevy Chase HS on East West Highway in Bethesda. It has a national reputation. President Kennedy, among other presidents, addressed the graduation class.
You omit Bethesda Chevy Chase High School from your list of high schools. It is the most central high school in Bethesda, located in the middle of downtown Bethesda.
Notable locations in Bethesda: (A) , Kenwood Country Club (B) , Bethesda Metro Station (C) , Friendship Heights Subway Station (D) , Medical Center Metro Station (E) , Burning Tree Country Club (F) , National Institutes of Health Fire Department Station 51 (G) , Boy Scouts of America Headquarters (H) , Bethesda Fire Department Station 20 (I) , Bethesda Library (J) , Little Falls Library (K) , Bethesda Annex Police Station (L) , Bethesda Fire Department Station 6 (M) , Bethesda Chevy Chase Rescue Squad Rescue 1 (N) , Glen Echo Volunteer Fire Department Station 11 (O) , National Library of Medicine (P) , Bethesda Regional Library (Q) , Maplewood Park Place Assisted Living Center (R) , National Institutes of Health (S) , Eckankar Reading Room (T) . Display/hide their locations on the map
Shopping Centers: (1) , Bethesda Square Shopping Center (2) . Display/hide their locations on the map
Main business address in Bethesda include: (A) , COSTAR GROUP INC (B) , EAGLE BANCORP INC (C) , SBM CERTIFICATE CO (D) . Display/hide their locations on the map
Churches in Bethesda include: (A) , Saint Dunstans Episcopal Church (B) , Bethesda United Methodist Church (C) , Self Revelation Church (D) , Our Lady of Lourdes Church (E) , Bethesda First Baptist Church (F) , Bethesda Presbyterian Church (G) , Briggs Memorial Baptist Church (H) , Christ Lutheran Church (I) . Display/hide their locations on the map
Reservoir: (A) . Display/hide its location on the map
Streams, rivers, and creeks: (A) , Willett Branch (B) . Display/hide their locations on the map
Parks in Bethesda include: (1) , Fernwood Park (2) , Bradley Hills Park (3) , Merrimack Park (4) , Ayrlawn Park (5) . Display/hide their locations on the map
Tourist attractions:
Hotels:
Courts:
Birthplace of: Ed Brubaker - Writer, Michael Cerveris - Film actor, Trace Armstrong - College football player, Jo Ann Emerson - Politician, Mike Brey - Basketball player-coach, Lisa Loeb - (born 1968), musician, singer-songwriter, Brian Hinman - Businessman, Brian McComas - Country singer, Robert Gordon (musician) - Male singer, Gordon Douglas Yntema - Army Medal of Honor recipient.
Montgomery County has a predicted average indoor radon screening level greater than 4 pCi/L (pico curies per liter) - Highest Potential Drinking water stations with addresses in Bethesda and their reported violations in the past:
MARYLAND MANOR MOBILE HOME PARK (Address: 4922 FAIRMONT AVE Population served: 810, Groundwater):
Past monitoring violations:
Follow-up Or Routine LCR Tap M/R - In OCT-01-2006, Contaminant: Lead and Copper Rule. Follow-up actions: St Violation/Reminder Notice (SEP-10-2007), St Compliance achieved (JUN-06-2008)
One routine major monitoring violation
Address: 7920 NORFOLK AVENUE SUITE 920 Serves WV, Population served: 400, Groundwater):
Past monitoring violations:
One regular monitoring violation
Address: BLDG 13, ROOM 2S11, MSC 5746 Population served: 150, Groundwater):
Past monitoring violations:
Follow-up Or Routine LCR Tap M/R - In OCT-01-2004, Contaminant: Lead and Copper Rule. Follow-up actions: St Violation/Reminder Notice (JUN-15-2005), St Compliance achieved (JUL-21-2005)
One routine major monitoring violation
Population served: 70, Groundwater):
Past monitoring violations:
Lead Consumer Notice - In JAN-01-2013, Contaminant: Lead and Copper Rule. Follow-up actions: St Violation/Reminder Notice (JUL-24-2012), St Compliance achieved (APR-12-2013)
Follow-up Or Routine LCR Tap M/R - In OCT-01-2012, Contaminant: Lead and Copper Rule. Follow-up actions: St Compliance achieved (NOV-09-2012)
One regular monitoring violation
Average household size: This place:
2.4 peopleMaryland:
2.6 people
Percentage of family households: This place:
61.5%Whole state:
67.1%
Percentage of households with unmarried partners: This place:
3.8%Whole state:
6.4%
Likely homosexual households (counted as self-reported same-sex unmarried-partner households)
Lesbian couples: 0.3% of all households Gay men: 0.3% of all households
People in group quarters in Bethesda in 2010:
297 people in nursing facilities/skilled-nursing facilities
214 people in military barracks and dormitories (nondisciplinary)
54 people in other noninstitutional facilities
53 people in emergency and transitional shelters (with sleeping facilities) for people experiencing homelessness
51 people in military treatment facilities with assigned patients
42 people in college/university student housing
16 people in group homes for juveniles (non-correctional)
8 people in group homes intended for adults
2 people in workers' group living quarters and job corps centers
People in group quarters in Bethesda in 2000:
394 people in military barracks, etc.
152 people in nursing homes
111 people in other noninstitutional group quarters
50 people in other group homes
44 people in hospitals/wards and hospices for chronically ill
44 people in hospices or homes for chronically ill
28 people in religious group quarters
17 people in hospitals or wards for drug/alcohol abuse
Banks with most branches in Bethesda (2011 data):
Capital One, National Association: 10 branches. Info updated 2011/07/01: Bank assets: $133,477.8 mil, Deposits: $97,063.7 mil, headquarters in Mclean, VA, positive income , 984 total offices , Holding Company: Capital One Financial Corporation
SunTrust Bank: Bethesda Office Center Branch, Wildwood Manor Branch, Westwood Branch, Sumner Place Branch. Info updated 2010/05/27: Bank assets: $171,291.7 mil, Deposits: $129,833.2 mil, headquarters in Atlanta, GA, positive income , Commercial Lending Specialization, 1716 total offices , Holding Company: Suntrust Banks, Inc.
PNC Bank, National Association: Wildwood Branch, Bethesda Montgomery Court Branch, Little Falls Branch, Bethesda Branch. Info updated 2012/03/20: Bank assets: $263,309.6 mil, Deposits: $197,343.0 mil, headquarters in Wilmington, DE, positive income , Commercial Lending Specialization, 3085 total offices , Holding Company: Pnc Financial Services Group, Inc., The
Wells Fargo Bank, National Association: Westlake Crossing, Bethesda Branch, Bethesda North Branch. Info updated 2011/04/05: Bank assets: $1,161,490.0 mil, Deposits: $905,653.0 mil, headquarters in Sioux Falls, SD, positive income , 6395 total offices , Holding Company: Wells Fargo & Company
United Bank: Community Branch, Bethesda Metro, Kenwood Branch. Info updated 2007/08/13: Bank assets: $3,634.1 mil, Deposits: $2,729.4 mil, headquarters in Fairfax, VA, positive income , Commercial Lending Specialization, 57 total offices , Holding Company: United Bankshares, Inc.
Bank of America, National Association: River Road Branch, Bethesda Branch, Democracy Boulevard Branch. Info updated 2009/11/18: Bank assets: $1,451,969.3 mil, Deposits: $1,077,176.8 mil, headquarters in Charlotte, NC, positive income , 5782 total offices , Holding Company: Bank Of America Corporation
Manufacturers and Traders Trust Company: One Bethesda Center Branch, Wildwood Branch, Woodmont Triangle Branch. Info updated 2011/08/08: Bank assets: $76,887.1 mil, Deposits: $60,064.2 mil, headquarters in Buffalo, NY, positive income , Commercial Lending Specialization, 808 total offices , Holding Company: M&T Bank Corporation
Presidential Bank, FSB: Www.Presidential.com Branch at 4520 East-West Hwy, branch established on 2010/07/01; Presidential Bank, Fsb at 4520 East-West Highway, branch established on 1985/04/15. Info updated 2011/07/21: Bank assets: $548.4 mil, Deposits: $497.1 mil, local headquarters , positive income , Commercial Lending Specialization, 10 total offices
Sandy Spring Bank: Wildwood Branch at 10329 Old Georgetown Road, branch established on 1966/01/01; Bethesda Branch at 7126 Wisconsin Avenue, branch established on 1983/06/28. Info updated 2007/07/17: Bank assets: $3,709.4 mil, Deposits: $2,664.0 mil, headquarters in Olney, MD, positive income , Commercial Lending Specialization, 43 total offices , Holding Company: Sandy Spring Bancorp, Inc.
16 other banks with 16 local branches
For population 15 years and over in Bethesda:
Never married: 30.4%Now married: 55.7%Separated: 0.7%Widowed: 4.9%Divorced: 8.2% For population 25 years and over in Bethesda:
High school or higher: 97.7%Bachelor's degree or higher: 87.7%Graduate or professional degree: 58.7%Unemployed: 2.5%Mean travel time to work (commute): 18.4 minutes
Education Gini index (Inequality in education) Here:
8.9Maryland average:
12.7
Religion statistics for Bethesda, MD (based on Montgomery County data)
Religion Adherents Congregations Catholic 122,569 39 Evangelical Protestant 104,377 319 Mainline Protestant 73,637 186 Other 70,946 153 Orthodox 9,889 14 Black Protestant 3,189 22 None 587,170 -
Source: Clifford Grammich, Kirk Hadaway, Richard Houseal, Dale E.Jones, Alexei Krindatch, Richie Stanley and Richard H.Taylor. 2012. 2010 U.S.Religion Census: Religious Congregations & Membership Study. Association of Statisticians of American Religious Bodies. Jones, Dale E., et al. 2002. Congregations and Membership in the United States 2000. Nashville, TN: Glenmary Research Center. Graphs represent county-level data
Food Environment Statistics: Number of grocery stores : 203Montgomery County :
2.16 / 10,000 pop.Maryland :
1.96 / 10,000 pop.
Number of supercenters and club stores : 2This county :
0.02 / 10,000 pop.Maryland :
0.07 / 10,000 pop.
Number of convenience stores (no gas) : 94Montgomery County :
1.00 / 10,000 pop.Maryland :
1.22 / 10,000 pop.
Number of convenience stores (with gas) : 134Here :
1.42 / 10,000 pop.Maryland :
2.05 / 10,000 pop.
Number of full-service restaurants : 556Here :
5.91 / 10,000 pop.Maryland :
5.40 / 10,000 pop.
Adult diabetes rate : This county :
6.7%Maryland :
9.1%
Adult obesity rate : Montgomery County :
18.8%State :
26.7%
Low-income preschool obesity rate : Montgomery County :
19.9%Maryland :
15.5%
Health and Nutrition: Healthy diet rate : This city:
59.4%State:
50.1%
Average overall health of teeth and gums : Bethesda:
60.1%Maryland:
47.6%
Average BMI : Bethesda:
27.3Maryland:
28.8
People feeling badly about themselves : People not drinking alcohol at all : Average hours sleeping at night : Overweight people : This city:
32.8%Maryland:
34.1%
General health condition : This city:
64.6%State:
56.5%
Average condition of hearing : This city:
81.8%Maryland:
80.5%
More about Health and Nutrition of Bethesda, MD Residents
6.39% of this county's 2021 resident taxpayers lived in other counties in 2020 ($98,213 average adjusted gross income )
Here:
6.39%Maryland average:
7.42%
0.04% of residents moved from foreign countries ($657 average AGI )Montgomery County:
0.04%Maryland average:
0.05%
Top counties from which taxpayers relocated into this county between 2020 and 2021:
7.69% of this county's 2020 resident taxpayers moved to other counties in 2021 ($102,008 average adjusted gross income )
Here:
7.69%Maryland average:
7.91%
0.05% of residents moved to foreign countries ($861 average AGI )Montgomery County:
0.05%Maryland average:
0.04%
Top counties to which taxpayers relocated from this county between 2020 and 2021:
Businesses in Bethesda, MD
Name Count Name Count
7-Eleven 3 Hot Topic 1 ALDO 1 Hyatt 1 AT&T 3 J. Jill 1 Abercrombie & Fitch 1 J.Crew 1 Abercrombie Kids 1 JoS. A. Bank 1 Aeropostale 1 Jones New York 4 American Eagle Outfitters 1 Journeys 1 Ann Taylor 1 Lane Furniture 1 Apple Store 2 LensCrafters 1 Baja Fresh Mexican Grill 1 Macy's 1 Bakers 1 Marriott 3 Banana Republic 1 MasterBrand Cabinets 2 Barnes & Noble 1 McDonald's 4 Bath & Body Works 1 Men's Wearhouse 1 Bebe 1 Motherhood Maternity 1 Bentleymotors.Com 1 New Balance 5 Brookstone 1 Nike 5 Budget Car Rental 1 Nissan 1 CVS 5 Nordstrom 1 Cache 1 Old Navy 1 Caribou Coffee 2 Pac Sun 1 Chick-Fil-A 1 Panda Express 1 Chico's 1 Payless 1 Chipotle 2 Penske 1 Clarks 1 PetSmart 1 Crate & Barrel 1 Qdoba Mexican Grill 1 Curves 1 Quiznos 2 DHL 3 RadioShack 3 Dairy Queen 1 Rite Aid 1 Domino's Pizza 2 Safeway 2 Dunkin Donuts 2 Sears 2 Express 1 Sephora 1 FedEx 30 Soma Intimates 1 Finish Line 1 Sprint Nextel 1 Foot Locker 1 Starbucks 7 Forever 21 1 Subway 4 GNC 4 The Limited 1 GameStop 1 Torrid 1 Gap 1 Trader Joe's 1 Giant 3 True Value 3 Gymboree 1 UPS 30 H&R Block 2 Vans 4 Haagen-Dazs 2 Verizon Wireless 2 Hilton 1 Victoria's Secret 1 Hollister Co. 1 Vons 2 Home Depot 1 Whole Foods Market 1 Honda 1 YMCA 2
Strongest AM radio stations in Bethesda:
WTOP (1500 AM; 50 kW; WASHINGTON, DC; Owner: BONNEVILLE HOLDING COMPANY)
WMAL (630 AM; 5 kW; WASHINGTON, DC; Owner: WMAL, INC.)
WTEM (980 AM; 50 kW; WASHINGTON, DC; Owner: AMFM RADIO LICENSES, L.L.C.)
WUST (1120 AM; daytime; 20 kW; WASHINGTON, DC)
WWRC (1260 AM; 5 kW; WASHINGTON, DC; Owner: AMFM RADIO LICENSES, L.L.C.)
WTNT (570 AM; 5 kW; BETHESDA, MD; Owner: AMFM RADIO LICENSES, L.L.C.)
WMET (1150 AM; 50 kW; GAITHERSBURG, MD; Owner: BELTWAY ACQUISITION CORPORATION)
WPGC (1580 AM; 50 kW; MORNINGSIDE, MD; Owner: INFINITY WPGC(AM), INC.)
WABS (780 AM; daytime; 5 kW; ARLINGTON, VA; Owner: SALEM MEDIA OF VIRGINIA, INC.)
WACA (1540 AM; daytime; 5 kW; WHEATON, MD; Owner: AC ACQUISITION, LLC)
WZHF (1390 AM; 5 kW; ARLINGTON, VA; Owner: WAY BROADCASTING, INC.)
WCBM (680 AM; 50 kW; BALTIMORE, MD; Owner: WCBM MARYLAND, INC.)
WCTN (950 AM; 2 kW; POTOMAC-CABIN JOHN, MD; Owner: SEVEN LOCKS BROADCASTING COMPANY, INC.)
Strongest FM radio stations in Bethesda:
WARW (94.7 FM; BETHESDA, MD; Owner: INFINITY BROADCASTING OPERATIONS, INC.)
WIHT (99.5 FM; WASHINGTON, DC; Owner: AMFM RADIO LICENSES, L.L.C.)
WASH (97.1 FM; WASHINGTON, DC; Owner: AMFM RADIO LICENSES, L.L.C.)
WRQX (107.3 FM; WASHINGTON, DC; Owner: WMAL, INC.)
WHUR-FM (96.3 FM; WASHINGTON, DC; Owner: THE HOWARD UNIVERSITY)
WWDC-FM (101.1 FM; WASHINGTON, DC; Owner: AMFM RADIO LICENSES, L.L.C.)
WKYS (93.9 FM; WASHINGTON, DC; Owner: RADIO ONE LICENSES, LLC)
WGMS-FM (103.5 FM; WASHINGTON, DC; Owner: BONNEVILLE HOLDING COMPANY)
WAMU (88.5 FM; WASHINGTON, DC; Owner: THE EXEC. COMM. OF THE BD. OF TRUSTEES OF AMERICAN UNIV.)
WMMJ (102.3 FM; BETHESDA, MD; Owner: RADIO ONE LICENSES, LLC)
WPFW (89.3 FM; WASHINGTON, DC; Owner: PACIFICA FOUNDATION, INC.)
WCSP-FM (90.1 FM; WASHINGTON, DC; Owner: NATIONAL CABLE SATELLITE CORPORATION)
WGTS (91.9 FM; TAKOMA PARK, MD; Owner: COLUMBIA UNION COLLEGE BROADCASTING, INC.)
WBIG-FM (100.3 FM; WASHINGTON, DC; Owner: AMFM RADIO LICENSES, L.L.C.)
WETA (90.9 FM; WASHINGTON, DC; Owner: GREATER WASHINGTON EDUCATIONAL TELECOMMUNICATIONS ASSN.)
WAVA (105.1 FM; ARLINGTON, VA; Owner: SALEM MEDIA OF VIRGINIA, INC.)
WJFK-FM (106.7 FM; MANASSAS, VA; Owner: INFINITY BROADCASTING CORP. OF WASHINGTON, DC)
WMZQ-FM (98.7 FM; WASHINGTON, DC; Owner: AMFM RADIO LICENSES, L.L.C.)
WJZW (105.9 FM; WOODBRIDGE, VA; Owner: WMAL, INC.)
WPGC-FM (95.5 FM; MORNINGSIDE, MD; Owner: INFINITY BROADCASTING CORPORATION OF MARYLAND)
TV broadcast stations around Bethesda:
WETA-TV (Channel 26; WASHINGTON, DC; Owner: THE GREATER WASHINGTON ED TELECOMM. ASSOC)
WDCA (Channel 20; WASHINGTON, DC; Owner: FOX TELEVISION STATIONS, INC.)
WTTG (Channel 5; WASHINGTON, DC; Owner: FOX TELEVISION STATIONS, INC.)
WJLA-TV (Channel 7; WASHINGTON, DC; Owner: ACC LICENSEE, INC.)
WUSA (Channel 9; WASHINGTON, DC; Owner: THE DETROIT NEWS, INC.)
WHUT-TV (Channel 32; WASHINGTON, DC; Owner: HOWARD UNIVERSITY)
WRC-TV (Channel 4; WASHINGTON, DC; Owner: NBC SUBSIDIARY (WRC-TV), INC.)
WBDC-TV (Channel 50; WASHINGTON, DC; Owner: WBDC BROADCASTING, INC.)
W28BY (Channel 63; BALTIMORE, MD; Owner: INFORMATION SUPER STATION, L.L.C.)
WMDO-CA (Channel 30; WASHINGTON, DC; Owner: ENTRAVISION HOLDINGS, LLC)
WZDC-LP (Channel 64; WASHINGTON, DC; Owner: ONDA CAPITAL, INC.)
WKRP-LP (Channel 42; WASHINGTON, DC; Owner: CAPITAL MEDIA, LLC)
WNVC (Channel 56; FAIRFAX, VA; Owner: COMMONWEALTH PUBLIC BROADCASTING CORPORATION)
WBAL-TV (Channel 11; BALTIMORE, MD; Owner: WBAL HEARST-ARGYLE TV, INC. (CA CORP.))
WMAR-TV (Channel 2; BALTIMORE, MD; Owner: SCRIPPS HOWARD BROADCASTING COMPANY)
WMPT (Channel 22; ANNAPOLIS, MD; Owner: MARYLAND PUBLIC BROADCASTING COMMISSION)
WBFF (Channel 45; BALTIMORE, MD; Owner: CHESAPEAKE TELEVISION LICENSEE, LLC)
WNUV (Channel 54; BALTIMORE, MD; Owner: BALTIMORE (WNUV-TV) LICENSEE, INC.)
WUTB (Channel 24; BALTIMORE, MD; Owner: FOX TELEVISION STATIONS, INC.)
WPXW (Channel 66; MANASSAS, VA; Owner: PAXSON WASHINGTON LICENSE, INC.)
WMPB (Channel 67; BALTIMORE, MD; Owner: MARYLAND PUBLIC BROADCASTING COMMISSION)
WJZ-TV (Channel 13; BALTIMORE, MD; Owner: VIACOM INC.)
WIAV-LP (Channel 58; WASHINGTON, DC; Owner: ASIAVISION, INC.)
W42BE (Channel 42; FAIRFAX, VA; Owner: FAIRFAX LOW POWER CO.)
WNVT (Channel 53; GOLDVEIN, VA; Owner: COMMONWEALTH PUBLIC BROADCASTING CORPORATION)
Medal of Honor Recipients
Medal of Honor Recipient born in Bethesda: Gordon Douglas Yntema.
National Bridge Inventory (NBI) Statistics 39 Number of bridges456ft / 139m Total length $641,820,000 Total costs2,082,568 Total average daily traffic107,145 Total average daily truck traffic
New bridges - historical statistics
1 Before 1900 1 1930-1939 1 1940-1949 3 1950-1959 21 1960-1969 1 1970-1979 7 1980-1989 3 2000-2009 1 2010-2019
See full National Bridge Inventory statistics for Bethesda, MD
Home Mortgage Disclosure Act Aggregated Statistics For Year 2009(Based on 13 full and 3 partial tracts) A) FHA, FSA/RHS & VA B) Conventional C) Refinancings D) Home Improvement Loans E) Loans on Dwellings For 5+ Families F) Non-occupant Loans on Number Average Value Number Average Value Number Average Value Number Average Value Number Average Value Number Average Value
LOANS ORIGINATED 102 $522,776 718 $517,867 2,931 $450,782 75 $285,525 0 $0 131 $328,232 APPLICATIONS APPROVED, NOT ACCEPTED 6 $611,233 41 $615,917 175 $471,608 9 $116,271 0 $0 13 $395,622 APPLICATIONS DENIED 10 $422,759 60 $537,131 413 $533,785 25 $391,935 1 $144,640 26 $391,722 APPLICATIONS WITHDRAWN 17 $501,878 111 $531,104 442 $473,749 16 $270,304 0 $0 21 $334,849 FILES CLOSED FOR INCOMPLETENESS 2 $587,000 16 $547,253 111 $418,580 2 $387,110 0 $0 5 $337,254
Aggregated Statistics For Year 2008(Based on 13 full and 3 partial tracts) A) FHA, FSA/RHS & VA B) Conventional C) Refinancings D) Home Improvement Loans E) Loans on Dwellings For 5+ Families F) Non-occupant Loans on G) Loans On Manufactured Number Average Value Number Average Value Number Average Value Number Average Value Number Average Value Number Average Value Number Average Value
LOANS ORIGINATED 34 $523,994 824 $530,326 839 $479,815 75 $355,525 2 $14,872,550 94 $451,298 1 $88,000 APPLICATIONS APPROVED, NOT ACCEPTED 2 $453,710 94 $541,552 133 $466,941 11 $231,641 0 $0 20 $347,146 1 $106,000 APPLICATIONS DENIED 9 $436,939 75 $635,202 189 $523,843 24 $318,776 0 $0 28 $390,101 0 $0 APPLICATIONS WITHDRAWN 5 $415,856 161 $594,383 167 $535,559 15 $410,469 0 $0 21 $434,930 0 $0 FILES CLOSED FOR INCOMPLETENESS 0 $0 23 $523,465 27 $458,910 7 $135,236 0 $0 5 $514,802 0 $0
Aggregated Statistics For Year 2007(Based on 13 full and 3 partial tracts) A) FHA, FSA/RHS & VA B) Conventional C) Refinancings D) Home Improvement Loans F) Non-occupant Loans on Number Average Value Number Average Value Number Average Value Number Average Value Number Average Value
LOANS ORIGINATED 1 $288,260 1,069 $557,598 758 $472,972 115 $366,931 121 $372,681 APPLICATIONS APPROVED, NOT ACCEPTED 0 $0 101 $501,477 143 $448,069 17 $212,629 16 $468,218 APPLICATIONS DENIED 2 $216,500 100 $687,795 208 $582,442 25 $327,899 34 $393,032 APPLICATIONS WITHDRAWN 0 $0 91 $593,774 128 $503,228 20 $306,752 18 $426,999 FILES CLOSED FOR INCOMPLETENESS 0 $0 24 $650,252 32 $400,802 6 $156,865 5 $401,510
Aggregated Statistics For Year 2006(Based on 13 full and 3 partial tracts) B) Conventional C) Refinancings D) Home Improvement Loans F) Non-occupant Loans on Number Average Value Number Average Value Number Average Value Number Average Value
LOANS ORIGINATED 1,100 $529,457 888 $457,485 134 $303,510 145 $391,644 APPLICATIONS APPROVED, NOT ACCEPTED 88 $461,843 144 $349,350 29 $180,199 10 $269,548 APPLICATIONS DENIED 90 $494,703 199 $514,881 36 $324,483 30 $454,509 APPLICATIONS WITHDRAWN 101 $470,198 186 $490,340 9 $537,319 24 $309,740 FILES CLOSED FOR INCOMPLETENESS 10 $555,688 41 $428,927 9 $124,047 3 $590,523
Aggregated Statistics For Year 2005(Based on 13 full and 3 partial tracts) A) FHA, FSA/RHS & VA B) Conventional C) Refinancings D) Home Improvement Loans E) Loans on Dwellings For 5+ Families F) Non-occupant Loans on G) Loans On Manufactured Number Average Value Number Average Value Number Average Value Number Average Value Number Average Value Number Average Value Number Average Value
LOANS ORIGINATED 0 $0 1,306 $462,277 1,516 $464,540 169 $346,738 2 $2,475,000 209 $364,471 0 $0 APPLICATIONS APPROVED, NOT ACCEPTED 0 $0 106 $437,370 164 $396,978 25 $277,288 0 $0 12 $263,411 1 $280,000 APPLICATIONS DENIED 0 $0 112 $500,048 217 $452,432 37 $258,895 0 $0 28 $391,378 1 $150,000 APPLICATIONS WITHDRAWN 0 $0 121 $496,579 249 $441,376 20 $208,172 0 $0 26 $294,550 0 $0 FILES CLOSED FOR INCOMPLETENESS 1 $50,000 17 $516,402 65 $481,949 2 $136,000 0 $0 2 $336,000 0 $0
Aggregated Statistics For Year 2004(Based on 13 full and 3 partial tracts) A) FHA, FSA/RHS & VA B) Conventional C) Refinancings D) Home Improvement Loans F) Non-occupant Loans on G) Loans On Manufactured Number Average Value Number Average Value Number Average Value Number Average Value Number Average Value Number Average Value
LOANS ORIGINATED 2 $187,915 1,340 $436,693 1,954 $379,840 133 $291,694 197 $340,364 0 $0 APPLICATIONS APPROVED, NOT ACCEPTED 0 $0 86 $422,990 194 $313,640 32 $166,529 22 $247,723 1 $100,000 APPLICATIONS DENIED 0 $0 82 $374,151 240 $411,375 39 $248,859 29 $283,973 0 $0 APPLICATIONS WITHDRAWN 3 $161,353 115 $383,936 217 $347,764 27 $266,954 24 $321,318 0 $0 FILES CLOSED FOR INCOMPLETENESS 2 $180,000 22 $441,954 78 $388,516 7 $194,429 1 $250,000 1 $49,000
Aggregated Statistics For Year 2003(Based on 13 full and 3 partial tracts) A) FHA, FSA/RHS & VA B) Conventional C) Refinancings D) Home Improvement Loans E) Loans on Dwellings For 5+ Families F) Non-occupant Loans on Number Average Value Number Average Value Number Average Value Number Average Value Number Average Value Number Average Value
LOANS ORIGINATED 6 $231,632 1,275 $396,516 6,398 $319,647 51 $219,457 1 $968,810 292 $250,766 APPLICATIONS APPROVED, NOT ACCEPTED 0 $0 73 $406,275 516 $301,291 23 $78,399 0 $0 22 $284,998 APPLICATIONS DENIED 0 $0 85 $401,261 367 $354,748 15 $85,935 0 $0 25 $287,215 APPLICATIONS WITHDRAWN 0 $0 112 $360,959 504 $316,886 11 $52,293 0 $0 24 $248,954 FILES CLOSED FOR INCOMPLETENESS 0 $0 15 $399,375 134 $371,007 1 $806,000 0 $0 10 $251,822
Aggregated Statistics For Year 2002(Based on 13 full and 3 partial tracts) A) FHA, FSA/RHS & VA B) Conventional C) Refinancings D) Home Improvement Loans E) Loans on Dwellings For 5+ Families F) Non-occupant Loans on Number Average Value Number Average Value Number Average Value Number Average Value Number Average Value Number Average Value
LOANS ORIGINATED 12 $152,852 1,340 $334,816 4,683 $324,992 68 $83,315 2 $962,000 223 $223,371 APPLICATIONS APPROVED, NOT ACCEPTED 0 $0 75 $321,339 309 $297,637 31 $74,475 0 $0 19 $175,345 APPLICATIONS DENIED 0 $0 50 $383,921 276 $323,013 26 $97,914 0 $0 17 $212,234 APPLICATIONS WITHDRAWN 1 $242,000 89 $363,983 398 $321,156 4 $84,270 0 $0 17 $193,502 FILES CLOSED FOR INCOMPLETENESS 0 $0 20 $406,068 96 $319,706 1 $150,000 0 $0 6 $234,292
Aggregated Statistics For Year 2001(Based on 13 full and 3 partial tracts) A) FHA, FSA/RHS & VA B) Conventional C) Refinancings D) Home Improvement Loans E) Loans on Dwellings For 5+ Families F) Non-occupant Loans on Number Average Value Number Average Value Number Average Value Number Average Value Number Average Value Number Average Value
LOANS ORIGINATED 14 $189,588 1,320 $281,358 2,785 $305,618 101 $85,664 0 $0 142 $206,514 APPLICATIONS APPROVED, NOT ACCEPTED 0 $0 84 $234,511 209 $265,421 34 $74,385 0 $0 18 $200,809 APPLICATIONS DENIED 1 $120,270 44 $241,907 199 $288,336 34 $75,046 0 $0 20 $182,738 APPLICATIONS WITHDRAWN 2 $187,000 99 $271,406 250 $285,852 24 $50,903 1 $425,000 14 $233,666 FILES CLOSED FOR INCOMPLETENESS 1 $97,000 15 $432,375 64 $264,605 6 $92,213 0 $0 4 $128,042
Aggregated Statistics For Year 2000(Based on 13 full and 3 partial tracts) A) FHA, FSA/RHS & VA B) Conventional C) Refinancings D) Home Improvement Loans F) Non-occupant Loans on Number Average Value Number Average Value Number Average Value Number Average Value Number Average Value
LOANS ORIGINATED 20 $136,577 1,251 $259,979 439 $257,757 119 $71,029 67 $186,703 APPLICATIONS APPROVED, NOT ACCEPTED 0 $0 102 $202,858 74 $208,804 35 $81,773 11 $232,278 APPLICATIONS DENIED 2 $93,900 95 $212,371 124 $191,713 28 $77,616 8 $163,094 APPLICATIONS WITHDRAWN 1 $78,000 91 $270,399 124 $197,196 33 $88,367 14 $203,851 FILES CLOSED FOR INCOMPLETENESS 1 $45,900 20 $297,174 33 $229,107 6 $95,253 3 $154,087
Aggregated Statistics For Year 1999(Based on 13 full and 3 partial tracts) A) FHA, FSA/RHS & VA B) Conventional C) Refinancings D) Home Improvement Loans E) Loans on Dwellings For 5+ Families F) Non-occupant Loans on Number Average Value Number Average Value Number Average Value Number Average Value Number Average Value Number Average Value
LOANS ORIGINATED 34 $116,409 1,529 $225,509 1,339 $245,469 94 $56,475 1 $580,000 104 $169,738 APPLICATIONS APPROVED, NOT ACCEPTED 2 $127,950 80 $218,037 110 $206,900 21 $53,393 0 $0 12 $154,987 APPLICATIONS DENIED 3 $90,957 77 $209,123 176 $249,309 41 $66,106 1 $176,000 30 $119,192 APPLICATIONS WITHDRAWN 5 $111,868 93 $227,904 199 $219,878 19 $116,175 0 $0 15 $190,193 FILES CLOSED FOR INCOMPLETENESS 0 $0 18 $321,971 60 $209,228 4 $77,072 0 $0 8 $235,802
Detailed mortgage data for all 16 tracts in Bethesda, MD
Private Mortgage Insurance Companies Aggregated Statistics For Year 2009(Based on 11 full and 3 partial tracts) A) Conventional B) Refinancings C) Non-occupant Loans on Number Average Value Number Average Value Number Average Value
LOANS ORIGINATED 22 $391,526 11 $444,821 0 $0 APPLICATIONS APPROVED, NOT ACCEPTED 10 $457,442 4 $523,202 1 $414,500 APPLICATIONS DENIED 9 $486,889 4 $322,642 0 $0 APPLICATIONS WITHDRAWN 1 $158,000 0 $0 0 $0 FILES CLOSED FOR INCOMPLETENESS 1 $626,000 0 $0 0 $0
Aggregated Statistics For Year 2008(Based on 11 full and 2 partial tracts) A) Conventional B) Refinancings C) Non-occupant Loans on Number Average Value Number Average Value Number Average Value
LOANS ORIGINATED 61 $349,926 8 $434,250 2 $223,795 APPLICATIONS APPROVED, NOT ACCEPTED 8 $444,780 3 $645,587 1 $1,000,000 APPLICATIONS DENIED 7 $354,324 2 $701,500 0 $0 APPLICATIONS WITHDRAWN 2 $560,230 0 $0 0 $0 FILES CLOSED FOR INCOMPLETENESS 0 $0 0 $0 0 $0
Aggregated Statistics For Year 2007(Based on 11 full and 3 partial tracts) A) Conventional B) Refinancings Number Average Value Number Average Value
LOANS ORIGINATED 24 $370,213 6 $463,637 APPLICATIONS APPROVED, NOT ACCEPTED 1 $750,000 3 $566,667 APPLICATIONS DENIED 0 $0 1 $1,715,000 APPLICATIONS WITHDRAWN 0 $0 1 $626,160 FILES CLOSED FOR INCOMPLETENESS 1 $342,930 0 $0
Aggregated Statistics For Year 2006(Based on 9 full and 2 partial tracts) A) Conventional B) Refinancings C) Non-occupant Loans on Number Average Value Number Average Value Number Average Value
LOANS ORIGINATED 15 $348,447 3 $544,740 3 $322,280 APPLICATIONS APPROVED, NOT ACCEPTED 4 $825,955 3 $568,000 1 $997,830 APPLICATIONS DENIED 1 $387,660 0 $0 0 $0 APPLICATIONS WITHDRAWN 0 $0 1 $650,000 0 $0 FILES CLOSED FOR INCOMPLETENESS 0 $0 0 $0 0 $0
Aggregated Statistics For Year 2005(Based on 7 full and 3 partial tracts) A) Conventional B) Refinancings C) Non-occupant Loans on Number Average Value Number Average Value Number Average Value
LOANS ORIGINATED 33 $275,784 6 $377,030 0 $0 APPLICATIONS APPROVED, NOT ACCEPTED 3 $375,333 2 $248,110 1 $527,000 APPLICATIONS DENIED 1 $603,000 0 $0 0 $0 APPLICATIONS WITHDRAWN 5 $293,964 0 $0 0 $0 FILES CLOSED FOR INCOMPLETENESS 1 $570,000 0 $0 0 $0
Aggregated Statistics For Year 2004(Based on 9 full and 3 partial tracts) A) Conventional B) Refinancings C) Non-occupant Loans on Number Average Value Number Average Value Number Average Value
LOANS ORIGINATED 44 $278,835 3 $265,853 4 $390,870 APPLICATIONS APPROVED, NOT ACCEPTED 4 $271,155 4 $490,685 0 $0 APPLICATIONS DENIED 3 $572,333 0 $0 0 $0 APPLICATIONS WITHDRAWN 4 $260,250 1 $256,000 1 $256,000 FILES CLOSED FOR INCOMPLETENESS 0 $0 1 $768,520 0 $0
Aggregated Statistics For Year 2003(Based on 12 full and 3 partial tracts) A) Conventional B) Refinancings C) Non-occupant Loans on Number Average Value Number Average Value Number Average Value
LOANS ORIGINATED 53 $260,932 20 $262,858 7 $234,060 APPLICATIONS APPROVED, NOT ACCEPTED 8 $268,815 13 $246,027 1 $424,000 APPLICATIONS DENIED 2 $217,805 0 $0 0 $0 APPLICATIONS WITHDRAWN 2 $167,230 1 $394,000 1 $105,000 FILES CLOSED FOR INCOMPLETENESS 0 $0 1 $1,070,000 0 $0
Aggregated Statistics For Year 2002(Based on 12 full and 3 partial tracts) A) Conventional B) Refinancings C) Non-occupant Loans on Number Average Value Number Average Value Number Average Value
LOANS ORIGINATED 70 $240,008 11 $296,540 6 $231,603 APPLICATIONS APPROVED, NOT ACCEPTED 18 $364,429 9 $229,416 6 $258,988 APPLICATIONS DENIED 0 $0 1 $355,000 0 $0 APPLICATIONS WITHDRAWN 1 $194,000 3 $379,667 0 $0 FILES CLOSED FOR INCOMPLETENESS 0 $0 0 $0 0 $0
Aggregated Statistics For Year 2001(Based on 12 full and 3 partial tracts) A) Conventional B) Refinancings C) Non-occupant Loans on Number Average Value Number Average Value Number Average Value
LOANS ORIGINATED 71 $205,627 21 $257,717 10 $161,934 APPLICATIONS APPROVED, NOT ACCEPTED 12 $305,080 10 $283,552 1 $117,790 APPLICATIONS DENIED 0 $0 0 $0 0 $0 APPLICATIONS WITHDRAWN 0 $0 1 $244,240 1 $244,240 FILES CLOSED FOR INCOMPLETENESS 0 $0 0 $0 0 $0
Aggregated Statistics For Year 2000(Based on 13 full and 3 partial tracts) A) Conventional B) Refinancings C) Non-occupant Loans on Number Average Value Number Average Value Number Average Value
LOANS ORIGINATED 118 $198,799 13 $273,595 13 $250,651 APPLICATIONS APPROVED, NOT ACCEPTED 15 $256,459 4 $209,020 0 $0 APPLICATIONS DENIED 3 $293,667 1 $782,000 1 $203,000 APPLICATIONS WITHDRAWN 1 $82,090 0 $0 0 $0 FILES CLOSED FOR INCOMPLETENESS 0 $0 0 $0 0 $0
Aggregated Statistics For Year 1999(Based on 13 full and 3 partial tracts) A) Conventional B) Refinancings C) Non-occupant Loans on Number Average Value Number Average Value Number Average Value
LOANS ORIGINATED 164 $202,836 57 $225,616 8 $156,334 APPLICATIONS APPROVED, NOT ACCEPTED 18 $252,272 17 $221,033 0 $0 APPLICATIONS DENIED 9 $232,483 1 $100,730 1 $371,000 APPLICATIONS WITHDRAWN 11 $250,932 4 $124,332 0 $0 FILES CLOSED FOR INCOMPLETENESS 3 $226,280 3 $243,407 1 $240,000
Fire-safe hotels and motels in Bethesda, Maryland:
Bethesda Marriott Hotel, 5151 Pooks Hl Rd, Bethesda, Maryland 20814 Phone: (301) 897-9400, Fax: (301) 897-0192
Residence Inn By Marriott, 7335 Wisconsin Ave, Bethesda, Maryland 20814 Phone: (301) 718-0200, Fax: (301) 718-0679
Doubletree Hotel & Executive Meeting Center-Bethes, 8120 Wisconsin Ave, Bethesda, Maryland 20814 Phone: (301) 652-2000, Fax: (301) 664-7317
American Inn Of Bethesda, 8130 Wisconsin Ave, Bethesda, Maryland 20814 Phone: (301) 656-9300, Fax: (301) 656-2907
Hilton Garden Inn Washington, DC/Bethesda, 7301 Waverly St, Bethesda, Maryland 20814 Phone: (301) 654-8111, Fax: (301) 654-6584
National Naval Medical Center / Walter Reed Navy Lodge, Bldg ,52 8901 Wisconsin Ave, BETHESDA, Maryland 20889 Phone: (301) 654-1795, Fax: (301) 654-9373
All 6 fire-safe hotels and motels in Bethesda, Maryland
Most common first names in Bethesda, MD among deceased individuals Name Count Lived (average)
Mary 358 82.4 years John 304 78.0 years William 250 77.0 years Robert 246 76.8 years James 186 76.9 years Margaret 181 81.9 years Helen 181 83.6 years Dorothy 161 83.1 years Elizabeth 144 81.2 years Joseph 139 78.3 years
Most common last names in Bethesda, MD among deceased individuals Last name Count Lived (average)
Smith 81 79.3 years Johnson 57 81.3 years Brown 51 81.7 years Miller 49 81.8 years Jones 41 81.5 years Williams 38 77.5 years Cohen 35 81.6 years Davis 31 78.9 years Wilson 30 80.3 years Anderson 29 77.3 years
Bethesda compared to Maryland state average:
Median household income above state average. Median house value significantly above state average. Unemployed percentage significantly below state average. Black race population percentage significantly below state average. Median age significantly above state average. Foreign-born population percentage above state average. Percentage of population with a bachelor's degree or higher significantly above state average.
#1 on the list of "Top 101 cities with largest percentage of males in occupations: legal occupations (population 50,000+)"
#1 on the list of "Top 101 cities with the most people having professional degrees (population 50,000+)"
#1 on the list of "Top 101 cities with largest percentage of females in industries: professional, scientific, and technical services (population 50,000+)"
#1 on the list of "Top 100 cities with highest median household income (pop. 50,000+)"
#2 on the list of "Top 101 cities with largest percentage of females in occupations: arts, design, entertainment, sports, and media occupations (population 50,000+)"
#2 on the list of "Top 101 cities with largest percentage of females in occupations: life, physical, and social science occupations (population 50,000+)"
#4 on the list of "Top 101 cities with the highest percentage of workers working at home, population 50,000+"
#4 on the list of "Top 100 best educated cities (highest percentage of bachelor degree holding residents) (pop. 50,000+)"
#4 on the list of "Top 101 cities with largest percentage of females in industries: public administration (population 50,000+)"
#5 on the list of "Top 101 cities with largest percentage of females in occupations: legal occupations (population 50,000+)"
#5 on the list of "Top 101 cities with largest percentage population decreases in the 1990s) (population 50,000+)"
#6 on the list of "Top 101 cities with the most people having Master's or Doctorate degrees (population 50,000+)"
#7 on the list of "Top 101 cities with the least people below the poverty level (population 50,000+)"
#7 on the list of "Top 101 cities with the largest percentage of elementary and middle school students in private schools (5,000+ students)"
#8 on the list of "Top 101 cities with largest percentage of males in industries: public administration (population 50,000+)"
#9 on the list of "Top 101 cities with largest percentage of males in industries: professional, scientific, and technical services (population 50,000+)"
#9 on the list of "Top 101 cities with largest percentage of males in occupations: management occupations (population 50,000+)"
#9 on the list of "Top 101 cities with largest percentage of females in occupations: management occupations (population 50,000+)"
#11 on the list of "Top 101 cities with largest percentage of females in industries: construction (population 50,000+)"
#11 on the list of "Top 101 cities with the most people having Doctorate degrees (population 50,000+)"
#5 (20816) on the list of "Top 101 zip codes with the largest percentage of taxpayers using charity contributions deductions in 2012 (pop 5,000+)"
#17 (20816) on the list of "Top 101 zip codes with the largest percentage of taxpayers reporting taxable interest in 2012 (pop 5,000+)"
#46 (20816) on the list of "Top 101 zip codes with the largest percentage of taxpayers reporting net capital gain/loss in 2012 (pop 5,000+)"
#58 (20814) on the list of "Top 101 zip codes with the most full service restaurants in 2005"
#66 (20814) on the list of "Top 101 zip codes with the most big companies in 2005 (at least 1000 employees)"
#75 (20814) on the list of "Top 101 zip codes with the most finance and insurance companies in 2005"
#101 (20814) on the list of "Top 101 zip codes with the most medium-big companies in 2005 (at least 100 employees)"
#4 on the list of "Top 101 counties with the largest number of people without health insurance coverage in 2000 (pop. 50,000+)"
#6 on the list of "Top 101 counties with the best general health status score of residents (1-5), 3 years of data"
#10 on the list of "Top 101 counties with the highest surface withdrawal of fresh water for public supply"
#13 on the list of "Top 101 counties with the highest total withdrawal of fresh water for public supply"
#14 on the list of "Top 101 counties with the highest percentage of residents that visited a dentist within the past year"
Top Patent Applicants
Daniel L. Alkon (38)
Gerald W. Fischer (32)
Ling Huang (31)
Christopher Breder (30)
Brian R. Murphy (29)
Irving N. Weinberg (26)
Daniel S. Simpkins (25)
Lance A. Liotta (24)
Rachel Schneerson (24)
Lance Liotta (20)
Total of 2805 patent applications in 2008-2024.


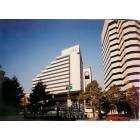
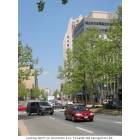

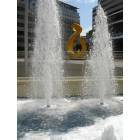
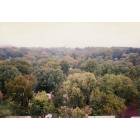

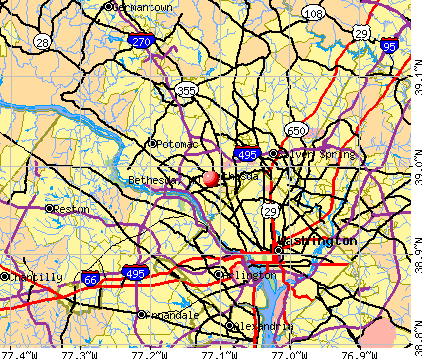


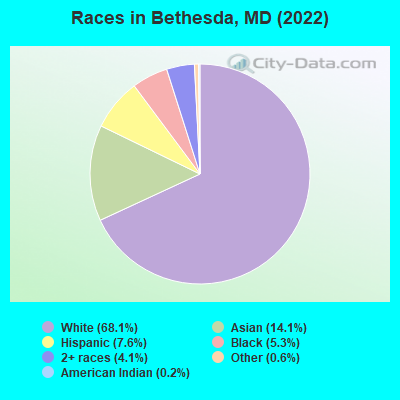
 Recent articles from our blog. Our writers, many of them Ph.D. graduates or candidates, create easy-to-read articles on a wide variety of topics.

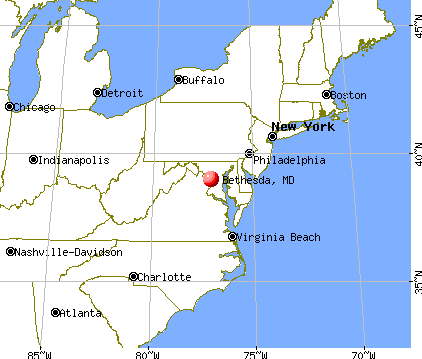
 (7.3 miles
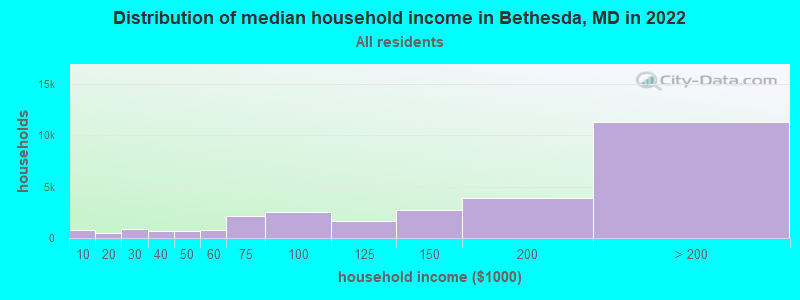
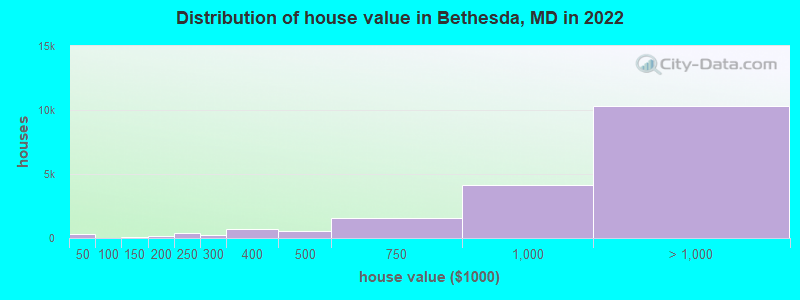
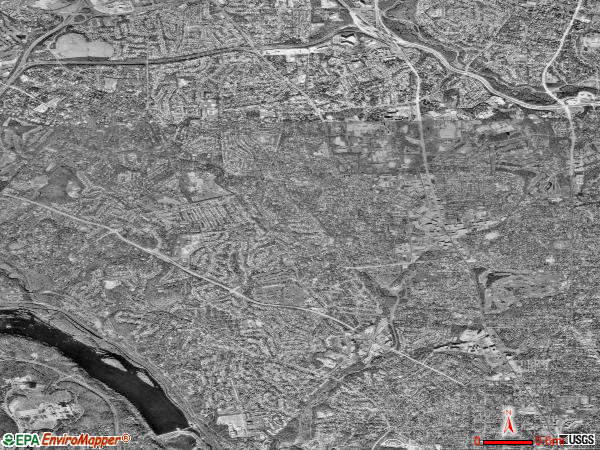
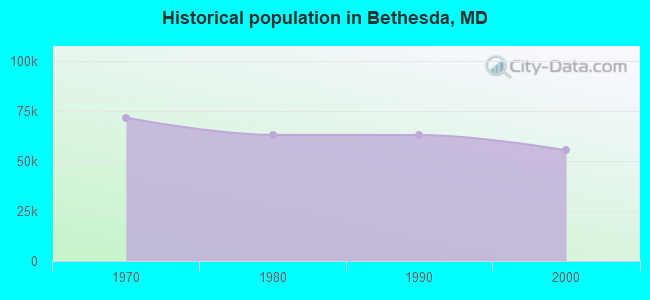
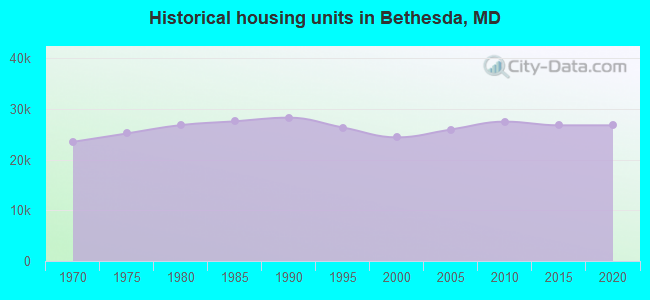
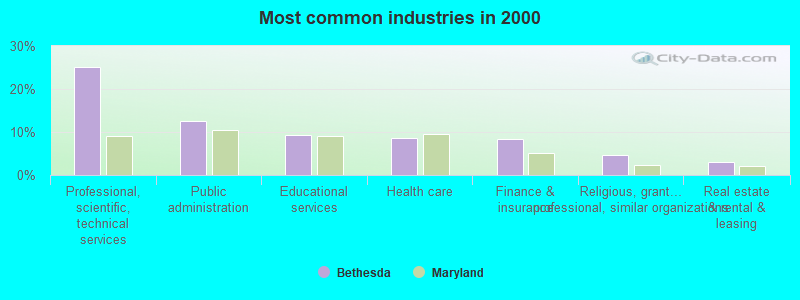
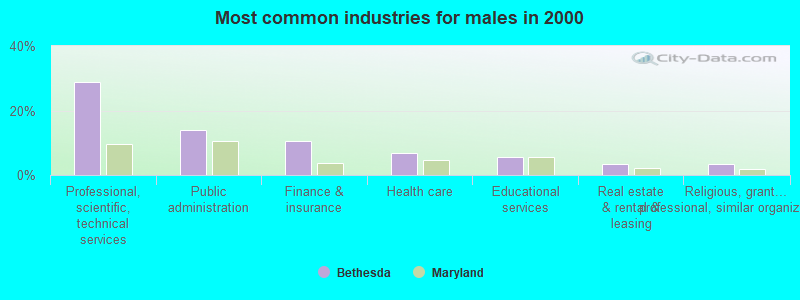
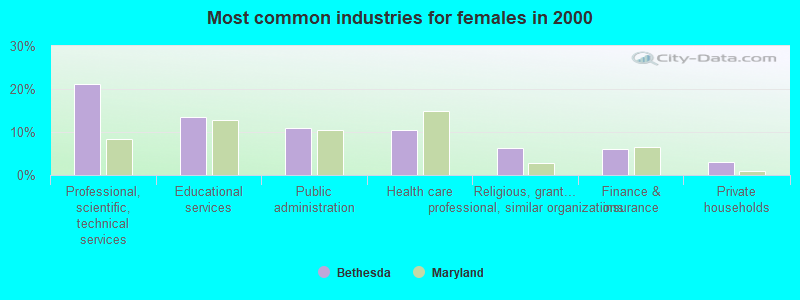
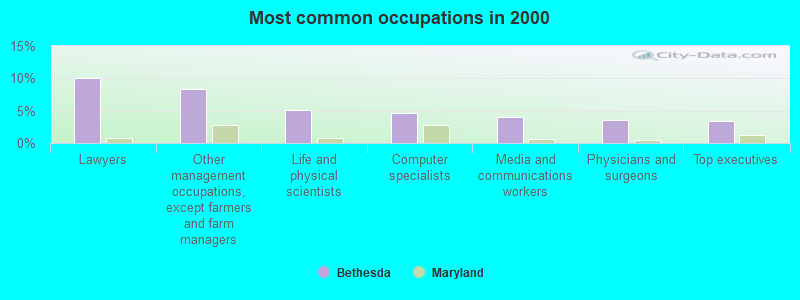
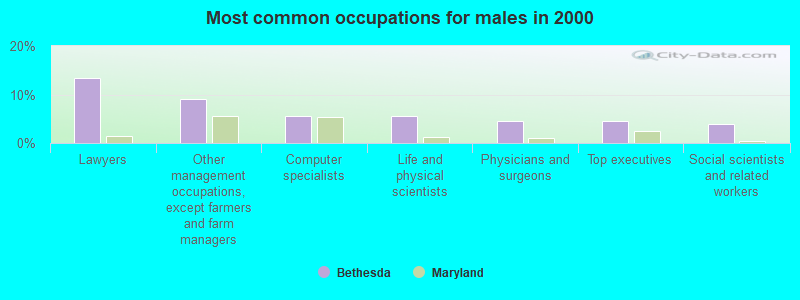
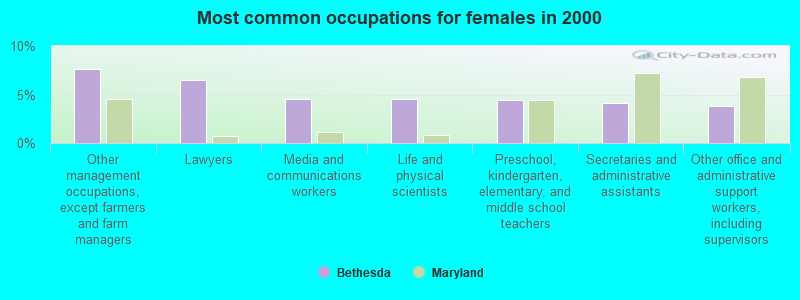
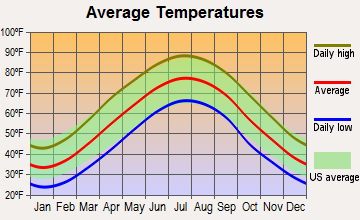
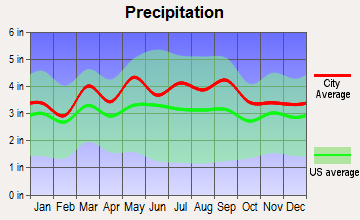
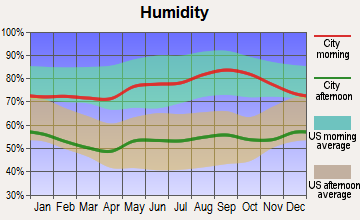
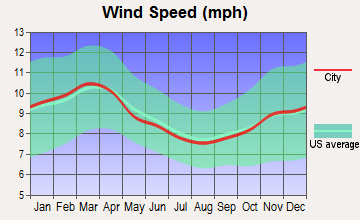
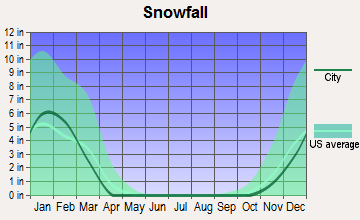
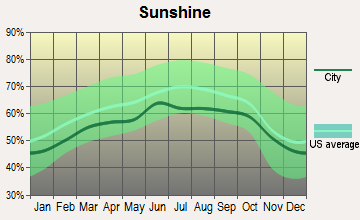
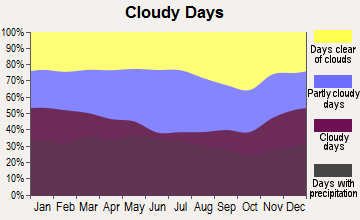
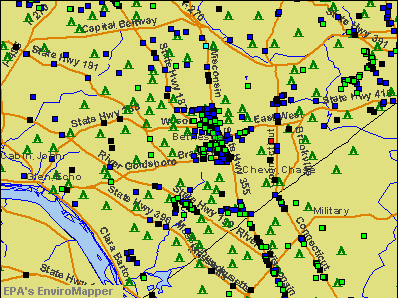

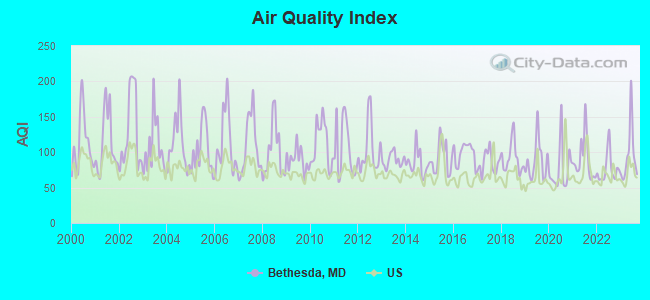
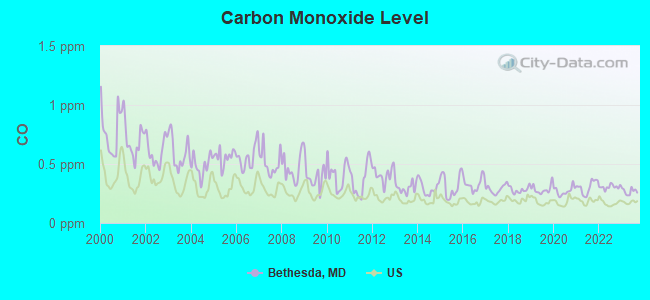
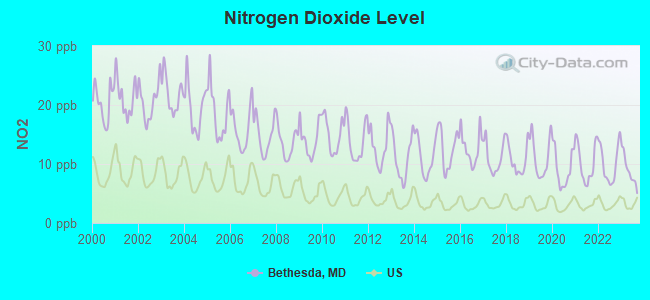
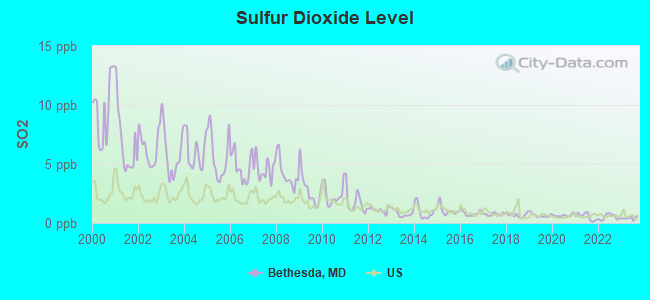
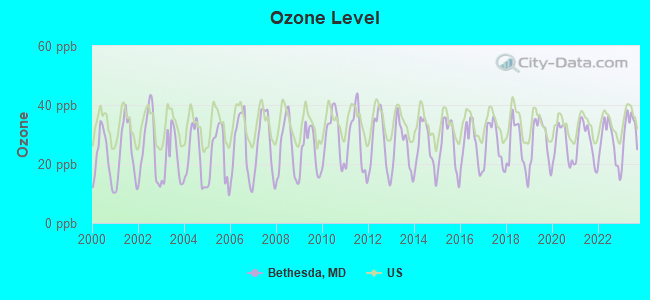
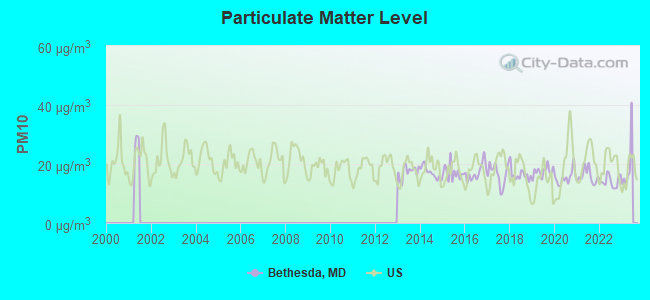
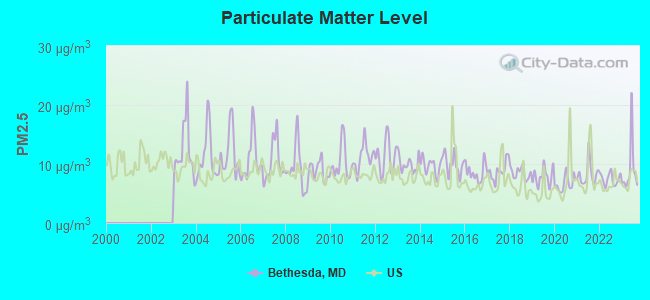
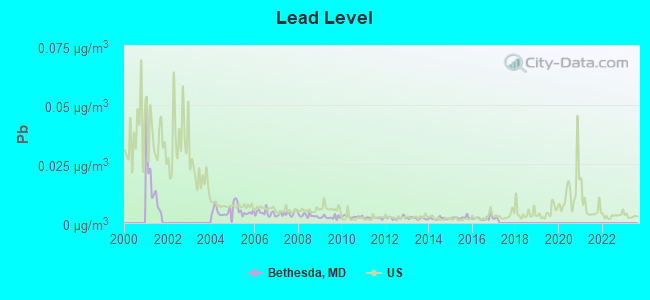
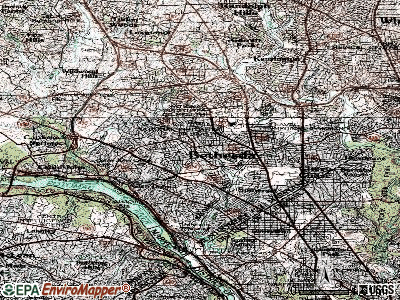
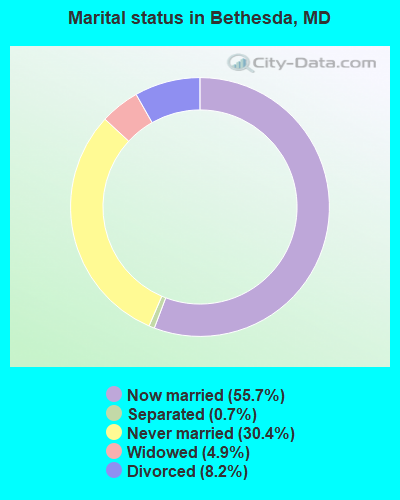
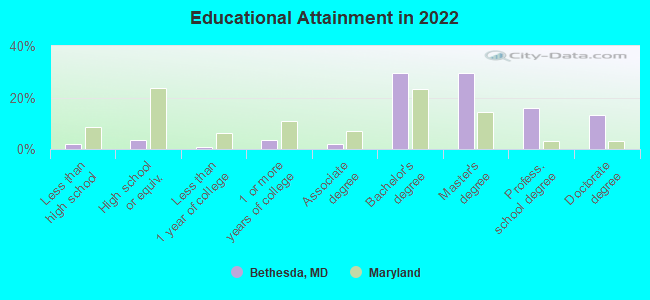
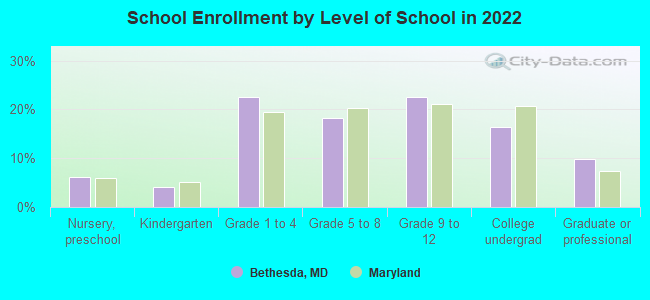
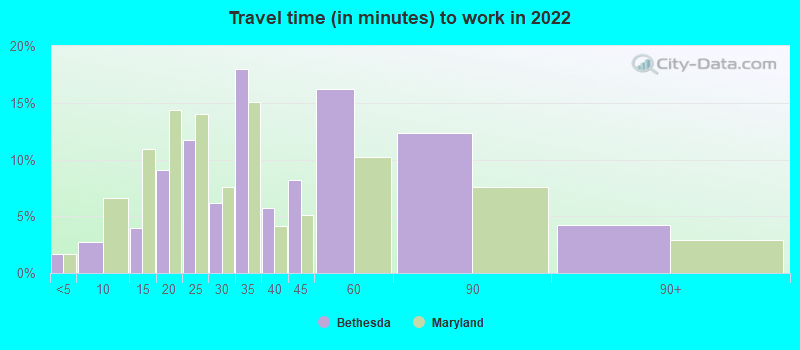
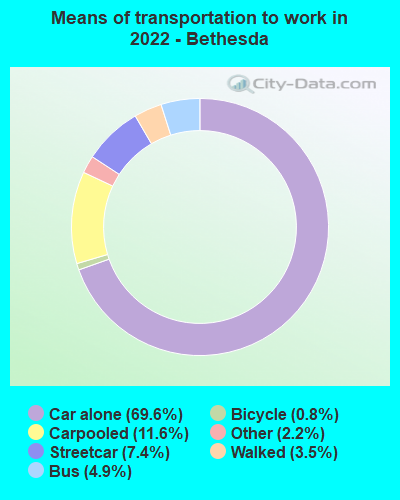
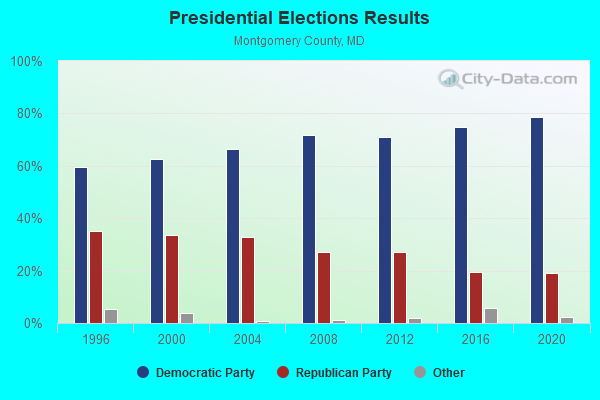
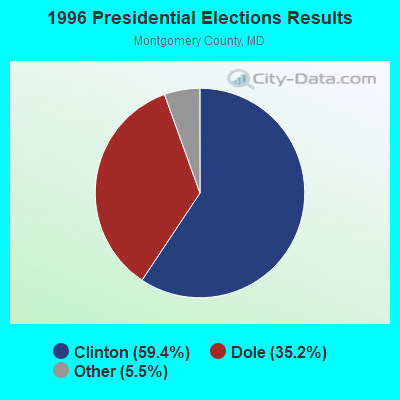
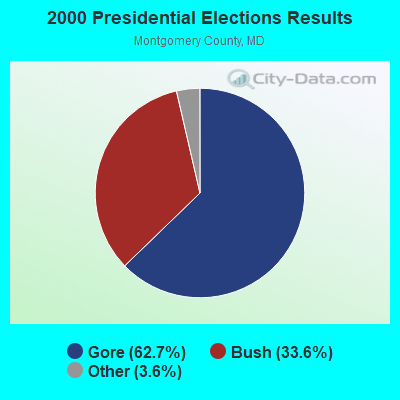
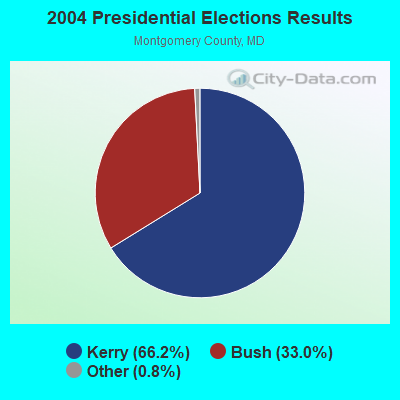
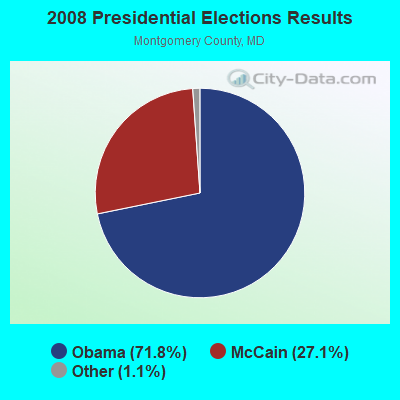
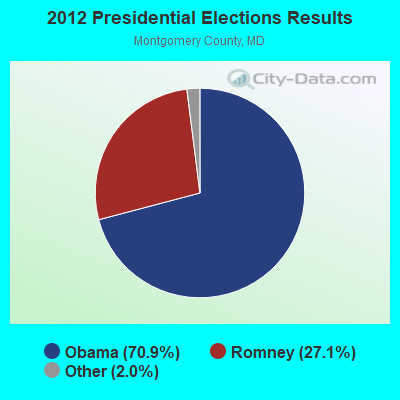
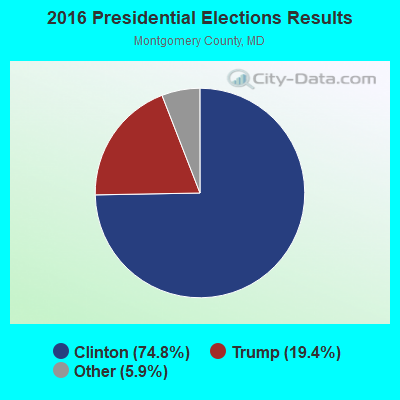
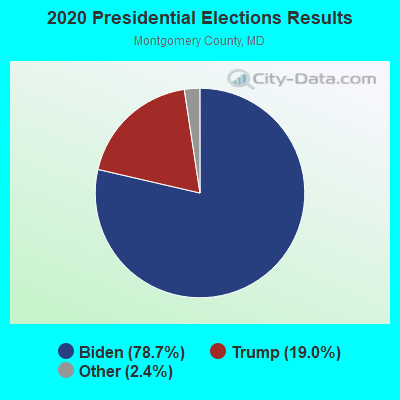
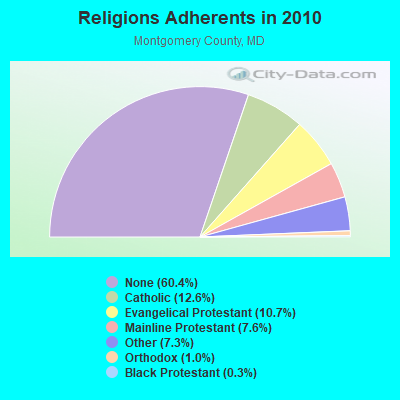
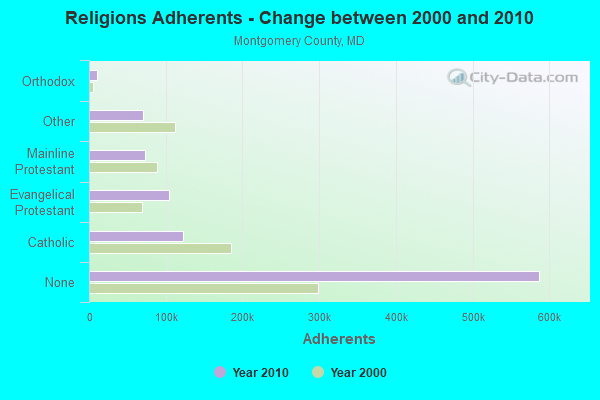
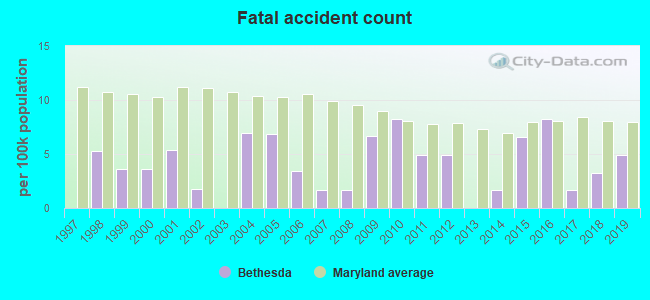
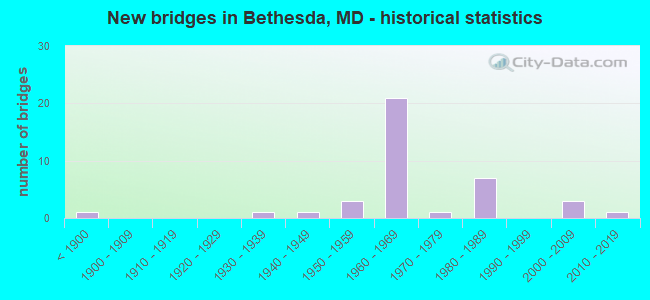
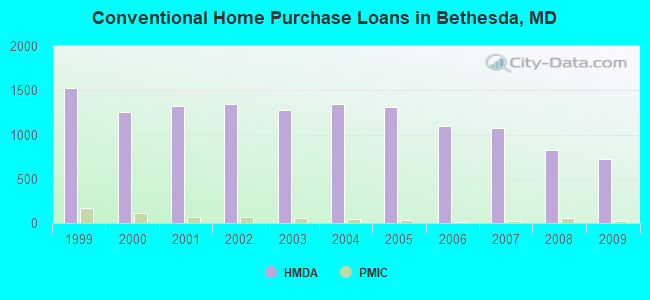
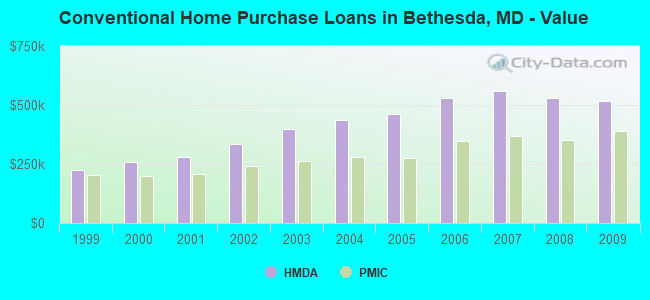
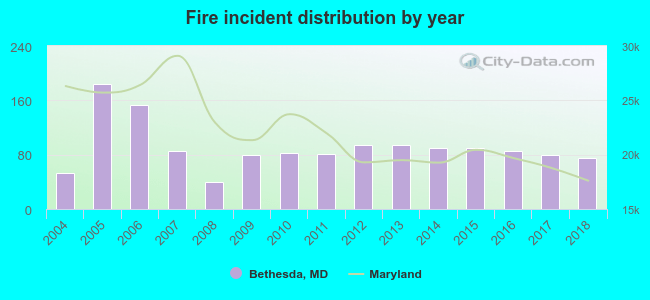 According to the data from the years 2004 - 2018 the average number of fires per year is 91. The highest number of fire incidents - 184 took place in 2005, and the least - 40 in 2008. The data has a rising trend.
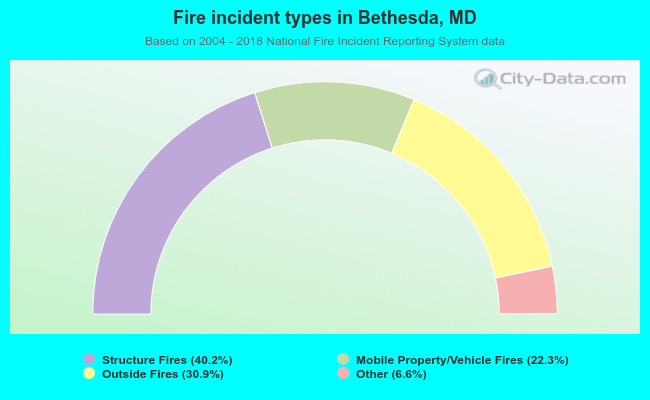 When looking into fire subcategories, the most reports belonged to: Structure Fires (40.2%), and Outside Fires (30.9%).