Castlewood, Colorado
Submit your own pictures of this place and show them to the world
- OSM Map
- General Map
- Google Map
- MSN Map
| Males: 13,868 | |
| Females: 14,387 |
| Median resident age: | 38.9 years |
| Colorado median age: | 34.3 years |
Zip codes: 80112.
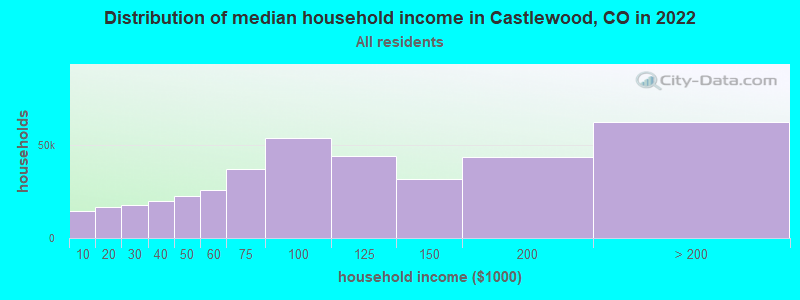
| Castlewood: | $141,775 |
| CO: | $89,302 |
Estimated per capita income in 2022: $68,911 (it was $37,891 in 2000)
Castlewood CDP income, earnings, and wages data
Estimated median house or condo value in 2022: $765,902 (it was $231,500 in 2000)
| Castlewood: | $765,902 |
| CO: | $531,100 |
Mean prices in 2022: all housing units: $658,444; detached houses: $739,677; townhouses or other attached units: $417,846; in 2-unit structures: $329,041; in 3-to-4-unit structures: $303,654; in 5-or-more-unit structures: $305,834; mobile homes: $131,913; occupied boats, rvs, vans, etc.: $14,324
Detailed information about poverty and poor residents in Castlewood, CO
Compare current foreclosures near Castlewood, CO:
| Photo | Address | Area | Beds / Baths | Price | Details |
|---|---|---|---|---|---|

|
#1
E Mississippi Ave Apt C2
Denver, CO 80247
|
1,142 sq. feet
|
2 baths 2 beds |
show details | |

|
#2
S Fillmore Cir
Littleton, CO 80122
|
1,036 sq. feet
|
3 baths 3 beds |
show details | |

|
#3
E Alameda Ave Apt 22-106
Denver, CO 80247
|
1,019 sq. feet
|
2 baths 2 beds |
show details | |

|
#4
S Miller Way
Denver, CO 80226
|
1,269 sq. feet
|
2 baths 4 beds |
show details | |

|
#5
Norfolk Pl
Castle Rock, CO 80108
|
2,478 sq. feet
|
3 baths 3 beds |
show details | |

|
#6
Sable St
Denver, CO 80239
|
1,230 sq. feet
|
2 baths 3 beds |
show details | |

|
#7
S Vivian St
Denver, CO 80228
|
1,261 sq. feet
|
2 baths 3 beds |
show details | |

|
#8
Shadowbrook Cir
Littleton, CO 80130
|
3,920 sq. feet
|
5 baths 5 beds |
show details | |

|
#9
S Flanders Way
Aurora, CO 80017
|
1,682 sq. feet
|
2 baths 2 beds |
show details | |

|
#10
Iola St
Aurora, CO 80010
|
2,128 sq. feet
|
2 baths 5 beds |
show details |
| Photo | Address | Area | Beds / Baths | Price | Details |
|---|---|---|---|---|---|

|
#11
S Memphis Way Apt 11
Aurora, CO 80017
|
913 sq. feet
|
1 baths 2 beds |
show details | |

|
#12
S Windermere St
Littleton, CO 80120
|
1,992 sq. feet
|
4 baths 1 beds |
show details | |

|
#13
S Elkhart Ct
Aurora, CO 80015
|
2,678 sq. feet
|
5 baths 4 beds |
show details | |

|
#14
E Quinn Cir
Aurora, CO 80015
|
1,258 sq. feet
|
3 baths 2 beds |
show details | |

|
#15
S Saint Paul St
Denver, CO 80210
|
1,334 sq. feet
|
5 baths 5 beds |
show details | |

|
#16
S Van Gordon St
Denver, CO 80228
|
1,630 sq. feet
|
2 baths 3 beds |
show details | |

|
#17
E Evans Ave
Aurora, CO 80014
|
3,152 sq. feet
|
4 baths 4 beds |
show details | |

|
#18
E Batavia Dr
Aurora, CO 80011
|
842 sq. feet
|
1 baths 4 beds |
show details | |

|
#19
E Maplewood Pl
Aurora, CO 80016
|
4,801 sq. feet
|
4 baths 4 beds |
show details | |

|
#20
N York St
Denver, CO 80205
|
1,562 sq. feet
|
2 baths 4 beds |
show details |
| Photo | Address | Area | Beds / Baths | Price | Details |
|---|---|---|---|---|---|

|
#21
E Louisiana Cir
Aurora, CO 80018
|
1,582 sq. feet
|
3 baths 3 beds |
show details | |

|
#22
Biscay St
Aurora, CO 80011
|
2,702 sq. feet
|
3 baths 3 beds |
show details | |

|
#23
S Elmira St Apt 10
Denver, CO 80231
|
3,043 sq. feet
|
3 baths 3 beds |
show details | |

|
#24
Irish Pat Murphy Dr
Parker, CO 80134
|
2,384 sq. feet
|
3 baths 4 beds |
show details | |

|
#25
W Lakeside Dr
Littleton, CO 80125
|
1,772 sq. feet
|
2 baths 2 beds |
show details | |

|
#26
E Mississippi Ave Apt 1502
Denver, CO 80247
|
1,428 sq. feet
|
2 baths 2 beds |
show details | |

|
#27
Spanish Oaks Way
Castle Rock, CO 80108
|
- sq. feet
|
3 baths 4 beds |
show details | |

|
#28
S Jasper St
Aurora, CO 80013
|
1,032 sq. feet
|
2 baths 5 beds |
show details | |

|
#29
E Brown Dr
Aurora, CO 80013
|
1,008 sq. feet
|
2 baths 2 beds |
show details | |

|
#30
S Valentine Way
Denver, CO 80228
|
1,169 sq. feet
|
2 baths 4 beds |
show details |
| Photo | Address | Area | Beds / Baths | Price | Details |
|---|---|---|---|---|---|

|
#31
Emporia St
Aurora, CO 80010
|
1,040 sq. feet
|
1 baths 3 beds |
show details | |

|
#32
N Patsburg St
Aurora, CO 80018
|
- sq. feet
|
3 baths 3 beds |
show details | |

|
#33
E 44th Ave
Denver, CO 80249
|
1,636 sq. feet
|
2 baths 3 beds |
show details | |

|
#34
E Brown Cir
Aurora, CO 80013
|
1,762 sq. feet
|
3 baths 4 beds |
show details | |

|
#35
E Ohio Pl
Aurora, CO 80012
|
1,390 sq. feet
|
2 baths 3 beds |
show details | |

|
#36
E Nassau Pl
Aurora, CO 80018
|
2,741 sq. feet
|
2 baths 4 beds |
show details | |

|
#37
Belmont Way
Parker, CO 80134
|
2,484 sq. feet
|
2 baths 3 beds |
show details | |

|
#38
E Warren Dr Unit 101
Aurora, CO 80013
|
1,013 sq. feet
|
2 baths 2 beds |
show details | |

|
#39
Ladera Dr
Littleton, CO 80124
|
- sq. feet
|
4 baths 4 beds |
show details | |

|
#40
S Joplin Way
Aurora, CO 80013
|
1,132 sq. feet
|
2 baths 3 beds |
show details |
| Photo | Address | Area | Beds / Baths | Price | Details |
|---|---|---|---|---|---|

|
#41
Lincoln St
Denver, CO 80216
|
812 sq. feet
|
1 baths 2 beds |
show details | |

|
#42
Charissglen Ln
Littleton, CO 80126
|
4,450 sq. feet
|
3 baths 4 beds |
show details | |

|
#43
S Danube Way Unit 103
Aurora, CO 80017
|
990 sq. feet
|
2 baths 2 beds |
show details | |

|
#44
Eagle St
Denver, CO 80239
|
936 sq. feet
|
2 baths 3 beds |
show details | |

|
#45
E Nassau Pl
Aurora, CO 80018
|
1,977 sq. feet
|
2 baths 4 beds |
show details | |

|
#46
Glengate Cir
Littleton, CO 80130
|
3,150 sq. feet
|
3 baths 4 beds |
show details | |

|
#47
E Girard Ave Apt 102
Denver, CO 80231
|
1,050 sq. feet
|
2 baths 2 beds |
show details | |

|
#48
Krameria St
Denver, CO 80220
|
947 sq. feet
|
2 baths 2 beds |
show details | |

|
#49
E Villanova Pl
Aurora, CO 80013
|
1,007 sq. feet
|
2 baths 3 beds |
show details | |

|
Check over 1 million property listings on Foreclosure.com!
|
browse all offers | |||

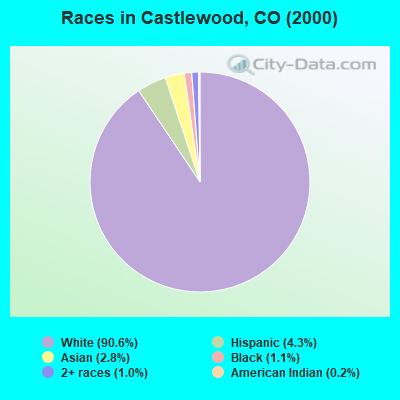
- 23,16790.6%White alone
- 1,0984.3%Hispanic
- 7092.8%Asian alone
- 2691.1%Black alone
- 2531.0%Two or more races
- 460.2%American Indian alone
- 200.08%Other race alone
- 50.02%Native Hawaiian and Other
Pacific Islander alone
 Recent articles from our blog. Our writers, many of them Ph.D. graduates or candidates, create easy-to-read articles on a wide variety of topics.

 | Need Help w/Area to Move To (Neighborhoods, Schools, Etc) (25 replies) |
| Need visit tips: breakfast, mountain hiking, honey, tea, etc (8 replies) |
| Castlewood Area of Centennial - Any info? (29 replies) |
| good school near front range (14 replies) |
| scenic spots in Denver suburbs (8 replies) |
| fun things to do with kids in February (18 replies) |
Latest news from Castlewood, CO collected exclusively by city-data.com from local newspapers, TV, and radio stations
Ancestries: German (26.1%), English (18.1%), Irish (16.2%), Italian (4.8%), Polish (4.1%), Scottish (4.0%).
Current Local Time: MST time zone
Elevation: 5730 feet
Land area: 6.15 square miles.
Population density: 4,595 people per square mile (average).
1,794 residents are foreign born (2.3% Asia, 1.4% Europe, 1.2% Latin America, 1.1% North America).
| This place: | 7.0% |
| Colorado: | 8.6% |
| Castlewood CDP: | 0.9% ($1,979) |
| Colorado: | 0.7% ($1,132) |
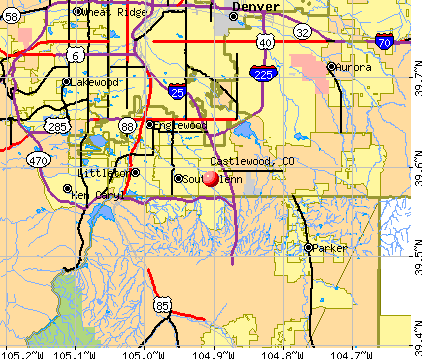
Nearest city with pop. 50,000+: Centennial, CO (1.6 miles  , pop. 100,377).
Nearest city with pop. 200,000+: South Aurora, CO (7.8 miles , pop. 297,828).
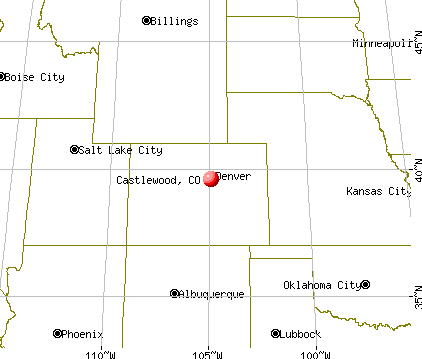
Nearest city with pop. 1,000,000+: Phoenix, AZ (577.8 miles , pop. 1,321,045).
Nearest cities:
), ), ), ), Latitude: 39.59 N, Longitude: 104.90 W
Daytime population change due to commuting: +6,357 (+24.9%)
Workers who live and work in this place: 2,398 (17.0%)
Property values in Castlewood, CO
| Here: | 3.2% |
| Colorado: | 3.2% |
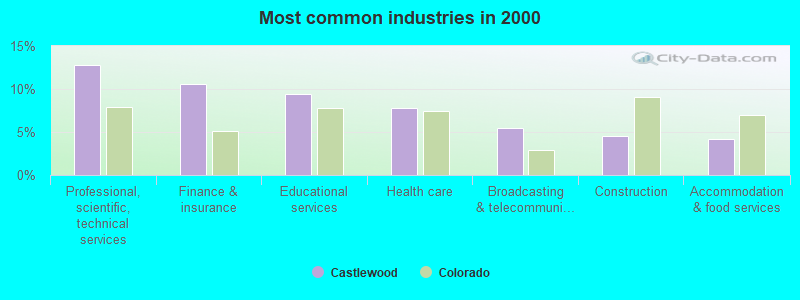
- Professional, scientific, technical services (12.8%)
- Finance & insurance (10.6%)
- Educational services (9.4%)
- Health care (7.8%)
- Broadcasting & telecommunications (5.5%)
- Construction (4.5%)
- Accommodation & food services (4.2%)
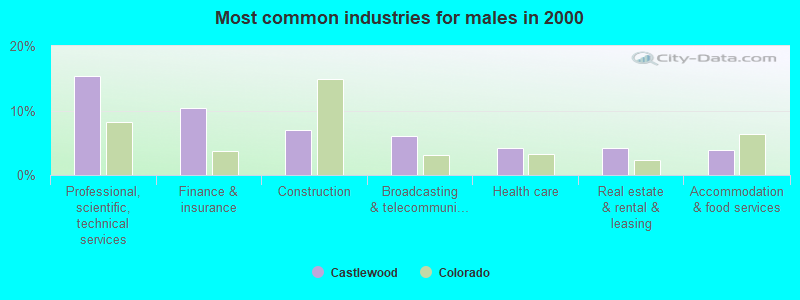
- Professional, scientific, technical services (15.3%)
- Finance & insurance (10.4%)
- Construction (7.0%)
- Broadcasting & telecommunications (6.0%)
- Health care (4.2%)
- Real estate & rental & leasing (4.2%)
- Accommodation & food services (3.9%)
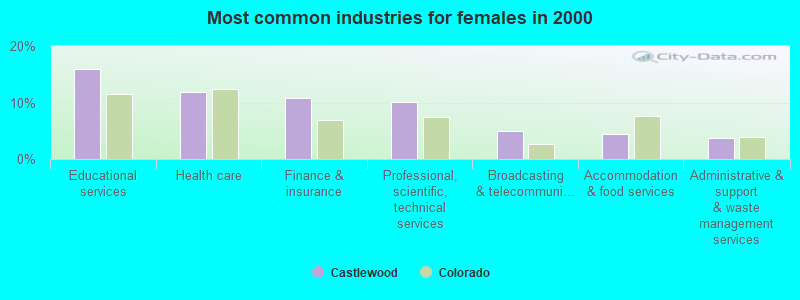
- Educational services (16.0%)
- Health care (11.9%)
- Finance & insurance (10.9%)
- Professional, scientific, technical services (10.1%)
- Broadcasting & telecommunications (5.0%)
- Accommodation & food services (4.5%)
- Administrative & support & waste management services (3.7%)
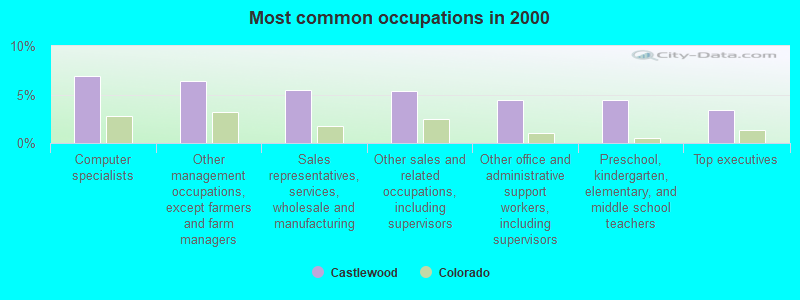
- Computer specialists (6.9%)
- Other management occupations, except farmers and farm managers (6.4%)
- Sales representatives, services, wholesale and manufacturing (5.5%)
- Other sales and related occupations, including supervisors (5.3%)
- Other office and administrative support workers, including supervisors (4.5%)
- Preschool, kindergarten, elementary, and middle school teachers (4.5%)
- Top executives (3.4%)
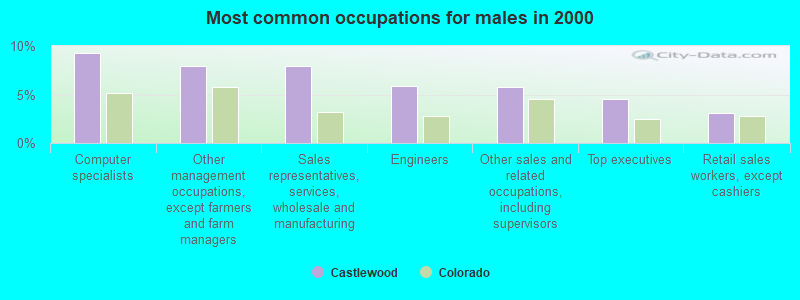
- Computer specialists (9.3%)
- Other management occupations, except farmers and farm managers (7.9%)
- Sales representatives, services, wholesale and manufacturing (7.9%)
- Engineers (5.9%)
- Other sales and related occupations, including supervisors (5.8%)
- Top executives (4.5%)
- Retail sales workers, except cashiers (3.1%)
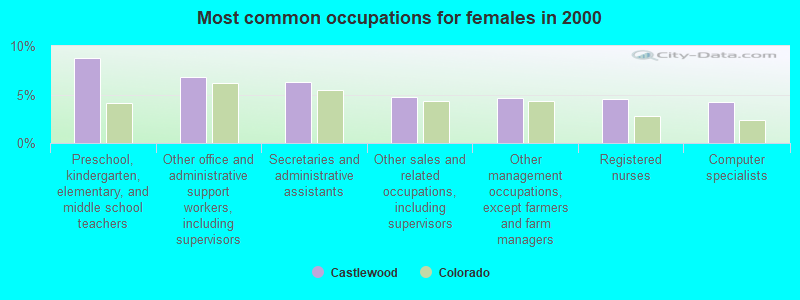
- Preschool, kindergarten, elementary, and middle school teachers (8.8%)
- Other office and administrative support workers, including supervisors (6.8%)
- Secretaries and administrative assistants (6.2%)
- Other sales and related occupations, including supervisors (4.8%)
- Other management occupations, except farmers and farm managers (4.6%)
- Registered nurses (4.5%)
- Computer specialists (4.2%)
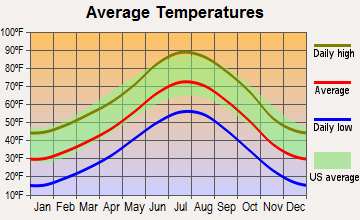
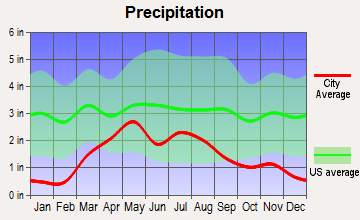
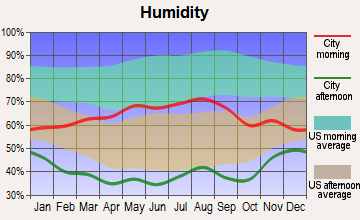
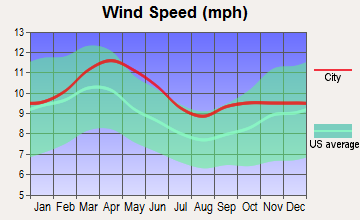
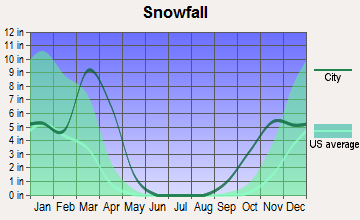
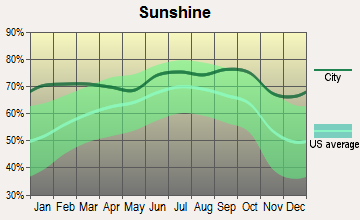
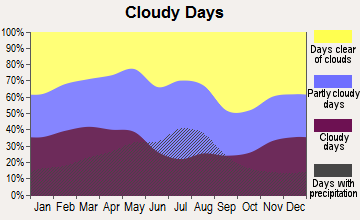
Average climate in Castlewood, Colorado
Based on data reported by over 4,000 weather stations
(lower is better)
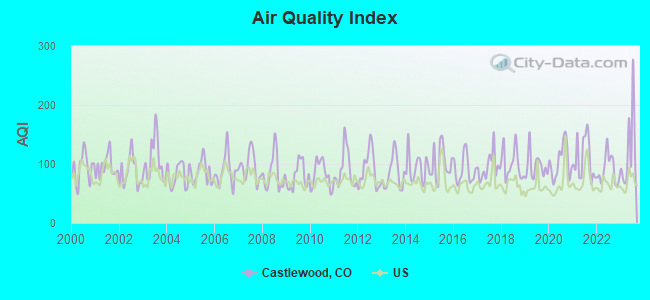
Air Quality Index (AQI) level in 2023 was 123. This is significantly worse than average.
| City: | 123 |
| U.S.: | 73 |
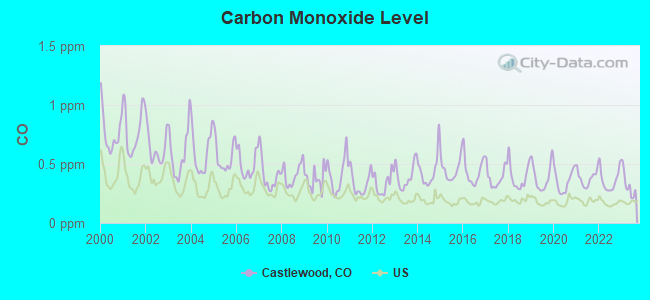
Carbon Monoxide (CO) [ppm] level in 2023 was 0.326. This is worse than average. Closest monitor was 1.4 miles away from the city center.
| City: | 0.326 |
| U.S.: | 0.251 |
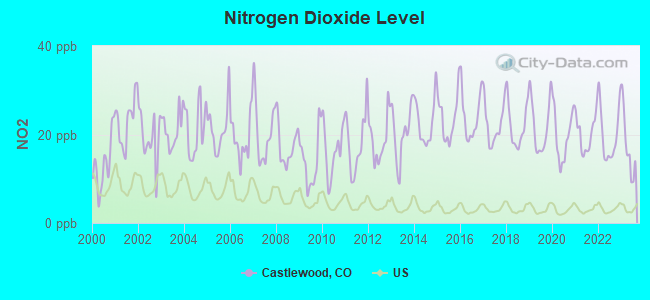
Nitrogen Dioxide (NO2) [ppb] level in 2023 was 17.5. This is significantly worse than average. Closest monitor was 9.7 miles away from the city center.
| City: | 17.5 |
| U.S.: | 5.1 |
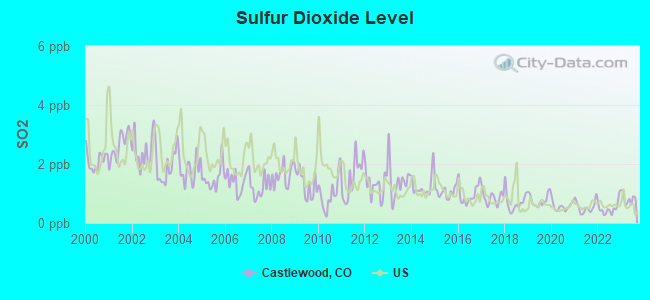
Sulfur Dioxide (SO2) [ppb] level in 2023 was 0.832. This is significantly better than average. Closest monitor was 3.1 miles away from the city center.
| City: | 0.832 |
| U.S.: | 1.515 |
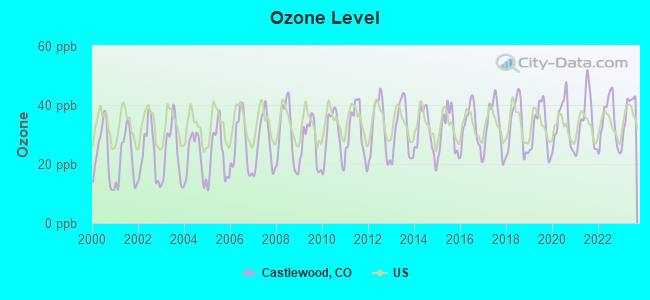
Ozone [ppb] level in 2023 was 37.7. This is about average. Closest monitor was 7.0 miles away from the city center.
| City: | 37.7 |
| U.S.: | 33.3 |
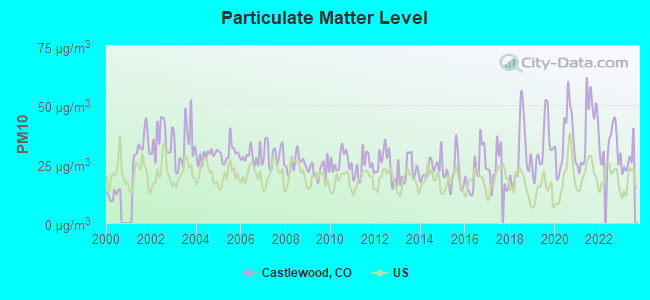
Particulate Matter (PM10) [µg/m3] level in 2023 was 26.4. This is worse than average. Closest monitor was 5.3 miles away from the city center.
| City: | 26.4 |
| U.S.: | 19.2 |
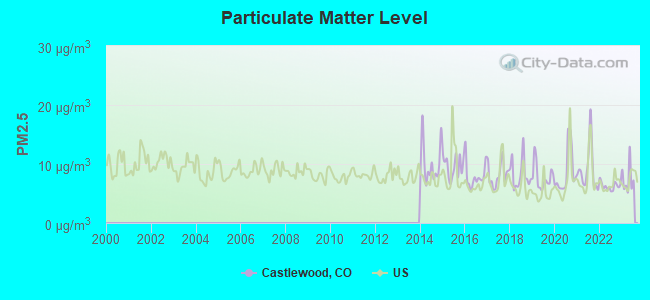
Particulate Matter (PM2.5) [µg/m3] level in 2023 was 7.46. This is about average. Closest monitor was 6.3 miles away from the city center.
| City: | 7.46 |
| U.S.: | 8.11 |
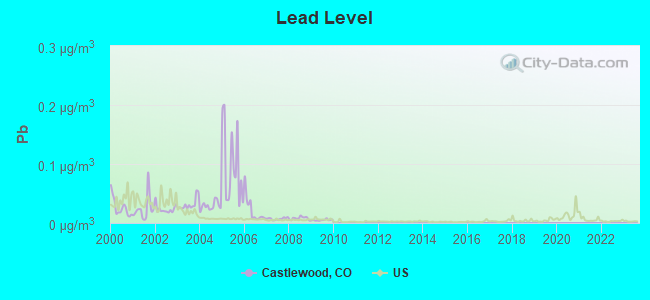
Lead (Pb) [µg/m3] level in 2009 was 0.00502. This is significantly better than average. Closest monitor was 3.1 miles away from the city center.
| City: | 0.00502 |
| U.S.: | 0.00931 |
Tornado activity:
Castlewood-area historical tornado activity is above Colorado state average. It is 28% greater than the overall U.S. average.
On 6/15/1988, a category F3 (max. wind speeds 158-206 mph) tornado 10.1 miles away from the Castlewood place center injured 7 people and caused between $5,000,000 and $50,000,000 in damages.
On 5/18/1975, a category F3 tornado 17.5 miles away from the place center .
Earthquake activity:
Castlewood-area historical earthquake activity is significantly above Colorado state average. It is 710% greater than the overall U.S. average.On 8/18/1959 at 06:37:13, a magnitude 7.7 (7.7 UK, Class: Major, Intensity: VIII - XII) earthquake occurred 453.4 miles away from the city center, causing $26,000,000 total damage
On 10/18/1984 at 15:30:23, a magnitude 5.5 (5.4 MB, 5.1 MS, 5.5 ML, Class: Moderate, Intensity: VI - VII) earthquake occurred 197.4 miles away from the city center
On 8/23/2011 at 05:46:18, a magnitude 5.3 (5.3 MW, Depth: 2.5 mi) earthquake occurred 174.9 miles away from the city center
On 10/28/1983 at 14:06:06, a magnitude 7.3 (6.2 MB, 7.3 MS, 7.0 MW) earthquake occurred 553.4 miles away from the city center, causing 2 deaths (2 shaking deaths) and 3 injuries, causing $15,000,000 total damage
On 8/10/2005 at 22:08:22, a magnitude 5.0 (5.0 MW, Depth: 3.1 mi) earthquake occurred 182.6 miles away from the city center
On 8/10/2005 at 22:08:22, a magnitude 5.0 (5.0 MB, 4.7 MS, 5.0 MW) earthquake occurred 184.5 miles away from Castlewood center
Magnitude types: body-wave magnitude (MB), local magnitude (ML), surface-wave magnitude (MS), moment magnitude (MW)
Natural disasters:
The number of natural disasters in Arapahoe County (10) is smaller than the US average (15).Major Disasters (Presidential) Declared: 5
Emergencies Declared: 4
Causes of natural disasters: Floods: 5, Storms: 4, Landslides: 2, Mudslides: 2, Snows: 2, Fire: 1, Heavy Rain: 1, Hurricane: 1, Snowstorm: 1, Tornado: 1, Other: 1 (Note: some incidents may be assigned to more than one category).
Hospitals and medical centers near Castlewood:
- AGAPE HOSPICE SERVICES (Hospital, about 2 miles away; GREENWOOD VILLAGE, CO)
- CHRISTIAN LIVING COMMUNITIES THE JOHNSON CENTER SK (Nursing Home, about 2 miles away; CENTENNIAL, CO)
- HERITAGE CLUB AT GREENWOOD VILLAGE-LTC (Nursing Home, about 2 miles away; GREENWOOD VILLAGE, CO)
- SUITES AT HOLLY CREEK CARE CENTER, THE (Nursing Home, about 2 miles away; CENTENNIAL, CO)
- ORCHARD PARK HEALTH CARE CENTER (Nursing Home, about 2 miles away; LITTLETON, CO)
- SOLAMOR HOSPICE OF DENVER (Hospital, about 3 miles away; GREENWOOD VILLAGE, CO)
- ASPIRE HOME CARE (Home Health Center, about 3 miles away; GREENWOOD VILLAGE, CO)
Amtrak station near Castlewood:
- 13 miles: DENVER (1701 WYNKOOP ST.) . Services: ticket office, fully wheelchair accessible, enclosed waiting area, public restrooms, public payphones, full-service food facilities and snack bar, paid short-term parking, paid long-term parking, call for car rental service, taxi stand, public transit connection.
Colleges/universities with over 2000 students nearest to Castlewood:
- Colorado State University-Global Campus (about 2 miles; Greenwood Village, CO; Full-time enrollment: 3,642)
- Jones International University (about 2 miles; Centennial, CO; FT enrollment: 2,556)
- Arapahoe Community College (about 7 miles; Littleton, CO; FT enrollment: 6,619)
- University of Denver (about 9 miles; Denver, CO; FT enrollment: 9,621)
- Community College of Aurora (about 11 miles; Aurora, CO; FT enrollment: 4,730)
- Emily Griffith Technical College (about 12 miles; Denver, CO; FT enrollment: 2,460)
- Community College of Denver (about 12 miles; Denver, CO; FT enrollment: 7,329)
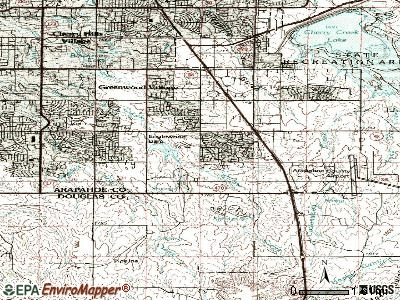
Points of interest:
Notable locations in Castlewood: Castlewood Grange (A), South Metro Fire Rescue Authority Station 32 (B), Children's Hospital Colorado Orthopedic Care (C), South Metro Fire Rescue Authority Station 33 (D). Display/hide their locations on the map
Shopping Centers: Foxridge Plaza Shopping Center (1), Willow Creek Shopping Center (2). Display/hide their locations on the map
Churches in Castlewood include: Saint Thomas More Center (A), Good Shepherd Episcopal Church (B). Display/hide their locations on the map
Reservoirs: Englewood Reservoir (A), Holly Reservoir (B). Display/hide their locations on the map
Parks in Castlewood include: Hunters Hill Park (1), Cherry Hill Park (2), Walnut Hills Park (3), Willow Creek Park (4), Foxhill Park (5), Holly Park (6), Sunset Park (7), Palos Verdes Park West (8), Palos Verdes Park (9). Display/hide their locations on the map
| This place: | 2.6 people |
| Colorado: | 2.5 people |
| This place: | 73.1% |
| Whole state: | 65.9% |
| This place: | 3.7% |
| Whole state: | 5.5% |
Likely homosexual households (counted as self-reported same-sex unmarried-partner households)
- Lesbian couples: 0.3% of all households
- Gay men: 0.1% of all households
| This place: | 2.1% |
| Whole state: | 9.3% |
| This place: | 1.5% |
| Whole state: | 4.1% |
People in group quarters in Castlewood in 2000:
- 26 people in other noninstitutional group quarters
- 12 people in homes for the mentally retarded
- 8 people in other group homes
- 5 people in nursing homes
- 2 people in homes for the physically handicapped
For population 15 years and over in Castlewood:
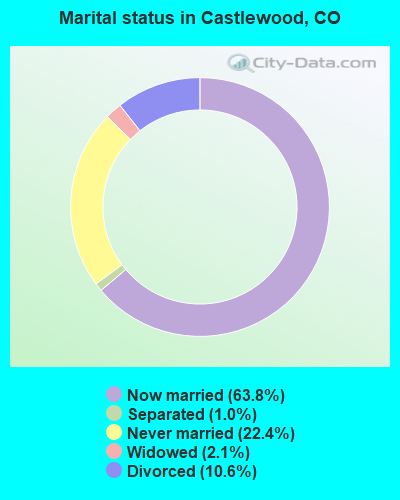
- Never married: 22.4%
- Now married: 63.8%
- Separated: 1.0%
- Widowed: 2.1%
- Divorced: 10.6%
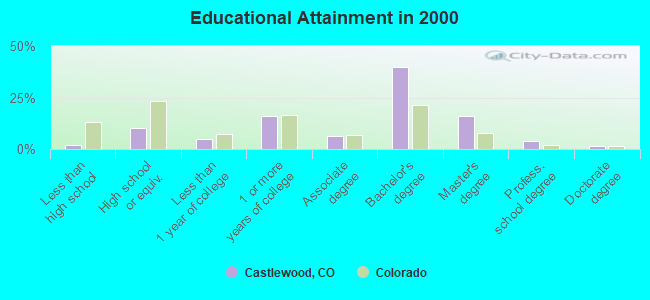
For population 25 years and over in Castlewood:
- High school or higher: 98.1%
- Bachelor's degree or higher: 61.3%
- Graduate or professional degree: 21.7%
- Unemployed: 2.8%
- Mean travel time to work (commute): 22.4 minutes
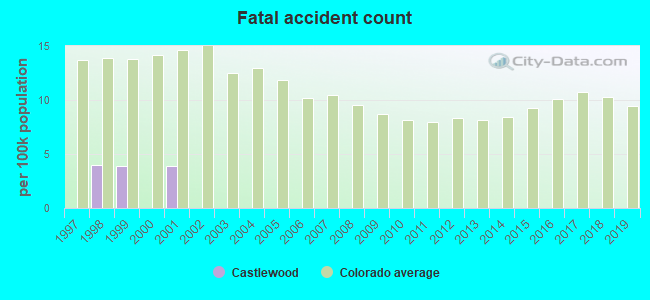
| Here: | 8.0 |
| Colorado average: | 11.8 |
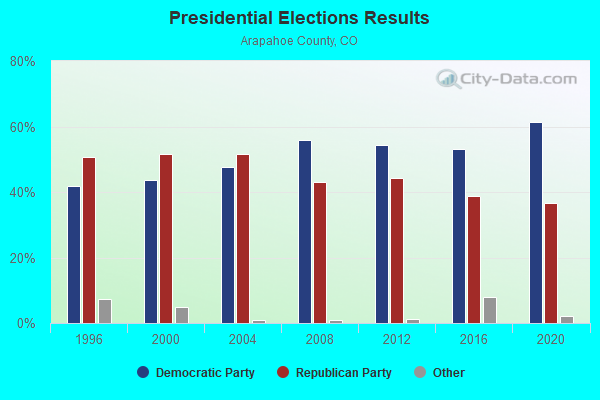
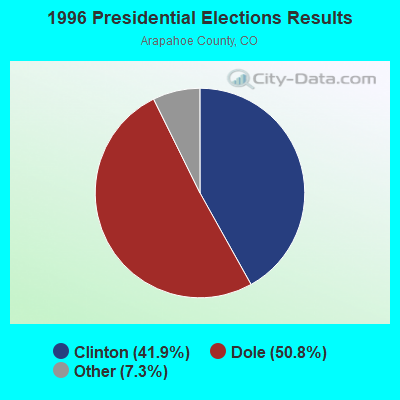
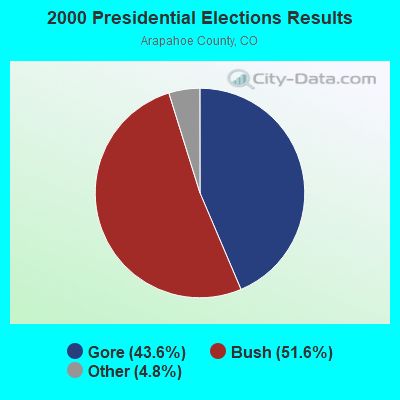
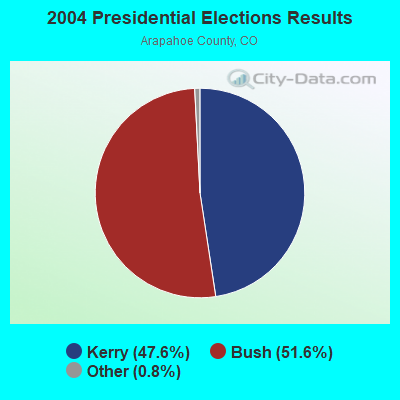
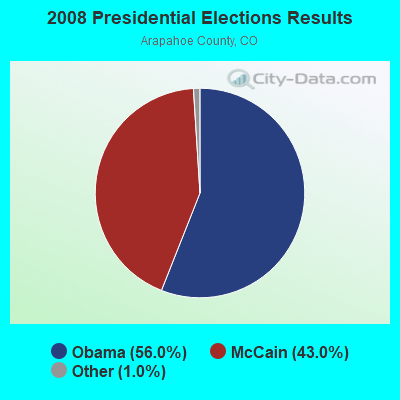

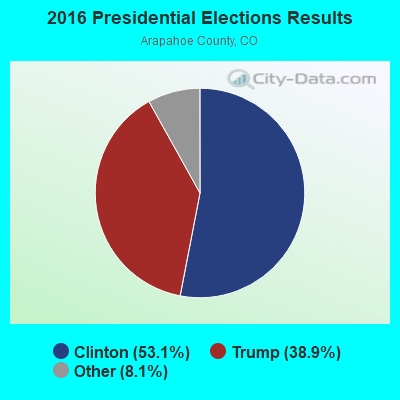
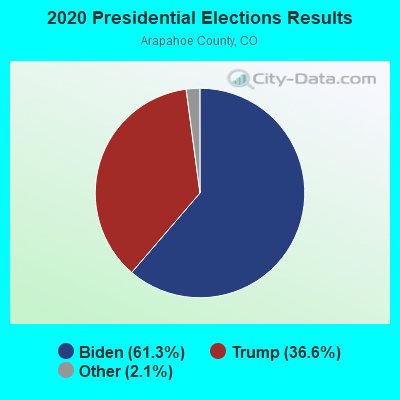
Graphs represent county-level data. Detailed 2008 Election Results
Religion statistics for Castlewood, CO (based on Arapahoe County data)
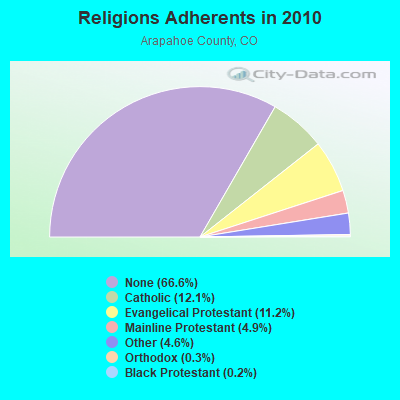
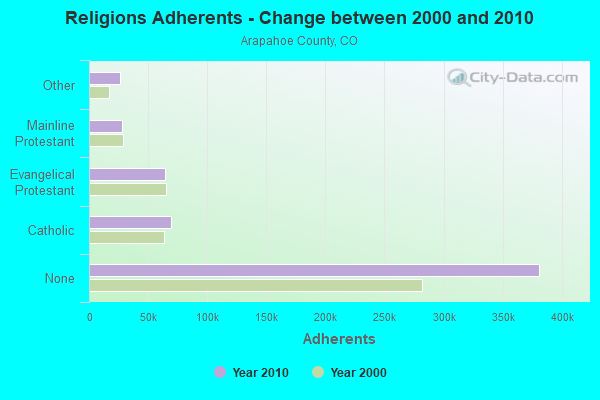
| Religion | Adherents | Congregations |
|---|---|---|
| Catholic | 69,031 | 13 |
| Evangelical Protestant | 64,204 | 178 |
| Mainline Protestant | 28,266 | 50 |
| Other | 26,495 | 53 |
| Orthodox | 1,780 | 4 |
| Black Protestant | 1,061 | 4 |
| None | 381,166 | - |
Food Environment Statistics:
| This county: | 1.47 / 10,000 pop. |
| Colorado: | 1.50 / 10,000 pop. |
| Arapahoe County: | 0.15 / 10,000 pop. |
| Colorado: | 0.15 / 10,000 pop. |
| Arapahoe County: | 0.39 / 10,000 pop. |
| Colorado: | 0.45 / 10,000 pop. |
| Arapahoe County: | 2.45 / 10,000 pop. |
| Colorado: | 3.13 / 10,000 pop. |
| Here: | 6.94 / 10,000 pop. |
| Colorado: | 8.99 / 10,000 pop. |
| Arapahoe County: | 6.0% |
| Colorado: | 5.3% |
| Arapahoe County: | 19.5% |
| State: | 18.4% |
| This county: | 9.6% |
| State: | 9.6% |
12.28% of this county's 2021 resident taxpayers lived in other counties in 2020 ($73,180 average adjusted gross income)
| Here: | 12.28% |
| Colorado average: | 11.28% |
0.04% of residents moved from foreign countries ($191 average AGI)
Arapahoe County: 0.04% Colorado average: 0.05%
Top counties from which taxpayers relocated into this county between 2020 and 2021:
| from Denver County, CO | |
| from Douglas County, CO | |
| from Adams County, CO |
12.70% of this county's 2020 resident taxpayers moved to other counties in 2021 ($75,361 average adjusted gross income)
| Here: | 12.70% |
| Colorado average: | 11.05% |
0.02% of residents moved to foreign countries ($156 average AGI)
Arapahoe County: 0.02% Colorado average: 0.03%
Top counties to which taxpayers relocated from this county between 2020 and 2021:
| to Denver County, CO | |
| to Douglas County, CO | |
| to Adams County, CO |
Strongest AM radio stations in Castlewood:
- KEZW (1430 AM; 10 kW; AURORA, CO; Owner: ENTERCOM DENVER LICENSE, LLC)
- KOA (850 AM; 50 kW; DENVER, CO; Owner: JACOR BROADCASTING OF COLORADO, INC.)
- KNRC (1150 AM; 10 kW; ENGLEWOOD, CO; Owner: NRC BROADCASTING, INC.)
- KCUV (1510 AM; 25 kW; LITTLETON, CO; Owner: PEOPLE WIRELESS, INC.)
- KBNO (1280 AM; 5 kW; DENVER, CO; Owner: LATINO COMMUNICATIONS, LLC)
- KMXA (1090 AM; 50 kW; AURORA, CO; Owner: ENTRAVISION HOLDINGS, LLC)
- KADZ (1550 AM; 10 kW; ARVADA, CO; Owner: ABC, INC.)
- KDDZ (1690 AM; 10 kW; ARVADA, CO; Owner: ABC, INC.)
- KLTT (670 AM; 50 kW; COMMERCE CITY, CO; Owner: KLZ RADIO, INC.)
- KKZN (760 AM; 50 kW; THORNTON, CO; Owner: JACOR BROADCASTING OF COLORADO, INC.)
- KRKS (990 AM; 10 kW; DENVER, CO; Owner: SALEM MEDIA OF COLORADO, INC.)
- KCKK (1600 AM; 5 kW; LAKEWOOD, CO; Owner: JEFFERSON-PILOT COMMUNICATIONS COMPANY OF COLORADO)
- KBJD (1650 AM; 10 kW; DENVER, CO; Owner: SALEM MEDIA OF COLORADO, INC.)
Strongest FM radio stations in Castlewood:
- KQMT (99.5 FM; DENVER, CO; Owner: ENTERCOM DENVER LICENSE, LLC)
- KJMN (92.1 FM; CASTLE ROCK, CO; Owner: ENTRAVISION HOLDINGS, LLC)
- KXKL-FM (105.1 FM; DENVER, CO; Owner: INFINITY RADIO OPERATIONS INC.)
- KALC (105.9 FM; DENVER, CO; Owner: ENTERCOM DENVER LICENSE, LLC)
- KBPI (106.7 FM; DENVER, CO; Owner: JACOR BROADCASTING OF COLORADO, INC.)
- KQKS (107.5 FM; LAKEWOOD, CO; Owner: JEFFERSON-PILOT COMMUNICATIONS COMPANY OF COLORADO)
- KOSI (101.1 FM; DENVER, CO; Owner: ENTERCOM DENVER LICENSE, LLC)
- KLDV (91.1 FM; MORRISON, CO; Owner: EDUCATIONAL MEDIA FOUNDATION)
- KFMD (95.7 FM; DENVER, CO; Owner: CITICASTERS LICENSES, L.P.)
- KRFX (103.5 FM; DENVER, CO; Owner: JACOR BROADCASTING OF COLORADO, INC.)
- KIMN (100.3 FM; DENVER, CO; Owner: INFINITY RADIO OPERATIONS INC.)
- KVOD (90.1 FM; DENVER, CO; Owner: PUBLIC BROADCASTING OF COLORADO, INC)
- KUVO (89.3 FM; DENVER, CO; Owner: DENVER EDUCATIONAL BROADCASTING)
- KYGO-FM (98.5 FM; DENVER, CO; Owner: JEFFERSON-PILOT COMMUNICATIONS COMPANY OF COLORADO)
- KXPK (96.5 FM; EVERGREEN, CO; Owner: ENTRAVISION HOLDINGS, LLC)
- KBCO-FM (97.3 FM; BOULDER, CO; Owner: CITICASTERS LICENSES, L.P.)
- K209DE (89.7 FM; GOLDEN, CO; Owner: WAY-FM MEDIA GROUP, INC.)
- KJCD (104.3 FM; LONGMONT, CO; Owner: JEFFERSON-PILOT COMMUNICATIONS COMPANY OF COLORADO)
- KRKS-FM (94.7 FM; LAFAYETTE, CO; Owner: SALEM MEDIA OF COLORADO, INC)
- KAVD (103.1 FM; LIMON, CO; Owner: THE MEADOWLARK GROUP, INC.)
TV broadcast stations around Castlewood:
- K48FW (Channel 48; DENVER, CO; Owner: TRINITY BROADCASTING NETWORK)
- KDEO-LP (Channel 38; AURORA, CO; Owner: PETER B. VAN DE SANDE)
- KMGH-TV (Channel 7; DENVER, CO; Owner: MCGRAW-HILL BROADCASTING COMPANY, INC.)
- KRMA-TV (Channel 6; DENVER, CO; Owner: ROCKY MOUNTAIN PUBLIC BROADCASTING NETWORK, INC.)
- KDEV-LP (Channel 62; AURORA, CO; Owner: TIGER EYE BROADCASTING CORPORATION)
- KUSA-TV (Channel 9; DENVER, CO; Owner: MULTIMEDIA HOLDINGS CORPORATION)
- KTVD (Channel 20; DENVER, CO; Owner: TWENVER BROADCAST, INC.)
- KCNC-TV (Channel 4; DENVER, CO; Owner: CBS TELEVISION STATIONS INC.)
- KWGN-TV (Channel 2; DENVER, CO; Owner: KWGN INC.)
- KMAS-LP (Channel 63; DENVER, CO; Owner: TELEMUNDO OF STEAMBOAT SPRINGS COLO. LIC. CORP.)
- KDEN (Channel 25; LONGMONT, CO; Owner: LONGMONT CHANNEL 25, INC.)
- KWHD (Channel 53; CASTLE ROCK, CO; Owner: LESEA BROADCASTING CORPORATION)
- KPXC-TV (Channel 59; DENVER, CO; Owner: PAXSON DENVER LICENSE, INC.)
- KDVR (Channel 31; DENVER, CO; Owner: FOX TELEVISION STATIONS, INC.)
- KRMT (Channel 41; DENVER, CO; Owner: WORD OF GOD FELLOWSHIP, INC.)
Castlewood fatal accident list:
May 30, 1999 05:26 PM, I-25, Lat: 39.583543, Lon: -104.878385, Vehicles: 1, Persons: 5, Pedestrians: 1, Fatalities: 1, Drunk persons involved: 1
Dec 7, 1998 09:45 PM, I-25, Vehicles: 2, Persons: 3, Fatalities: 1
Oct 8, 1994 07:45 PM, I25, Vehicles: 1, Persons: 2, Pedestrians: 1, Fatalities: 1, Drunk persons involved: 1
Oct 7, 1992 06:00 PM, Quebec St, Vehicles: 3, Persons: 3, Fatalities: 1
FCC Registered Microwave Towers:
5- S METRO EOC, 9195 E. Mineral Ave (Lat: 39.574444 Lon: -104.882222), Type: Building, Structure height: 16 m, Call Sign: WQAM459, Licensee ID: L00001440,
Assigned Frequencies: 6645.62 MHz, 11132.5 MHz, 6765.00 MHz, 6765.00 MHz, 6765.00 MHz, 6765.00 MHz, Grant Date: 04/18/2014, Expiration Date: 07/01/2024, Certifier: Dennis Kalvels, Registrant: State Of Colorado, 9195 East Mineral Avenue, Suite 200, Centennial, CO 80112, Phone: (303) 764-7975, Fax: (303) 764-7764, Email:
- FIDDLERS GRN, 6312 S Fiddlers Green Cir (Lat: 39.603361 Lon: -104.893917), Type: Pole, Structure height: 31 m, Overall height: 34 m, Call Sign: WQNH874, Licensee ID: L01423854,
Assigned Frequencies: 11095.0 MHz, 11095.0 MHz, 11095.0 MHz, 11095.0 MHz, 11175.0 MHz, 11175.0 MHz, 11175.0 MHz, 11175.0 MHz, 11095.0 MHz, 11095.0 MHz... (+5 more), Grant Date: 02/09/2011, Expiration Date: 02/09/2021, Cancellation Date: 04/17/2021, Certifier: Vinh T Phan, Registrant: Mho Networks, 8678 Concord Center Drive, Suite 100, Englewood, CO 80112, Phone: (303) 584-9711, Email:
- Mineral HQ, 9195 E. Mineral Ave. (Lat: 39.574833 Lon: -104.882250), Type: Building, Structure height: 13.8 m, Overall height: 19.8 m, Call Sign: WQSS548,
Assigned Frequencies: 10755.0 MHz, 10755.0 MHz, 10755.0 MHz, 10755.0 MHz, 10755.0 MHz, 10755.0 MHz, 10755.0 MHz, 10755.0 MHz, 10755.0 MHz, 10755.0 MHz, 10755.0 MHz, Grant Date: 11/02/2023, Expiration Date: 11/07/2033, Certifier: Vince Turner, Registrant: Kns Communications Consultants, 3 Inverness Drive East, Suite 100, Englewood, CO 80112, Phone: (720) 480-3694, Fax: (855) 293-2913, Email:
- 7180EASTORCH, 7180 East Orchard Road (Lat: 39.609139 Lon: -104.905611), Type: Pole, Structure height: 15.2 m, Overall height: 18.2 m, Call Sign: WQXN928, Licensee ID: L01423854,
Assigned Frequencies: 10995.0 MHz, 10995.0 MHz, 10995.0 MHz, 10995.0 MHz, 10995.0 MHz, 10995.0 MHz, 10975.0 MHz, 10975.0 MHz, 10975.0 MHz, 10975.0 MHz... (+3 more), Grant Date: 04/26/2016, Expiration Date: 04/26/2026, Certifier: Vinh T Phan, Registrant: Mho Networks, 8678 Concord Center Drive, Suite 100, Englewood, CO 80112, Phone: (303) 584-9711, Email:
- 8000 S CHEST, 8000 S Chester Street (Lat: 39.571000 Lon: -104.878417), Type: Pole, Structure height: 25.3 m, Overall height: 28.4 m, Call Sign: WRDN678, Licensee ID: L01423854,
Assigned Frequencies: 10895.0 MHz, 11055.0 MHz, 23125.0 MHz, 10895.0 MHz, 11055.0 MHz, 23125.0 MHz, 10895.0 MHz, 11055.0 MHz, 23125.0 MHz, 10895.0 MHz... (+18 more), Grant Date: 06/12/2019, Expiration Date: 06/12/2029, Certifier: Vinh T Phan, Registrant: Mho Networks, 8678 Concord Center Drive, Suite 100, Englewood, CO 80112, Phone: (303) 584-9711, Email:
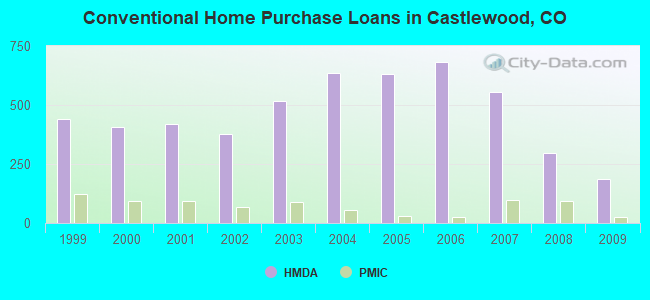
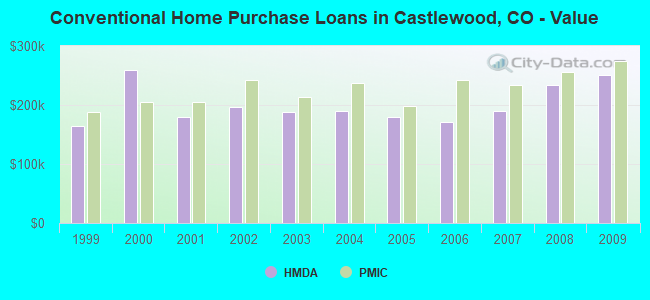
| Home Mortgage Disclosure Act Aggregated Statistics For Year 2009 (Based on 5 full tracts) | ||||||||||||
| A) FHA, FSA/RHS & VA Home Purchase Loans | B) Conventional Home Purchase Loans | C) Refinancings | D) Home Improvement Loans | F) Non-occupant Loans on < 5 Family Dwellings (A B C & D) | G) Loans On Manufactured Home Dwelling (A B C & D) | |||||||
|---|---|---|---|---|---|---|---|---|---|---|---|---|
| Number | Average Value | Number | Average Value | Number | Average Value | Number | Average Value | Number | Average Value | Number | Average Value | |
| LOANS ORIGINATED | 142 | $242,865 | 186 | $250,262 | 1,217 | $236,817 | 28 | $154,595 | 41 | $190,162 | 1 | $408,000 |
| APPLICATIONS APPROVED, NOT ACCEPTED | 9 | $235,666 | 18 | $200,596 | 93 | $246,482 | 7 | $86,413 | 3 | $147,433 | 0 | $0 |
| APPLICATIONS DENIED | 16 | $236,159 | 21 | $214,971 | 202 | $235,205 | 10 | $21,511 | 10 | $148,540 | 0 | $0 |
| APPLICATIONS WITHDRAWN | 11 | $307,340 | 16 | $202,286 | 162 | $244,938 | 14 | $150,082 | 10 | $149,302 | 0 | $0 |
| FILES CLOSED FOR INCOMPLETENESS | 1 | $194,000 | 6 | $207,850 | 49 | $227,808 | 1 | $39,860 | 6 | $143,907 | 0 | $0 |
Detailed HMDA statistics for the following Tracts: 0067.06 , 0067.07, 0067.08, 0067.09, 0067.11
| Private Mortgage Insurance Companies Aggregated Statistics For Year 2009 (Based on 5 full tracts) | ||||
| A) Conventional Home Purchase Loans | B) Refinancings | |||
|---|---|---|---|---|
| Number | Average Value | Number | Average Value | |
| LOANS ORIGINATED | 25 | $273,897 | 31 | $299,046 |
| APPLICATIONS APPROVED, NOT ACCEPTED | 8 | $235,226 | 15 | $278,955 |
| APPLICATIONS DENIED | 1 | $224,630 | 9 | $306,159 |
| APPLICATIONS WITHDRAWN | 2 | $124,500 | 3 | $299,407 |
| FILES CLOSED FOR INCOMPLETENESS | 2 | $206,000 | 2 | $340,000 |
Detailed PMIC statistics for the following Tracts: 0067.06 , 0067.07, 0067.08, 0067.09, 0067.11
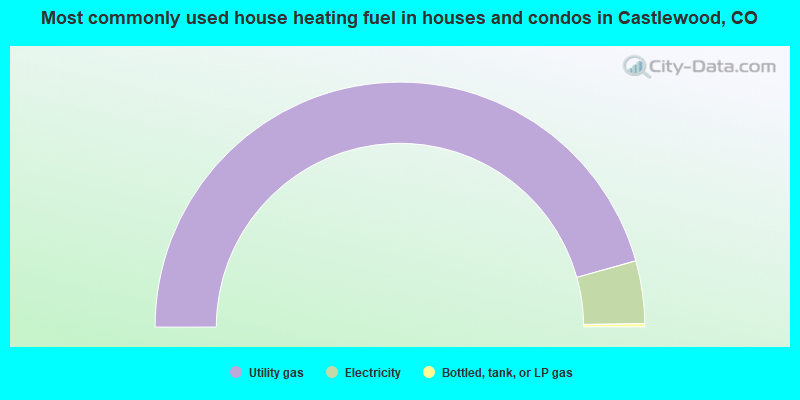
- 91.3%Utility gas
- 8.3%Electricity
- 0.4%Bottled, tank, or LP gas
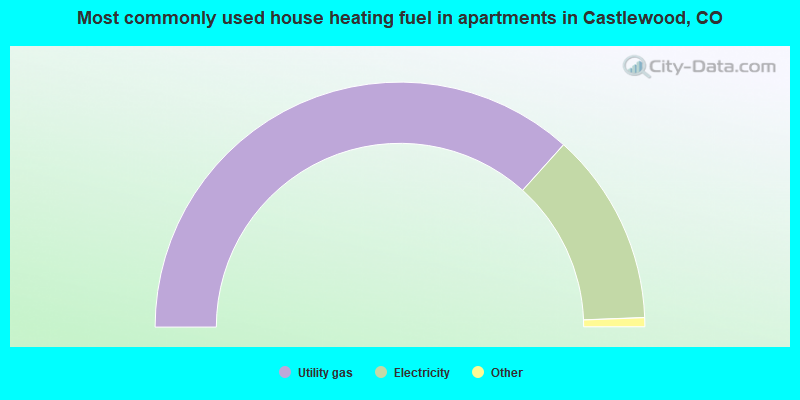
- 73.3%Utility gas
- 25.5%Electricity
- 0.4%Bottled, tank, or LP gas
- 0.4%Fuel oil, kerosene, etc.
- 0.4%No fuel used
Castlewood compared to Colorado state average:
- Median household income above state average.
- Unemployed percentage significantly below state average.
- Black race population percentage significantly below state average.
- Hispanic race population percentage significantly below state average.
- Renting percentage significantly below state average.
- Length of stay since moving in significantly above state average.
- Number of rooms per house significantly below state average.
- House age significantly below state average.
- Institutionalized population percentage significantly above state average.
- Percentage of population with a bachelor's degree or higher above state average.
Castlewood on our top lists:
- #3 on the list of "Top 101 cities with largest percentage of males in industries: broadcasting and telecommunications (population 5,000+)"
- #6 on the list of "Top 101 cities with largest percentage of females in industries: broadcasting and telecommunications (population 5,000+)"
- #15 on the list of "Top 101 cities with largest percentage of males in industries: data processing, libraries, and other information services (population 5,000+)"
- #24 on the list of "Top 101 cities with largest percentage of females in industries: data processing, libraries, and other information services (population 5,000+)"
- #27 on the list of "Top 101 cities with largest percentage of males in occupations: computer specialists (population 5,000+)"
- #29 on the list of "Top 101 cities with largest percentage of males in occupations: sales representatives, services, wholesale and manufacturing (population 5,000+)"
- #34 on the list of "Top 101 cities with largest percentage of males in industries: radio, tv, and computer stores (population 5,000+)"
- #40 on the list of "Top 101 cities with largest percentage of females in occupations: computer specialists (population 5,000+)"
- #44 on the list of "Top 101 cities with largest percentage of males in occupations: financial managers (population 5,000+)"
- #64 on the list of "Top 101 cities with largest percentage of females in occupations: preschool, kindergarten, elementary and middle school teachers (population 5,000+)"
- #75 on the list of "Top 101 cities with largest percentage of females in occupations: top executives (population 5,000+)"
- #78 on the list of "Top 101 cities with largest percentage of males in industries: professional and commercial equipment and supplies merchant wholesalers (population 5,000+)"
- #88 on the list of "Top 100 highest located cities (pop. 5,000+)"
- #96 on the list of "Top 101 cities with largest percentage of females in industries: professional and commercial equipment and supplies merchant wholesalers (population 5,000+)"
- #18 (80112) on the list of "Top 101 zip codes with the most finance and insurance companies in 2005"
- #19 (80112) on the list of "Top 101 zip codes with the most medium-big companies in 2005 (at least 100 employees)"
- #11 on the list of "Top 101 counties with the largest increase in the number of infant deaths per 1000 residents 2000-2006 to 2007-2013 (pop. 50,000+)"
- #19 on the list of "Top 101 counties with the highest Ozone (1-hour) air pollution readings in 2012 (ppm)"
- #40 on the list of "Top 101 counties with the highest percentage of residents that exercised in the past month"
- #46 on the list of "Top 101 counties with the highest percentage of residents relocating from other counties between 2010 and 2011 (pop. 50,000+)"
- #47 on the list of "Top 101 counties with the best general health status score of residents (1-5), 3 years of data"