Chesapeake Ranch Estates-Drum Point, Maryland

Chesapeake Ranch Estates-Drum Point: Drum Point Beach 2

Chesapeake Ranch Estates-Drum Point: Home in Drum Point

Chesapeake Ranch Estates-Drum Point: Storm view from Cliff in Chesapeak Ranch Estates

Chesapeake Ranch Estates-Drum Point: Heron on Piling in Drum Point
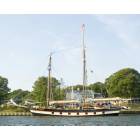
Chesapeake Ranch Estates-Drum Point: Whaler Parked at dock on Mill Creek in Drum Point

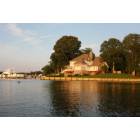
Chesapeake Ranch Estates-Drum Point: Drum Point Beach

Chesapeake Ranch Estates-Drum Point: Storm view from Cliff in Chesapeak Ranch Estates

Chesapeake Ranch Estates-Drum Point: Boat & Dog in Solomons Harbor
Chesapeake Ranch Estates-Drum Point: Home on Deer Drive, Drum Point
- add
your
Submit your own pictures of this place and show them to the world
- OSM Map
- General Map
- Google Map
- MSN Map
Current weather forecast for Chesapeake Ranch Estates-Drum Point, MD
| Males: 6,740 | |
| Females: 6,745 |
| Median resident age: | 31.8 years |
| Maryland median age: | 36.0 years |
Zip codes: 20657.
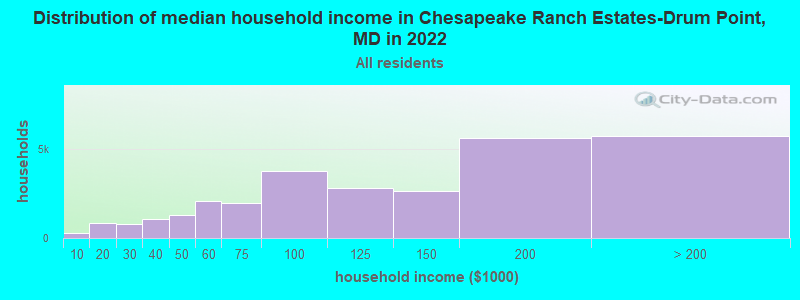
| Chesapeake Ranch Estates-Drum Point: | $103,632 |
| MD: | $94,991 |
Estimated per capita income in 2022: $42,278 (it was $21,428 in 2000)
Chesapeake Ranch Estates-Drum Point CDP income, earnings, and wages data
Estimated median house or condo value in 2022: $324,807 (it was $126,400 in 2000)
| Chesapeake Ranch Estates-Drum Point: | $324,807 |
| MD: | $398,100 |
Chesapeake Ranch Estates-Drum Point, MD residents, houses, and apartments details
Detailed information about poverty and poor residents in Chesapeake Ranch Estates-Drum Point, MD

Compare current foreclosures near your location:
| Photo | Address | Area | Beds / Baths | Price | Details |
|---|---|---|---|---|---|

|
#1
Bayberry Cir
Columbus, OH 43207
|
1,564 sq. feet
|
1 baths 3 beds |
$127,500
|
show details |

|
#2
E 21st Ave
Columbus, OH 43211
|
1,061 sq. feet
|
1 baths 3 beds |
$187,900
|
show details |

|
#3
S High St
Columbus, OH 43207
|
1,678 sq. feet
|
2 baths 4 beds |
$31,900
|
show details |

|
#4
Midland Ave
Columbus, OH 43223
|
1,518 sq. feet
|
1 baths 2 beds |
show details | |

|
#5
Mink St SW
Pataskala, OH 43062
|
1,442 sq. feet
|
1 baths 3 beds |
show details | |

|
#6
Falls Peak Ln
Delaware, OH 43015
|
1,352 sq. feet
|
2 baths 2 beds |
show details | |

|
#7
Kingsglen Dr
Grove City, OH 43123
|
1,635 sq. feet
|
2 baths 4 beds |
show details | |

|
#8
Wrexham Ave
Columbus, OH 43223
|
1,235 sq. feet
|
1 baths 3 beds |
show details | |

|
#9
Hiawatha Park Dr
Columbus, OH 43211
|
1,278 sq. feet
|
1 baths 4 beds |
show details | |

|
#10
Arborlee Dr
Reynoldsburg, OH 43068
|
1,263 sq. feet
|
2 baths 3 beds |
show details |
| Photo | Address | Area | Beds / Baths | Price | Details |
|---|---|---|---|---|---|

|
#11
High Free Pike
West Jefferson, OH 43162
|
1,216 sq. feet
|
2 baths 4 beds |
show details | |

|
#12
Ferris Rd
Columbus, OH 43224
|
2,218 sq. feet
|
3 baths 3 beds |
show details | |

|
#13
Marshrun Dr
Grove City, OH 43123
|
2,036 sq. feet
|
2 baths 4 beds |
show details | |

|
#14
S Richardson Ave
Columbus, OH 43204
|
1,520 sq. feet
|
2 baths 3 beds |
show details | |

|
#15
Meadowbrook Dr
Columbus, OH 43207
|
1,752 sq. feet
|
2 baths 4 beds |
show details | |

|
#16
Fergus Rd
Grove City, OH 43123
|
3,312 sq. feet
|
2 baths 4 beds |
show details | |

|
#17
S Chillicothe St
Plain City, OH 43064
|
1,736 sq. feet
|
2 baths 4 beds |
show details | |

|
#18
Fahlander Dr N
Columbus, OH 43229
|
1,338 sq. feet
|
2 baths 3 beds |
show details | |

|
#19
E Welch Ave
Columbus, OH 43207
|
1,864 sq. feet
|
2 baths 3 beds |
show details | |

|
#20
S Hague Ave
Columbus, OH 43204
|
979 sq. feet
|
1 baths 2 beds |
show details |
| Photo | Address | Area | Beds / Baths | Price | Details |
|---|---|---|---|---|---|

|
#21
N Grener Ave
Columbus, OH 43228
|
1,120 sq. feet
|
1 baths 3 beds |
show details | |

|
#22
Vineyard Haven Loop
Dublin, OH 43016
|
4,625 sq. feet
|
4 baths 4 beds |
show details | |

|
#23
Brookstone Dr
Westerville, OH 43082
|
1,783 sq. feet
|
3 baths 3 beds |
show details | |

|
#24
N Roys Ave
Columbus, OH 43204
|
1,248 sq. feet
|
2 baths 3 beds |
show details | |

|
#25
Bretton Pl
Columbus, OH 43211
|
1,056 sq. feet
|
1 baths 3 beds |
show details | |

|
#26
Scottwood Rd
Columbus, OH 43227
|
1,008 sq. feet
|
1 baths 3 beds |
show details | |

|
#27
Rosewood Ct
Powell, OH 43065
|
2,801 sq. feet
|
3 baths 4 beds |
show details | |

|
#28
Sleeping Meadow Dr
New Albany, OH 43054
|
3,211 sq. feet
|
2 baths 4 beds |
show details | |

|
#29
Bernadette Rd
Columbus, OH 43204
|
1,168 sq. feet
|
1 baths 3 beds |
show details | |

|
#30
Elaine Rd
Columbus, OH 43213
|
764 sq. feet
|
1 baths 2 beds |
show details |
| Photo | Address | Area | Beds / Baths | Price | Details |
|---|---|---|---|---|---|

|
#31
Belle Oak Dr
Galloway, OH 43119
|
1,296 sq. feet
|
2 baths 3 beds |
show details | |

|
#32
Stoneybrook Blvd # 21a
Hilliard, OH 43026
|
1,231 sq. feet
|
2 baths 3 beds |
show details | |

|
#33
Spohn Dr
Westerville, OH 43081
|
1,040 sq. feet
|
1 baths 3 beds |
show details | |

|
#34
Mayflower Blvd
Columbus, OH 43213
|
1,591 sq. feet
|
2 baths 4 beds |
show details | |

|
#35
Derrer Rd -872
Columbus, OH 43204
|
1,667 sq. feet
|
2 baths 5 beds |
show details | |

|
#36
Beacontree Dr
Columbus, OH 43224
|
1,412 sq. feet
|
2 baths 3 beds |
show details | |

|
#37
Brookgrove Dr
Grove City, OH 43123
|
942 sq. feet
|
1 baths 3 beds |
show details | |

|
#38
Danforth Rd
Columbus, OH 43224
|
1,080 sq. feet
|
1 baths 3 beds |
show details | |

|
#39
Silverglade Dr
Columbus, OH 43230
|
1,741 sq. feet
|
2 baths 3 beds |
show details | |

|
#40
Fenton St
Columbus, OH 43224
|
960 sq. feet
|
1 baths 3 beds |
show details |
| Photo | Address | Area | Beds / Baths | Price | Details |
|---|---|---|---|---|---|

|
#41
Pershing Dr
Columbus, OH 43224
|
1,440 sq. feet
|
1 baths 3 beds |
show details | |

|
#42
Nautical Dr
Columbus, OH 43207
|
1,320 sq. feet
|
2 baths 3 beds |
show details | |

|
#43
Rutgers Ln
Hilliard, OH 43026
|
832 sq. feet
|
1 baths 2 beds |
show details | |

|
#44
Haughn Rd
Grove City, OH 43123
|
1,931 sq. feet
|
1 baths 3 beds |
show details | |

|
#45
Chantilly St
Columbus, OH 43207
|
939 sq. feet
|
1 baths 3 beds |
show details | |

|
#46
Batavia Ct
Westerville, OH 43081
|
1,433 sq. feet
|
1 baths 3 beds |
show details | |

|
#47
Legionary St
Columbus, OH 43207
|
1,200 sq. feet
|
1 baths 3 beds |
show details | |

|
#48
Voeller Cir
Grove City, OH 43123
|
1,128 sq. feet
|
1 baths 3 beds |
show details | |

|
#49
Balford Sq W
Columbus, OH 43232
|
1,444 sq. feet
|
1 baths 3 beds |
show details | |

|
Check over 1 million property listings on Foreclosure.com!
|
browse all offers | |||

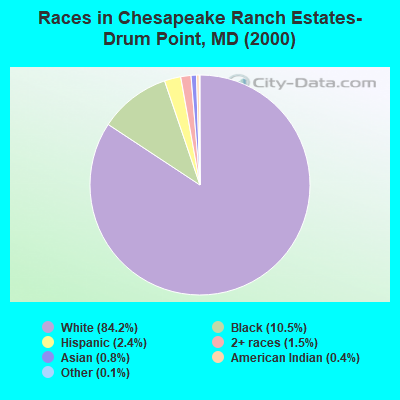
- 9,68884.2%White alone
- 1,20310.5%Black alone
- 2802.4%Hispanic
- 1741.5%Two or more races
- 960.8%Asian alone
- 410.4%American Indian alone
- 150.1%Other race alone
- 60.05%Native Hawaiian and Other
Pacific Islander alone
 Recent articles from our blog. Our writers, many of them Ph.D. graduates or candidates, create easy-to-read articles on a wide variety of topics.

Ancestries: German (19.2%), Irish (16.4%), English (12.6%), United States (7.9%), Italian (6.5%), Scotch-Irish (2.6%).
Current Local Time: EST time zone
Land area: 6.04 square miles.
Population density: 2,233 people per square mile (low).
221 residents are foreign born
| This place: | 1.9% |
| Maryland: | 9.8% |
| Chesapeake Ranch Estates-Drum Point CDP: | 1.1% ($1,331) |
| Maryland: | 1.2% ($1,782) |
Nearest city with pop. 50,000+: Bowie, MD (46.0 miles  , pop. 50,269).
Nearest city with pop. 200,000+: Washington, DC (50.5 miles , pop. 572,059).
Nearest city with pop. 1,000,000+: Philadelphia, PA (132.9 miles , pop. 1,517,550).
Nearest cities:
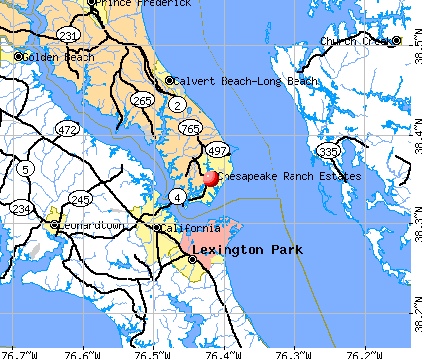
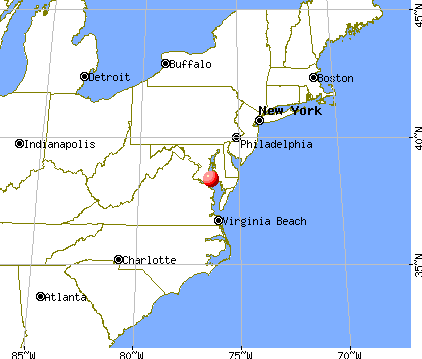
), ), ), )Latitude: 38.35 N, Longitude: 76.42 W
Daytime population change due to commuting: -5,274 (-45.8%)
Workers who live and work in this place: 182 (3.3%)
| Here: | 1.7% |
| Maryland: | 2.0% |
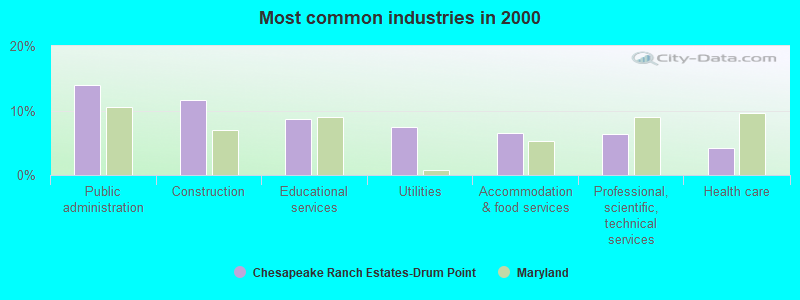
- Public administration (14.0%)
- Construction (11.6%)
- Educational services (8.7%)
- Utilities (7.5%)
- Accommodation & food services (6.6%)
- Professional, scientific, technical services (6.4%)
- Health care (4.2%)
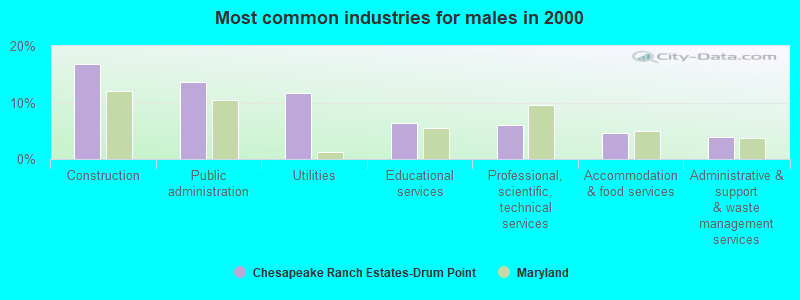
- Construction (16.9%)
- Public administration (13.6%)
- Utilities (11.8%)
- Educational services (6.3%)
- Professional, scientific, technical services (5.9%)
- Accommodation & food services (4.6%)
- Administrative & support & waste management services (3.9%)

- Public administration (14.5%)
- Educational services (11.4%)
- Accommodation & food services (8.9%)
- Health care (7.3%)
- Professional, scientific, technical services (6.9%)
- Construction (5.5%)
- Social assistance (5.1%)
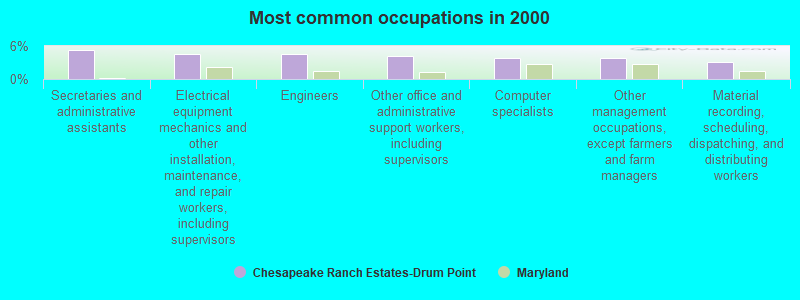
- Secretaries and administrative assistants (5.4%)
- Electrical equipment mechanics and other installation, maintenance, and repair workers, including supervisors (4.5%)
- Engineers (4.5%)
- Other office and administrative support workers, including supervisors (4.2%)
- Computer specialists (3.9%)
- Other management occupations, except farmers and farm managers (3.8%)
- Material recording, scheduling, dispatching, and distributing workers (3.1%)

- Electrical equipment mechanics and other installation, maintenance, and repair workers, including supervisors (7.4%)
- Engineers (7.2%)
- Other management occupations, except farmers and farm managers (5.3%)
- Computer specialists (5.0%)
- Vehicle and mobile equipment mechanics, installers, and repairers (4.5%)
- Driver/sales workers and truck drivers (4.1%)
- Carpenters (4.0%)

- Secretaries and administrative assistants (11.5%)
- Other office and administrative support workers, including supervisors (5.7%)
- Child care workers (4.4%)
- Preschool, kindergarten, elementary, and middle school teachers (3.6%)
- Other sales and related occupations, including supervisors (3.5%)
- Cashiers (3.0%)
- Information and record clerks, except customer service representatives (2.9%)
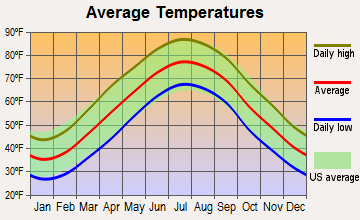
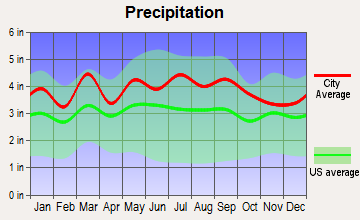
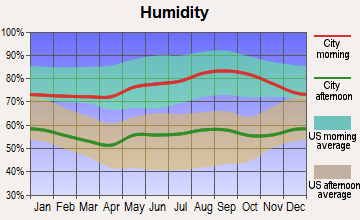
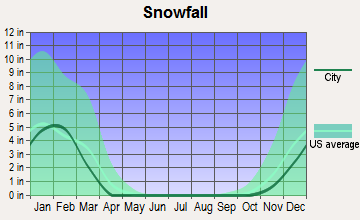
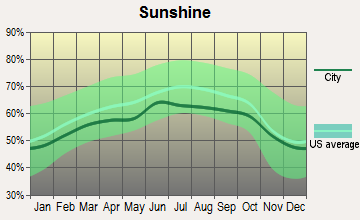
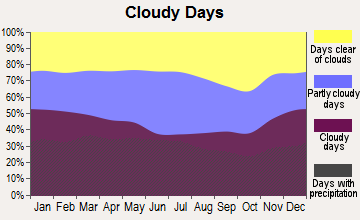
Average climate in Chesapeake Ranch Estates-Drum Point, Maryland
Based on data reported by over 4,000 weather stations

(lower is better)
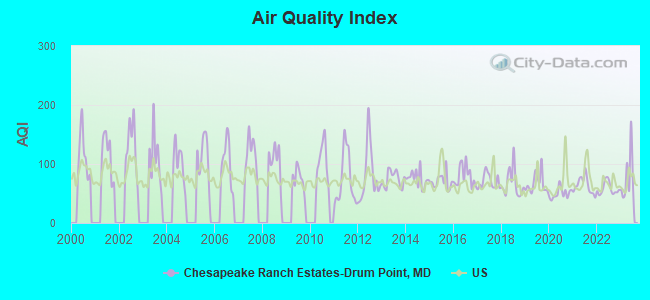
Air Quality Index (AQI) level in 2023 was 76.6. This is about average.
| City: | 76.6 |
| U.S.: | 72.6 |
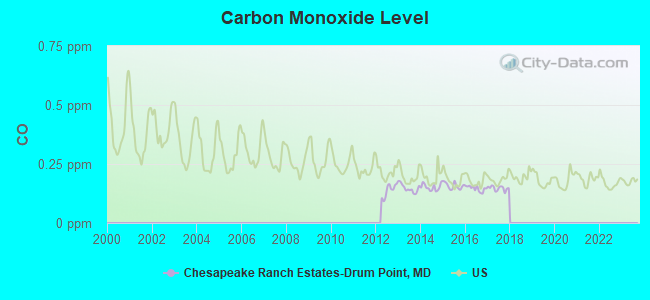
Carbon Monoxide (CO) [ppm] level in 2017 was 0.147. This is significantly better than average. Closest monitor was 22.3 miles away from the city center.
| City: | 0.147 |
| U.S.: | 0.251 |
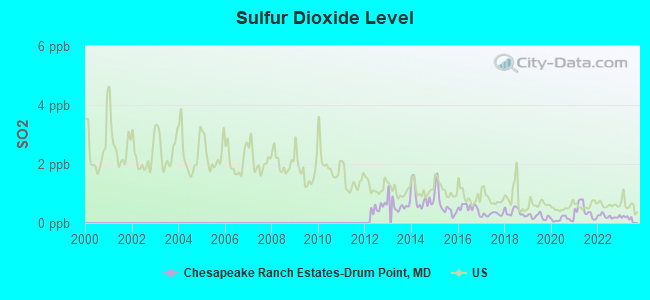
Sulfur Dioxide (SO2) [ppb] level in 2022 was 0.229. This is significantly better than average. Closest monitor was 3.1 miles away from the city center.
| City: | 0.229 |
| U.S.: | 1.515 |
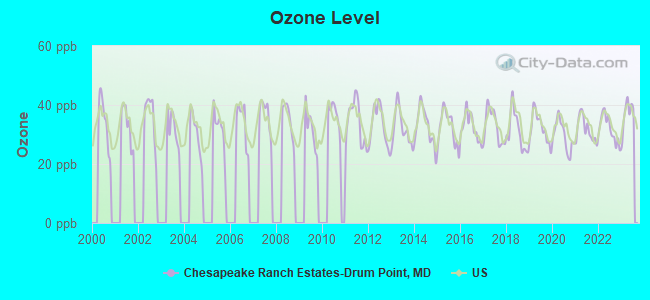
Ozone [ppb] level in 2023 was 36.9. This is about average. Closest monitor was 15.9 miles away from the city center.
| City: | 36.9 |
| U.S.: | 33.3 |
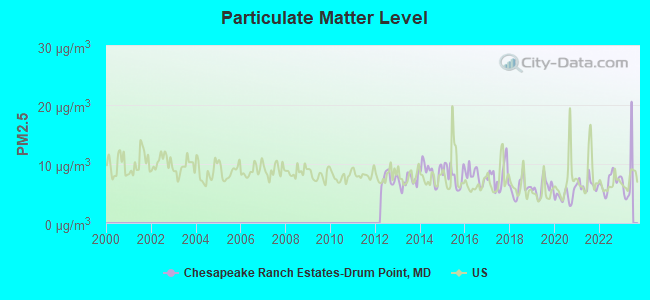
Particulate Matter (PM2.5) [µg/m3] level in 2022 was 6.98. This is about average. Closest monitor was 22.3 miles away from the city center.
| City: | 6.98 |
| U.S.: | 8.11 |
Tornado activity:
Chesapeake Ranch Estates-Drum Point-area historical tornado activity is slightly below Maryland state average. It is 20% smaller than the overall U.S. average.
On 4/28/2002, a category F4 (max. wind speeds 207-260 mph) tornado 10.0 miles away from the Chesapeake Ranch Estates-Drum Point place center killed 3 people and injured 122 people and caused $124 million in damages.
On 4/28/2002, a category F3 (max. wind speeds 158-206 mph) tornado 8.1 miles away from the place center caused $150,000 in damages.
Earthquake activity:
Chesapeake Ranch Estates-Drum Point-area historical earthquake activity is significantly above Maryland state average. It is 60% smaller than the overall U.S. average.On 8/23/2011 at 17:51:04, a magnitude 5.8 (5.8 MW, Depth: 3.7 mi, Class: Moderate, Intensity: VI - VII) earthquake occurred 88.0 miles away from Chesapeake Ranch Estates-Drum Point center
On 8/25/2011 at 05:07:52, a magnitude 4.5 (4.5 ML, Depth: 4.2 mi, Class: Light, Intensity: IV - V) earthquake occurred 88.7 miles away from Chesapeake Ranch Estates-Drum Point center
On 12/9/2003 at 20:59:14, a magnitude 4.5 (4.5 MB, 4.5 LG) earthquake occurred 96.6 miles away from the city center
On 12/9/2003 at 20:59:18, a magnitude 4.5 (4.5 ML, Depth: 6.2 mi) earthquake occurred 99.8 miles away from Chesapeake Ranch Estates-Drum Point center
On 1/16/1994 at 01:49:16, a magnitude 4.6 (4.6 MB, 4.6 LG, Depth: 3.1 mi) earthquake occurred 138.5 miles away from the city center
On 8/24/2011 at 00:04:36, a magnitude 4.2 (4.2 ML) earthquake occurred 88.8 miles away from the city center
Magnitude types: regional Lg-wave magnitude (LG), body-wave magnitude (MB), local magnitude (ML), moment magnitude (MW)
Natural disasters:
The number of natural disasters in Calvert County (20) is greater than the US average (15).Major Disasters (Presidential) Declared: 15
Emergencies Declared: 5
Causes of natural disasters: Hurricanes: 7, Winter Storms: 5, Snowstorms: 3, Storms: 3, Floods: 2, Tornadoes: 2, Blizzard: 1, Heavy Rain: 1, Ice Storm: 1, Snowfall: 1, Tropical Storm: 1, Wind: 1, Other: 1 (Note: some incidents may be assigned to more than one category).

Hospitals and medical centers near Chesapeake Ranch Estates-Drum Point:
- SOLOMONS NURSING CENTER (Nursing Home, about 2 miles away; SOLOMONS, MD)
- ASBURY SOLOMONS (Nursing Home, about 3 miles away; SOLOMONS, MD)
- CHESAPEAKE SHORES (Nursing Home, about 8 miles away; LEXINGTON PARK, MD)
- ST. MARY'S NURSING CENTER INC (Nursing Home, about 13 miles away; LEONARDTOWN, MD)
- MEDSTAR SAINT MARY'S HOSPITAL Acute Care Hospitals (about 13 miles away; LEONARDTOWN, MD)
Operable nuclear power plants near Chesapeake Ranch Estates-Drum Point:
- 1 miles: Calvert Cliffs 1 and 2 in Lusby, MD.
Colleges/universities with over 2000 students nearest to Chesapeake Ranch Estates-Drum Point:
- College of Southern Maryland (about 36 miles; La Plata, MD; Full-time enrollment: 5,775)
- University of Maryland Eastern Shore (about 41 miles; Princess Anne, MD; FT enrollment: 3,902)
- Strayer University-Maryland (about 43 miles; Suitland, MD; FT enrollment: 2,748)
- Prince George's Community College (about 44 miles; Largo, MD; FT enrollment: 8,537)
- United States Naval Academy (about 44 miles; Annapolis, MD; FT enrollment: 5,681)
- Salisbury University (about 45 miles; Salisbury, MD; FT enrollment: 8,375)
- Anne Arundel Community College (about 49 miles; Arnold, MD; FT enrollment: 10,501)
Points of interest:
Notable locations in Chesapeake Ranch Estates-Drum Point: Ship Point Research Park (A), Chesapeake Ranch Estates Campground (B), Brick Landing (C). Display/hide their locations on the map
Lakes and reservoirs: Lake Vista (A), Chesapeake Ranch Club Lake (B), Lake Lariat (C), Lake Charming (D). Display/hide their locations on the map
Streams, rivers, and creeks: Brown Creek (A), Burrell Branch (B), Coles Creek (C), Cleve Branch (D), Parker Moore Creek (E), Fishing Creek (F). Display/hide their locations on the map
| This place: | 3.0 people |
| Maryland: | 2.6 people |
| This place: | 78.7% |
| Whole state: | 69.1% |
| This place: | 7.1% |
| Whole state: | 5.6% |
Likely homosexual households (counted as self-reported same-sex unmarried-partner households)
- Lesbian couples: 0.3% of all households
- Gay men: 0.4% of all households
| This place: | 4.8% |
| Whole state: | 8.5% |
| This place: | 2.1% |
| Whole state: | 4.2% |
For population 15 years and over in Chesapeake Ranch Estates-Drum Point:
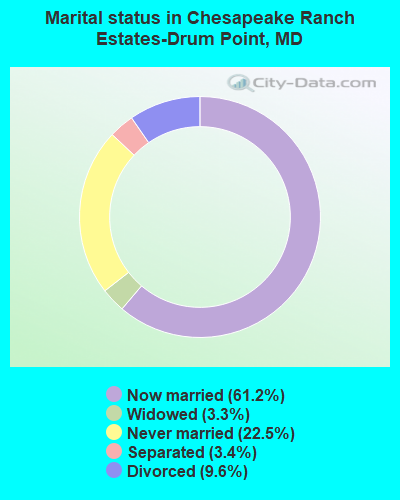
- Never married: 22.5%
- Now married: 61.2%
- Separated: 3.4%
- Widowed: 3.3%
- Divorced: 9.6%
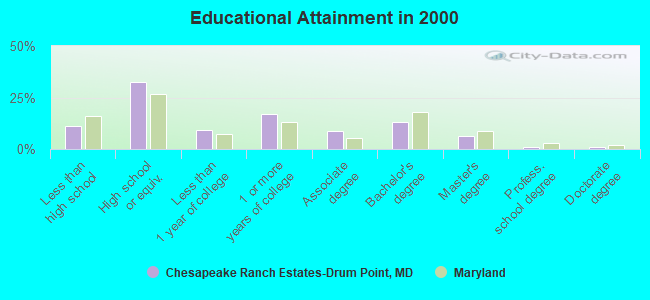
For population 25 years and over in Chesapeake Ranch Estates-Drum Point:
- High school or higher: 88.8%
- Bachelor's degree or higher: 21.3%
- Graduate or professional degree: 8.2%
- Unemployed: 4.6%
- Mean travel time to work (commute): 43.1 minutes
| Here: | 9.5 |
| Maryland average: | 12.7 |
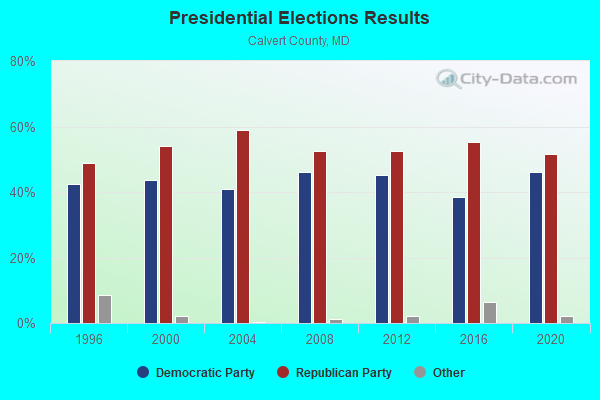

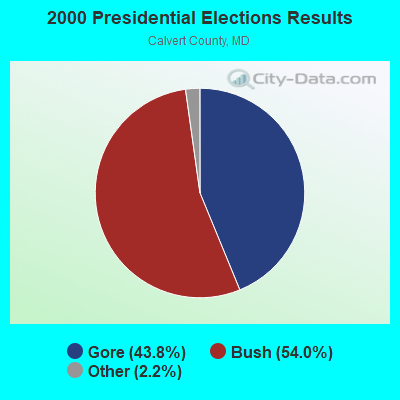


Graphs represent county-level data. Detailed 2008 Election Results
Religion statistics for Chesapeake Ranch Estates-Drum Point, MD (based on Calvert County data)

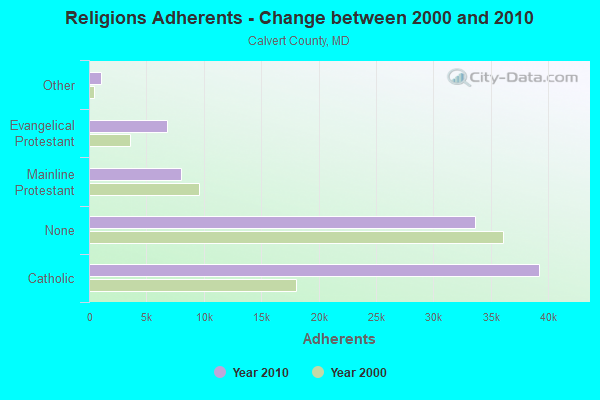
| Religion | Adherents | Congregations |
|---|---|---|
| Catholic | 39,245 | 5 |
| Mainline Protestant | 7,988 | 32 |
| Evangelical Protestant | 6,779 | 31 |
| Other | 1,076 | 3 |
| Black Protestant | - | 2 |
| None | 33,649 | - |
Food Environment Statistics:
| Here: | 1.47 / 10,000 pop. |
| Maryland: | 1.96 / 10,000 pop. |
| This county: | 0.79 / 10,000 pop. |
| Maryland: | 1.22 / 10,000 pop. |
| This county: | 2.16 / 10,000 pop. |
| Maryland: | 2.05 / 10,000 pop. |
| Calvert County: | 4.88 / 10,000 pop. |
| Maryland: | 5.40 / 10,000 pop. |
| Calvert County: | 8.2% |
| Maryland: | 9.1% |
| Here: | 26.1% |
| State: | 26.7% |
| Calvert County: | 10.8% |
| Maryland: | 15.5% |
7.84% of this county's 2021 resident taxpayers lived in other counties in 2020 ($80,515 average adjusted gross income)
| Here: | 7.84% |
| Maryland average: | 7.42% |
0.10% of residents moved from foreign countries ($1,116 average AGI)
Calvert County: 0.10% Maryland average: 0.05%
Top counties from which taxpayers relocated into this county between 2020 and 2021:
| from Anne Arundel County, MD | |
| from Prince George's County, MD | |
| from St. Mary's County, MD |
7.12% of this county's 2020 resident taxpayers moved to other counties in 2021 ($84,490 average adjusted gross income)
| Here: | 7.12% |
| Maryland average: | 7.91% |
0.05% of residents moved to foreign countries ($853 average AGI)
Calvert County: 0.05% Maryland average: 0.04%
Top counties to which taxpayers relocated from this county between 2020 and 2021:
| to St. Mary's County, MD | |
| to Anne Arundel County, MD | |
| to Prince George's County, MD |
Strongest AM radio stations in Chesapeake Ranch Estates-Drum Point:
- WPTX (1690 AM; 10 kW; LEXINGTON PARK, MD; Owner: SOMAR COMMUNICATIONS, INC.)
- WWGB (1030 AM; daytime; 50 kW; INDIAN HEAD, MD; Owner: GOOD BODY MEDIA, LLC)
- WBIS (1190 AM; 50 kW; ANNAPOLIS, MD; Owner: NATIONS RADIO, LLC)
- WTEM (980 AM; 50 kW; WASHINGTON, DC; Owner: AMFM RADIO LICENSES, L.L.C.)
- WPGC (1580 AM; 50 kW; MORNINGSIDE, MD; Owner: INFINITY WPGC(AM), INC.)
- WCBM (680 AM; 50 kW; BALTIMORE, MD; Owner: WCBM MARYLAND, INC.)
- WTOP (1500 AM; 50 kW; WASHINGTON, DC; Owner: BONNEVILLE HOLDING COMPANY)
- WBAL (1090 AM; 50 kW; BALTIMORE, MD; Owner: HEARST RADIO, INC.)
- WWLG (1370 AM; 50 kW; BALTIMORE, MD; Owner: M-10 BROADCASTING, INC.)
- WMET (1150 AM; 50 kW; GAITHERSBURG, MD; Owner: BELTWAY ACQUISITION CORPORATION)
- WTAR (850 AM; 50 kW; NORFOLK, VA; Owner: SINCLAIR COMMUNICATIONS)
- WRVA (1140 AM; 50 kW; RICHMOND, VA; Owner: CLEAR CHANNEL BROADCASTING LICENSES, INC.)
- WGOP (700 AM; daytime; 25 kW; WALKERSVILLE, MD; Owner: BIRACH BROADCASTING CORPORATION)
Strongest FM radio stations in Chesapeake Ranch Estates-Drum Point:
- WMDM-FM (97.7 FM; LEXINGTON PARK, MD; Owner: SOMAR COMMUNICATIONS, INC.)
- WKIK-FM (102.9 FM; CALIFORNIA, MD; Owner: SOMAR COMMUNICATIONS, INC.)
- WBZS-FM (92.7 FM; PRINCE FREDERICK, MD; Owner: MEGA COMMUNICATIONS OF PRINCE FREDERICK LICENSEE, LLC)
- WWZZ (104.1 FM; WALDORF, MD; Owner: BONNEVILLE HOLDING COMPANY)
- WSMD-FM (98.3 FM; MECHANICSVILLE, MD; Owner: SOMAR COMMUNICATIONS, INC.)
- WCEM-FM (106.3 FM; CAMBRIDGE, MD; Owner: MTS BROADCASTING L.C.)
- W201CG (88.1 FM; LEXINGTON PARK, MD; Owner: GRACE MISSIONARY BAPTIST CHURCH)
TV broadcast stations around Chesapeake Ranch Estates-Drum Point:
- WIAV-LP (Channel 58; WASHINGTON, DC; Owner: ASIAVISION, INC.)
- WMDT (Channel 47; SALISBURY, MD; Owner: DELMARVA BROADCAST SERVICE GENERAL PARTNERSHIP)
- WBOC-TV (Channel 16; SALISBURY, MD; Owner: WBOC, INC.)
- W52AX (Channel 52; LEONARDTOWN, MD; Owner: SATELLITE VIDEO BROADCASTING)
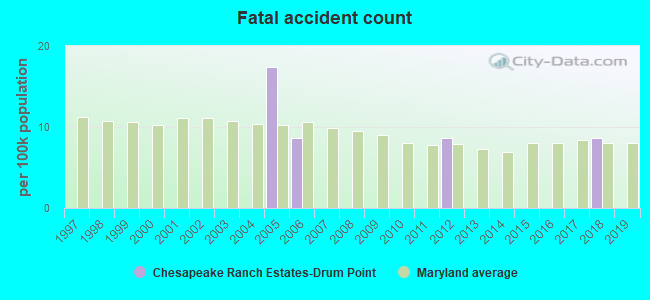
Chesapeake Ranch Estates-Drum Point fatal accident list:
Oct 28, 2018 10:07 PM, Cr-1322, Lat: 38.355253, Lon: -76.414683, Vehicles: 1, Persons: 1, Fatalities: 1, Drunk persons involved: 1
Sep 12, 2012 08:29 PM, Cr-1472, Lat: 38.377247, Lon: -76.422328, Vehicles: 1, Persons: 2, Fatalities: 1, Drunk persons involved: 1
Mar 27, 2006 04:04 PM, Sr-760, Op-225, Lat: 38.334790, Lon: -76.427870, Vehicles: 2, Persons: 3, Fatalities: 2
Sep 18, 2005 05:38 PM, Op-396, Op-399, Lat: 38.366890, Lon: -76.411730, Vehicles: 1, Persons: 1, Fatalities: 1, Drunk persons involved: 1
Nov 12, 2005 00:49 AM, Op-688, Op-347, Lat: 38.375260, Lon: -76.417850, Vehicles: 1, Persons: 2, Fatalities: 1, Drunk persons involved: 1
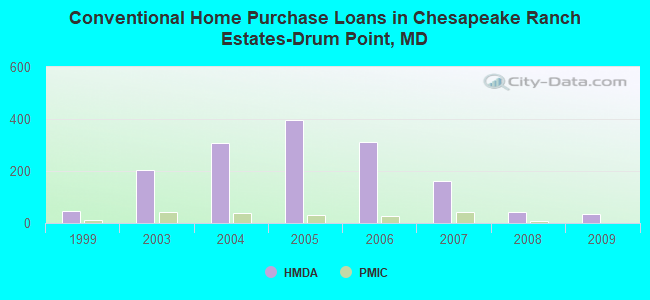
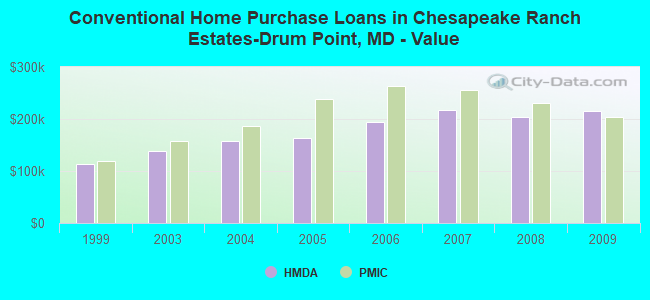
| Home Mortgage Disclosure Act Aggregated Statistics For Year 2009 (Based on 1 partial tract) | ||||||||||||
| A) FHA, FSA/RHS & VA Home Purchase Loans | B) Conventional Home Purchase Loans | C) Refinancings | D) Home Improvement Loans | F) Non-occupant Loans on < 5 Family Dwellings (A B C & D) | G) Loans On Manufactured Home Dwelling (A B C & D) | |||||||
|---|---|---|---|---|---|---|---|---|---|---|---|---|
| Number | Average Value | Number | Average Value | Number | Average Value | Number | Average Value | Number | Average Value | Number | Average Value | |
| LOANS ORIGINATED | 107 | $220,332 | 33 | $214,957 | 292 | $225,827 | 17 | $81,714 | 21 | $212,472 | 1 | $115,660 |
| APPLICATIONS APPROVED, NOT ACCEPTED | 1 | $161,160 | 0 | $0 | 18 | $232,857 | 3 | $73,523 | 1 | $255,960 | 0 | $0 |
| APPLICATIONS DENIED | 11 | $205,055 | 4 | $249,165 | 102 | $235,067 | 13 | $83,229 | 10 | $236,621 | 1 | $331,170 |
| APPLICATIONS WITHDRAWN | 10 | $202,935 | 1 | $298,940 | 60 | $237,758 | 4 | $123,398 | 6 | $251,642 | 0 | $0 |
| FILES CLOSED FOR INCOMPLETENESS | 3 | $129,140 | 1 | $62,570 | 20 | $232,987 | 4 | $122,135 | 3 | $176,540 | 0 | $0 |
Detailed HMDA statistics for the following Tracts: 8610.02
| Private Mortgage Insurance Companies Aggregated Statistics For Year 2009 (Based on 1 partial tract) | ||||
| A) Conventional Home Purchase Loans | B) Refinancings | |||
|---|---|---|---|---|
| Number | Average Value | Number | Average Value | |
| LOANS ORIGINATED | 1 | $204,140 | 6 | $298,093 |
| APPLICATIONS APPROVED, NOT ACCEPTED | 1 | $151,050 | 4 | $300,990 |
| APPLICATIONS DENIED | 1 | $154,840 | 0 | $0 |
| APPLICATIONS WITHDRAWN | 0 | $0 | 0 | $0 |
| FILES CLOSED FOR INCOMPLETENESS | 1 | $135,880 | 0 | $0 |
Detailed PMIC statistics for the following Tracts: 8610.02
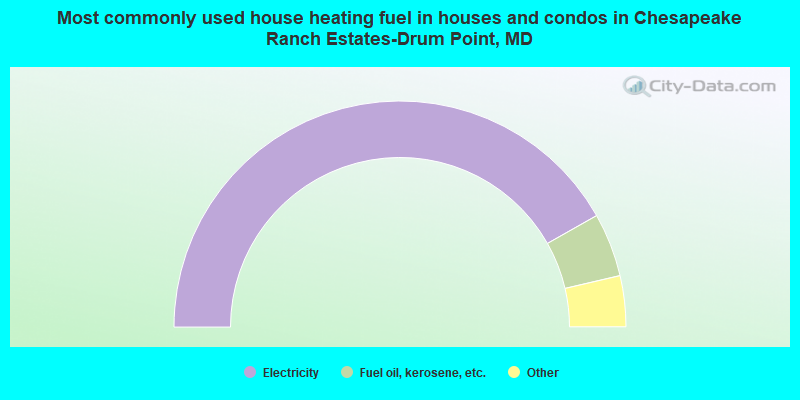
- 83.6%Electricity
- 9.1%Fuel oil, kerosene, etc.
- 3.2%Wood
- 3.0%Bottled, tank, or LP gas
- 0.5%Other fuel
- 0.3%Utility gas
- 0.3%Solar energy
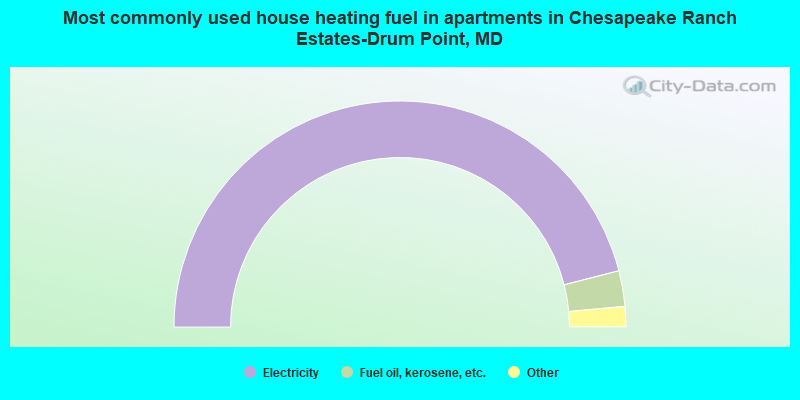
- 92.0%Electricity
- 5.1%Fuel oil, kerosene, etc.
- 1.6%Utility gas
- 1.4%Bottled, tank, or LP gas
Chesapeake Ranch Estates-Drum Point compared to Maryland state average:
- Unemployed percentage significantly below state average.
- Black race population percentage below state average.
- Hispanic race population percentage significantly below state average.
- Foreign-born population percentage significantly below state average.
- Renting percentage significantly below state average.
- Length of stay since moving in significantly above state average.
- Number of rooms per house significantly below state average.
- House age significantly below state average.
Chesapeake Ranch Estates-Drum Point on our top lists:
- #4 on the list of "Top 101 cities with largest percentage of females in industries: alcoholic beverages merchant wholesalers (population 5,000+)"
- #6 on the list of "Top 101 cities with largest percentage of males in industries: utilities (population 5,000+)"
- #19 on the list of "Top 101 cities with largest percentage of females in occupations: secretaries and administrative assistants (population 5,000+)"
- #19 on the list of "Top 101 cities with largest percentage of workers with very long commute times (90 or more minutes) (population 5,000+)"
- #21 on the list of "Top 100 cities with longest commuting times (pop. 5,000+)"
- #29 on the list of "Top 101 cities with largest percentage of females in occupations: plant and system operators (population 5,000+)"
- #31 on the list of "Top 101 cities with largest percentage of females in occupations: other protective service workers including supervisors (population 5,000+)"
- #36 on the list of "Top 101 cities that people commute from (largest negative percentage daily daytime population change due to commuting) (population 5,000+)"
- #37 on the list of "Top 101 cities with largest percentage of males in occupations: therapists (population 5,000+)"
- #43 on the list of "Top 101 cities with largest percentage of males in occupations: engineers (population 5,000+)"
- #44 on the list of "Top 101 cities with largest percentage of females in occupations: air transportation workers (population 5,000+)"
- #64 on the list of "Top 101 cities with the largest percentage of one, detached housing units in structures (2,000+ housing units)"
- #65 on the list of "Top 101 cities with largest percentage of females in industries: other transportation, and support activities, and couriers (population 5,000+)"
- #74 on the list of "Top 101 cities with largest percentage of females in industries: construction (population 5,000+)"
- #85 on the list of "Top 101 cities with largest percentage of females in industries: religious, grantmaking, civic, professional, and similar organizations (population 5,000+)"
- #86 on the list of "Top 101 cities with largest percentage of females in industries: other direct selling establishments (population 5,000+)"
- #90 on the list of "Top 101 cities with largest percentage of females in industries: furniture and home furnishing merchant wholesalers (population 5,000+)"
- #98 on the list of "Top 101 cities with largest percentage of males in industries: other transportation, and support activities, and couriers (population 5,000+)"
- #34 on the list of "Top 101 counties with the lowest total withdrawal of fresh water for public supply (pop. 50,000+)"
- #80 on the list of "Top 101 counties with the highest percentage of residents that visited a dentist within the past year"
- #95 on the list of "Top 101 counties with the largest number of children under 18 without health insurance coverage in 2000 (pop. 50,000+)"
- #100 on the list of "Top 101 counties with the highest percentage of residents relocating from foreign countries between 2010 and 2011 (pop. 50,000+)"