Cloverly, Maryland Submit your own pictures of this place and show them to the world
OSM Map
General Map
Google Map
MSN Map
OSM Map
General Map
Google Map
MSN Map
OSM Map
General Map
Google Map
MSN Map
OSM Map
General Map
Google Map
MSN Map
Please wait while loading the map...
Population in 2010: 15,126. Population change since 2000: +93.1%Males: 7,690 Females: 7,436
March 2022 cost of living index in Cloverly: 173.0 (very high, U.S. average is 100) Percentage of residents living in poverty in 2022: 3.3%for White Non-Hispanic residents , 4.6% for Black residents )Business Search - 14 Million verified businesses
Data:
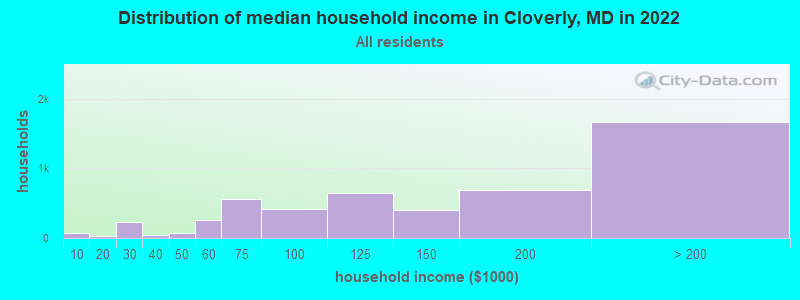
Median household income ($)
Median household income (% change since 2000)
Household income diversity
Ratio of average income to average house value (%)
Ratio of average income to average rent
Median household income ($) - White
Median household income ($) - Black or African American
Median household income ($) - Asian
Median household income ($) - Hispanic or Latino
Median household income ($) - American Indian and Alaska Native
Median household income ($) - Multirace
Median household income ($) - Other Race
Median household income for houses/condos with a mortgage ($)
Median household income for apartments without a mortgage ($)
Races - White alone (%)
Races - White alone (% change since 2000)
Races - Black alone (%)
Races - Black alone (% change since 2000)
Races - American Indian alone (%)
Races - American Indian alone (% change since 2000)
Races - Asian alone (%)
Races - Asian alone (% change since 2000)
Races - Hispanic (%)
Races - Hispanic (% change since 2000)
Races - Native Hawaiian and Other Pacific Islander alone (%)
Races - Native Hawaiian and Other Pacific Islander alone (% change since 2000)
Races - Two or more races (%)
Races - Two or more races (% change since 2000)
Races - Other race alone (%)
Races - Other race alone (% change since 2000)
Racial diversity
Unemployment (%)
Unemployment (% change since 2000)
Unemployment (%) - White
Unemployment (%) - Black or African American
Unemployment (%) - Asian
Unemployment (%) - Hispanic or Latino
Unemployment (%) - American Indian and Alaska Native
Unemployment (%) - Multirace
Unemployment (%) - Other Race
Population density (people per square mile)
Population - Males (%)
Population - Females (%)
Population - Males (%) - White
Population - Males (%) - Black or African American
Population - Males (%) - Asian
Population - Males (%) - Hispanic or Latino
Population - Males (%) - American Indian and Alaska Native
Population - Males (%) - Multirace
Population - Males (%) - Other Race
Population - Females (%) - White
Population - Females (%) - Black or African American
Population - Females (%) - Asian
Population - Females (%) - Hispanic or Latino
Population - Females (%) - American Indian and Alaska Native
Population - Females (%) - Multirace
Population - Females (%) - Other Race
Coronavirus confirmed cases (Apr 25, 2024)
Deaths caused by coronavirus (Apr 25, 2024)
Coronavirus confirmed cases (per 100k population) (Apr 25, 2024)
Deaths caused by coronavirus (per 100k population) (Apr 25, 2024)
Daily increase in number of cases (Apr 25, 2024)
Weekly increase in number of cases (Apr 25, 2024)
Cases doubled (in days) (Apr 25, 2024)
Hospitalized patients (Apr 18, 2022)
Negative test results (Apr 18, 2022)
Total test results (Apr 18, 2022)
COVID Vaccine doses distributed (per 100k population) (Sep 19, 2023)
COVID Vaccine doses administered (per 100k population) (Sep 19, 2023)
COVID Vaccine doses distributed (Sep 19, 2023)
COVID Vaccine doses administered (Sep 19, 2023)
Likely homosexual households (%)
Likely homosexual households (% change since 2000)
Likely homosexual households - Lesbian couples (%)
Likely homosexual households - Lesbian couples (% change since 2000)
Likely homosexual households - Gay men (%)
Likely homosexual households - Gay men (% change since 2000)
Cost of living index
Median gross rent ($)
Median contract rent ($)
Median monthly housing costs ($)
Median house or condo value ($)
Median house or condo value ($ change since 2000)
Mean house or condo value by units in structure - 1, detached ($)
Mean house or condo value by units in structure - 1, attached ($)
Mean house or condo value by units in structure - 2 ($)
Mean house or condo value by units in structure by units in structure - 3 or 4 ($)
Mean house or condo value by units in structure - 5 or more ($)
Mean house or condo value by units in structure - Boat, RV, van, etc. ($)
Mean house or condo value by units in structure - Mobile home ($)
Median house or condo value ($) - White
Median house or condo value ($) - Black or African American
Median house or condo value ($) - Asian
Median house or condo value ($) - Hispanic or Latino
Median house or condo value ($) - American Indian and Alaska Native
Median house or condo value ($) - Multirace
Median house or condo value ($) - Other Race
Median resident age
Resident age diversity
Median resident age - Males
Median resident age - Females
Median resident age - White
Median resident age - Black or African American
Median resident age - Asian
Median resident age - Hispanic or Latino
Median resident age - American Indian and Alaska Native
Median resident age - Multirace
Median resident age - Other Race
Median resident age - Males - White
Median resident age - Males - Black or African American
Median resident age - Males - Asian
Median resident age - Males - Hispanic or Latino
Median resident age - Males - American Indian and Alaska Native
Median resident age - Males - Multirace
Median resident age - Males - Other Race
Median resident age - Females - White
Median resident age - Females - Black or African American
Median resident age - Females - Asian
Median resident age - Females - Hispanic or Latino
Median resident age - Females - American Indian and Alaska Native
Median resident age - Females - Multirace
Median resident age - Females - Other Race
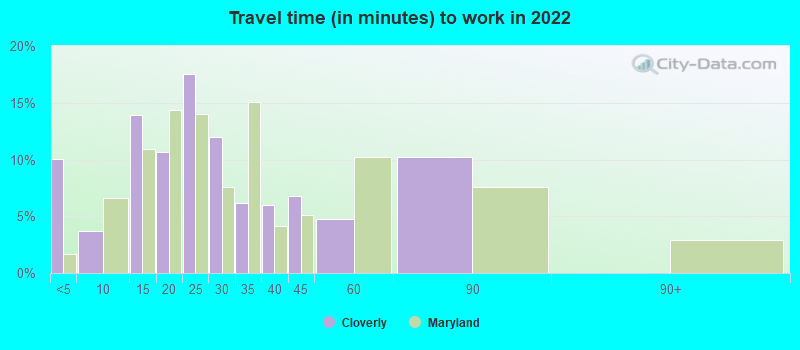
Commute - mean travel time to work (minutes)
Travel time to work - Less than 5 minutes (%)
Travel time to work - Less than 5 minutes (% change since 2000)
Travel time to work - 5 to 9 minutes (%)
Travel time to work - 5 to 9 minutes (% change since 2000)
Travel time to work - 10 to 19 minutes (%)
Travel time to work - 10 to 19 minutes (% change since 2000)
Travel time to work - 20 to 29 minutes (%)
Travel time to work - 20 to 29 minutes (% change since 2000)
Travel time to work - 30 to 39 minutes (%)
Travel time to work - 30 to 39 minutes (% change since 2000)
Travel time to work - 40 to 59 minutes (%)
Travel time to work - 40 to 59 minutes (% change since 2000)
Travel time to work - 60 to 89 minutes (%)
Travel time to work - 60 to 89 minutes (% change since 2000)
Travel time to work - 90 or more minutes (%)
Travel time to work - 90 or more minutes (% change since 2000)
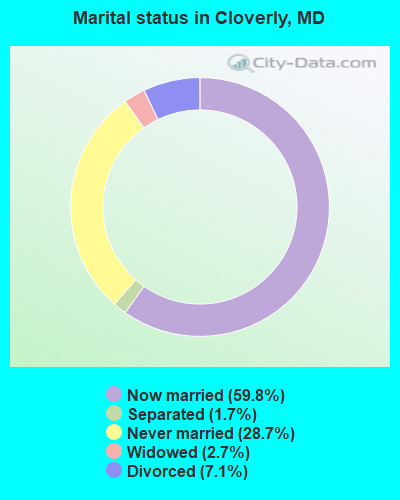
Marital status - Never married (%)
Marital status - Now married (%)
Marital status - Separated (%)
Marital status - Widowed (%)
Marital status - Divorced (%)
Median family income ($)
Median family income (% change since 2000)
Median non-family income ($)
Median non-family income (% change since 2000)
Median per capita income ($)
Median per capita income (% change since 2000)
Median family income ($) - White
Median family income ($) - Black or African American
Median family income ($) - Asian
Median family income ($) - Hispanic or Latino
Median family income ($) - American Indian and Alaska Native
Median family income ($) - Multirace
Median family income ($) - Other Race
Median year house/condo built
Median year apartment built
Year house built - Built 2005 or later (%)
Year house built - Built 2000 to 2004 (%)
Year house built - Built 1990 to 1999 (%)
Year house built - Built 1980 to 1989 (%)
Year house built - Built 1970 to 1979 (%)
Year house built - Built 1960 to 1969 (%)
Year house built - Built 1950 to 1959 (%)
Year house built - Built 1940 to 1949 (%)
Year house built - Built 1939 or earlier (%)
Average household size
Household density (households per square mile)
Average household size - White
Average household size - Black or African American
Average household size - Asian
Average household size - Hispanic or Latino
Average household size - American Indian and Alaska Native
Average household size - Multirace
Average household size - Other Race
Occupied housing units (%)
Vacant housing units (%)
Owner occupied housing units (%)
Renter occupied housing units (%)
Vacancy status - For rent (%)
Vacancy status - For sale only (%)
Vacancy status - Rented or sold, not occupied (%)
Vacancy status - For seasonal, recreational, or occasional use (%)
Vacancy status - For migrant workers (%)
Vacancy status - Other vacant (%)
Residents with income below the poverty level (%)
Residents with income below 50% of the poverty level (%)
Children below poverty level (%)
Poor families by family type - Married-couple family (%)
Poor families by family type - Male, no wife present (%)
Poor families by family type - Female, no husband present (%)
Poverty status for native-born residents (%)
Poverty status for foreign-born residents (%)
Poverty among high school graduates not in families (%)
Poverty among people who did not graduate high school not in families (%)
Residents with income below the poverty level (%) - White
Residents with income below the poverty level (%) - Black or African American
Residents with income below the poverty level (%) - Asian
Residents with income below the poverty level (%) - Hispanic or Latino
Residents with income below the poverty level (%) - American Indian and Alaska Native
Residents with income below the poverty level (%) - Multirace
Residents with income below the poverty level (%) - Other Race
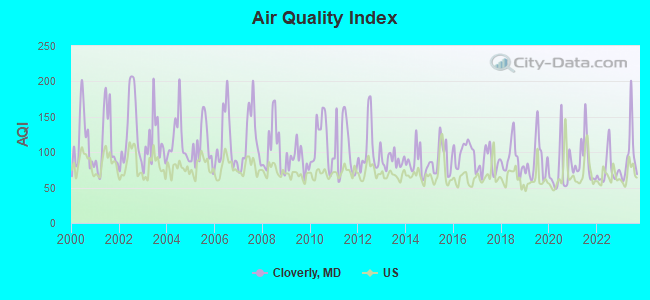
Air pollution - Air Quality Index (AQI)
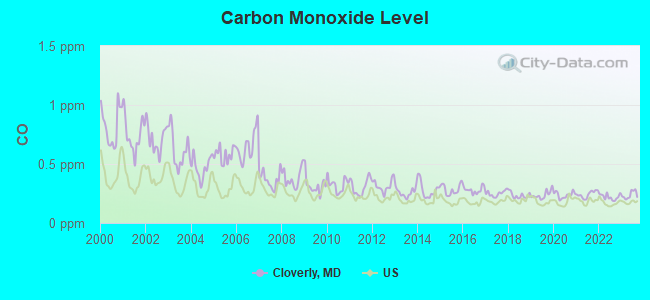
Air pollution - CO
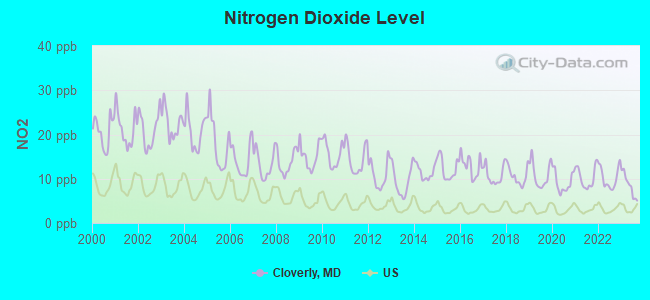
Air pollution - NO2
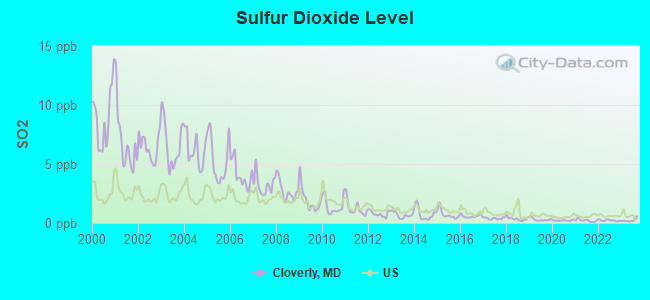
Air pollution - SO2
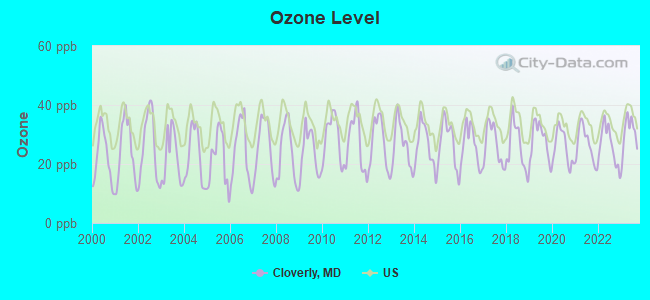
Air pollution - Ozone
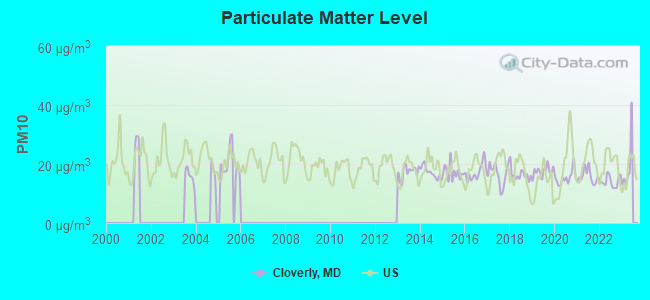
Air pollution - PM10
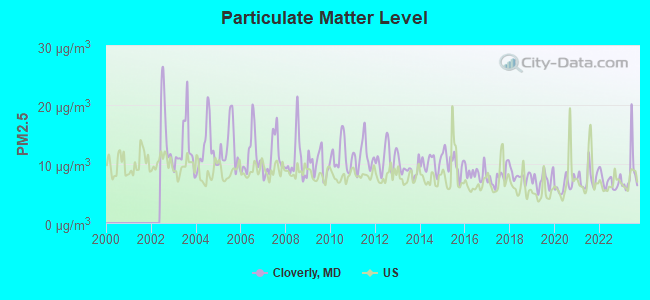
Air pollution - PM25
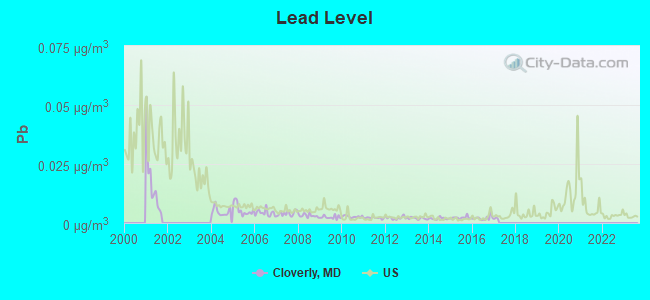
Air pollution - Pb
Crime - Murders per 100,000 population
Crime - Rapes per 100,000 population
Crime - Robberies per 100,000 population
Crime - Assaults per 100,000 population
Crime - Burglaries per 100,000 population
Crime - Thefts per 100,000 population
Crime - Auto thefts per 100,000 population
Crime - Arson per 100,000 population
Crime - City-data.com crime index
Crime - Violent crime index
Crime - Property crime index
Crime - Murders per 100,000 population (5 year average)
Crime - Rapes per 100,000 population (5 year average)
Crime - Robberies per 100,000 population (5 year average)
Crime - Assaults per 100,000 population (5 year average)
Crime - Burglaries per 100,000 population (5 year average)
Crime - Thefts per 100,000 population (5 year average)
Crime - Auto thefts per 100,000 population (5 year average)
Crime - Arson per 100,000 population (5 year average)
Crime - City-data.com crime index (5 year average)
Crime - Violent crime index (5 year average)
Crime - Property crime index (5 year average)
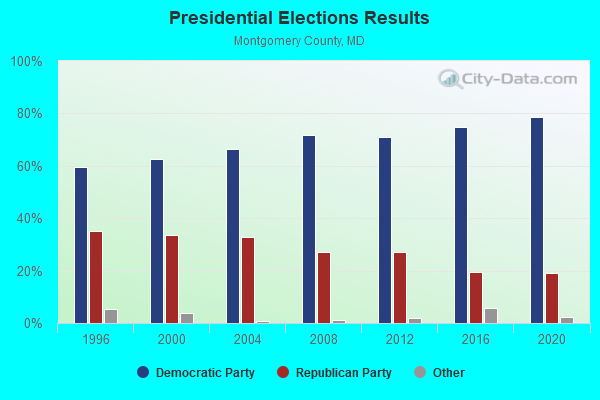
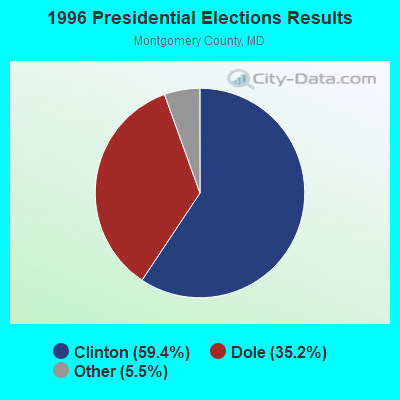
1996 Presidential Elections Results (%) - Democratic Party (Clinton)
1996 Presidential Elections Results (%) - Republican Party (Dole)
1996 Presidential Elections Results (%) - Other
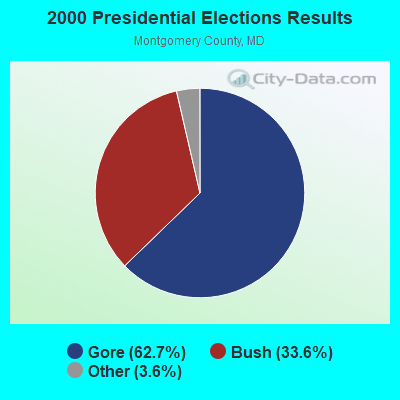
2000 Presidential Elections Results (%) - Democratic Party (Gore)
2000 Presidential Elections Results (%) - Republican Party (Bush)
2000 Presidential Elections Results (%) - Other
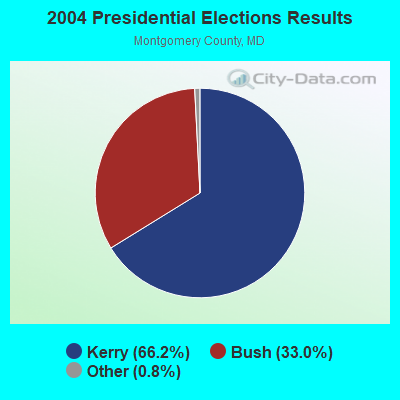
2004 Presidential Elections Results (%) - Democratic Party (Kerry)
2004 Presidential Elections Results (%) - Republican Party (Bush)
2004 Presidential Elections Results (%) - Other
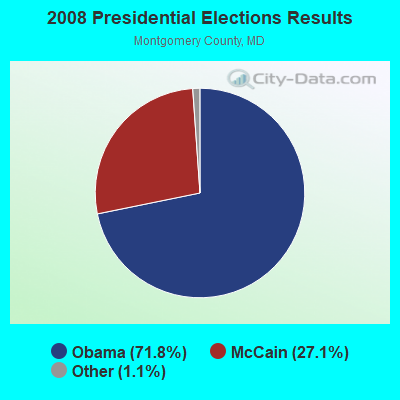
2008 Presidential Elections Results (%) - Democratic Party (Obama)
2008 Presidential Elections Results (%) - Republican Party (McCain)
2008 Presidential Elections Results (%) - Other
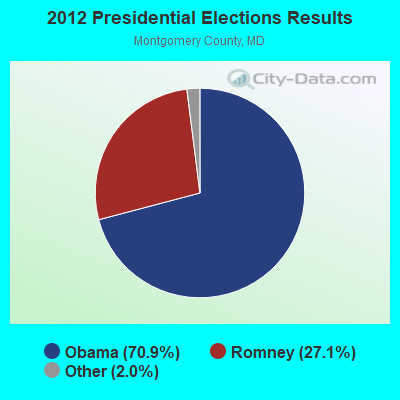
2012 Presidential Elections Results (%) - Democratic Party (Obama)
2012 Presidential Elections Results (%) - Republican Party (Romney)
2012 Presidential Elections Results (%) - Other
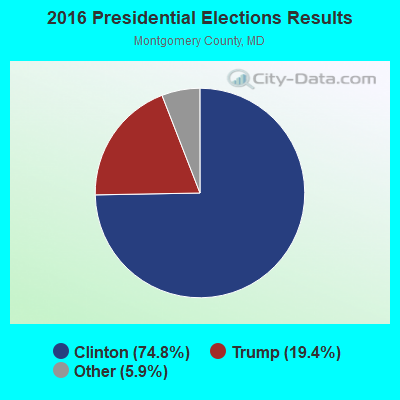
2016 Presidential Elections Results (%) - Democratic Party (Clinton)
2016 Presidential Elections Results (%) - Republican Party (Trump)
2016 Presidential Elections Results (%) - Other
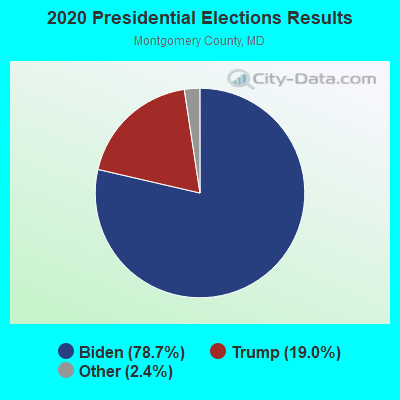
2020 Presidential Elections Results (%) - Democratic Party (Biden)
2020 Presidential Elections Results (%) - Republican Party (Trump)
2020 Presidential Elections Results (%) - Other
Ancestries Reported - Arab (%)
Ancestries Reported - Czech (%)
Ancestries Reported - Danish (%)
Ancestries Reported - Dutch (%)
Ancestries Reported - English (%)
Ancestries Reported - French (%)
Ancestries Reported - French Canadian (%)
Ancestries Reported - German (%)
Ancestries Reported - Greek (%)
Ancestries Reported - Hungarian (%)
Ancestries Reported - Irish (%)
Ancestries Reported - Italian (%)
Ancestries Reported - Lithuanian (%)
Ancestries Reported - Norwegian (%)
Ancestries Reported - Polish (%)
Ancestries Reported - Portuguese (%)
Ancestries Reported - Russian (%)
Ancestries Reported - Scotch-Irish (%)
Ancestries Reported - Scottish (%)
Ancestries Reported - Slovak (%)
Ancestries Reported - Subsaharan African (%)
Ancestries Reported - Swedish (%)
Ancestries Reported - Swiss (%)
Ancestries Reported - Ukrainian (%)
Ancestries Reported - United States (%)
Ancestries Reported - Welsh (%)
Ancestries Reported - West Indian (%)
Ancestries Reported - Other (%)
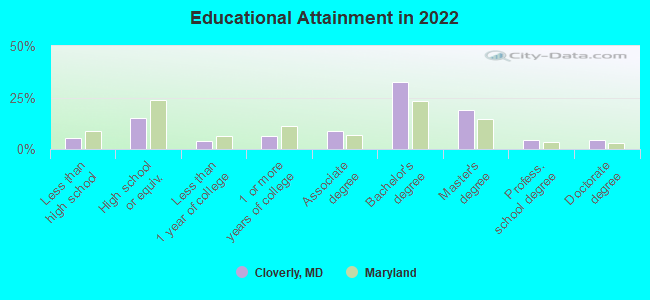
Educational Attainment - No schooling completed (%)
Educational Attainment - Less than high school (%)
Educational Attainment - High school or equivalent (%)
Educational Attainment - Less than 1 year of college (%)
Educational Attainment - 1 or more years of college (%)
Educational Attainment - Associate degree (%)
Educational Attainment - Bachelor's degree (%)
Educational Attainment - Master's degree (%)
Educational Attainment - Professional school degree (%)
Educational Attainment - Doctorate degree (%)
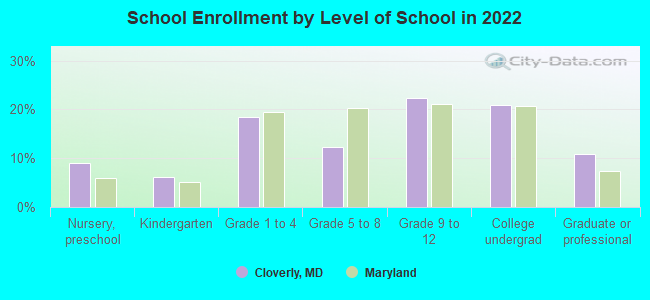
School Enrollment - Nursery, preschool (%)
School Enrollment - Kindergarten (%)
School Enrollment - Grade 1 to 4 (%)
School Enrollment - Grade 5 to 8 (%)
School Enrollment - Grade 9 to 12 (%)
School Enrollment - College undergrad (%)
School Enrollment - Graduate or professional (%)
School Enrollment - Not enrolled in school (%)
School enrollment - Public schools (%)
School enrollment - Private schools (%)
School enrollment - Not enrolled (%)
Median number of rooms in houses and condos
Median number of rooms in apartments
Housing units lacking complete plumbing facilities (%)
Housing units lacking complete kitchen facilities (%)
Density of houses
Urban houses (%)
Rural houses (%)
Households with people 60 years and over (%)
Households with people 65 years and over (%)
Households with people 75 years and over (%)
Households with one or more nonrelatives (%)
Households with no nonrelatives (%)
Population in households (%)
Family households (%)
Nonfamily households (%)
Population in families (%)
Family households with own children (%)
Median number of bedrooms in owner occupied houses
Mean number of bedrooms in owner occupied houses
Median number of bedrooms in renter occupied houses
Mean number of bedrooms in renter occupied houses
Median number of vehichles in owner occupied houses
Mean number of vehichles in owner occupied houses
Median number of vehichles in renter occupied houses
Mean number of vehichles in renter occupied houses
Mortgage status - with mortgage (%)
Mortgage status - with second mortgage (%)
Mortgage status - with home equity loan (%)
Mortgage status - with both second mortgage and home equity loan (%)
Mortgage status - without a mortgage (%)
Average family size
Average family size - White
Average family size - Black or African American
Average family size - Asian
Average family size - Hispanic or Latino
Average family size - American Indian and Alaska Native
Average family size - Multirace
Average family size - Other Race
Geographical mobility - Same house 1 year ago (%)
Geographical mobility - Moved within same county (%)
Geographical mobility - Moved from different county within same state (%)
Geographical mobility - Moved from different state (%)
Geographical mobility - Moved from abroad (%)
Place of birth - Born in state of residence (%)
Place of birth - Born in other state (%)
Place of birth - Native, outside of US (%)
Place of birth - Foreign born (%)
Housing units in structures - 1, detached (%)
Housing units in structures - 1, attached (%)
Housing units in structures - 2 (%)
Housing units in structures - 3 or 4 (%)
Housing units in structures - 5 to 9 (%)
Housing units in structures - 10 to 19 (%)
Housing units in structures - 20 to 49 (%)
Housing units in structures - 50 or more (%)
Housing units in structures - Mobile home (%)
Housing units in structures - Boat, RV, van, etc. (%)
House/condo owner moved in on average (years ago)
Renter moved in on average (years ago)
Year householder moved into unit - Moved in 1999 to March 2000 (%)
Year householder moved into unit - Moved in 1995 to 1998 (%)
Year householder moved into unit - Moved in 1990 to 1994 (%)
Year householder moved into unit - Moved in 1980 to 1989 (%)
Year householder moved into unit - Moved in 1970 to 1979 (%)
Year householder moved into unit - Moved in 1969 or earlier (%)
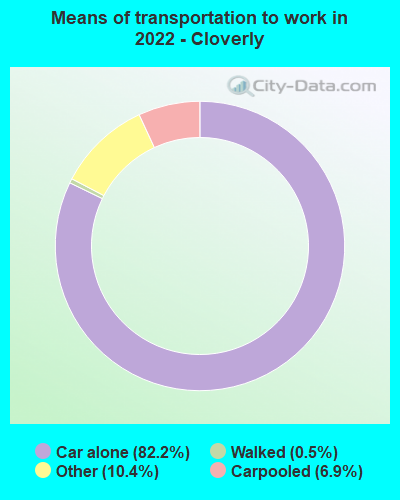
Means of transportation to work - Drove car alone (%)
Means of transportation to work - Carpooled (%)
Means of transportation to work - Public transportation (%)
Means of transportation to work - Bus or trolley bus (%)
Means of transportation to work - Streetcar or trolley car (%)
Means of transportation to work - Subway or elevated (%)
Means of transportation to work - Railroad (%)
Means of transportation to work - Ferryboat (%)
Means of transportation to work - Taxicab (%)
Means of transportation to work - Motorcycle (%)
Means of transportation to work - Bicycle (%)
Means of transportation to work - Walked (%)
Means of transportation to work - Other means (%)
Working at home (%)
Industry diversity
Most Common Industries - Agriculture, forestry, fishing and hunting, and mining (%)
Most Common Industries - Agriculture, forestry, fishing and hunting (%)
Most Common Industries - Mining, quarrying, and oil and gas extraction (%)
Most Common Industries - Construction (%)
Most Common Industries - Manufacturing (%)
Most Common Industries - Wholesale trade (%)
Most Common Industries - Retail trade (%)
Most Common Industries - Transportation and warehousing, and utilities (%)
Most Common Industries - Transportation and warehousing (%)
Most Common Industries - Utilities (%)
Most Common Industries - Information (%)
Most Common Industries - Finance and insurance, and real estate and rental and leasing (%)
Most Common Industries - Finance and insurance (%)
Most Common Industries - Real estate and rental and leasing (%)
Most Common Industries - Professional, scientific, and management, and administrative and waste management services (%)
Most Common Industries - Professional, scientific, and technical services (%)
Most Common Industries - Management of companies and enterprises (%)
Most Common Industries - Administrative and support and waste management services (%)
Most Common Industries - Educational services, and health care and social assistance (%)
Most Common Industries - Educational services (%)
Most Common Industries - Health care and social assistance (%)
Most Common Industries - Arts, entertainment, and recreation, and accommodation and food services (%)
Most Common Industries - Arts, entertainment, and recreation (%)
Most Common Industries - Accommodation and food services (%)
Most Common Industries - Other services, except public administration (%)
Most Common Industries - Public administration (%)
Occupation diversity
Most Common Occupations - Management, business, science, and arts occupations (%)
Most Common Occupations - Management, business, and financial occupations (%)
Most Common Occupations - Management occupations (%)
Most Common Occupations - Business and financial operations occupations (%)
Most Common Occupations - Computer, engineering, and science occupations (%)
Most Common Occupations - Computer and mathematical occupations (%)
Most Common Occupations - Architecture and engineering occupations (%)
Most Common Occupations - Life, physical, and social science occupations (%)
Most Common Occupations - Education, legal, community service, arts, and media occupations (%)
Most Common Occupations - Community and social service occupations (%)
Most Common Occupations - Legal occupations (%)
Most Common Occupations - Education, training, and library occupations (%)
Most Common Occupations - Arts, design, entertainment, sports, and media occupations (%)
Most Common Occupations - Healthcare practitioners and technical occupations (%)
Most Common Occupations - Health diagnosing and treating practitioners and other technical occupations (%)
Most Common Occupations - Health technologists and technicians (%)
Most Common Occupations - Service occupations (%)
Most Common Occupations - Healthcare support occupations (%)
Most Common Occupations - Protective service occupations (%)
Most Common Occupations - Fire fighting and prevention, and other protective service workers including supervisors (%)
Most Common Occupations - Law enforcement workers including supervisors (%)
Most Common Occupations - Food preparation and serving related occupations (%)
Most Common Occupations - Building and grounds cleaning and maintenance occupations (%)
Most Common Occupations - Personal care and service occupations (%)
Most Common Occupations - Sales and office occupations (%)
Most Common Occupations - Sales and related occupations (%)
Most Common Occupations - Office and administrative support occupations (%)
Most Common Occupations - Natural resources, construction, and maintenance occupations (%)
Most Common Occupations - Farming, fishing, and forestry occupations (%)
Most Common Occupations - Construction and extraction occupations (%)
Most Common Occupations - Installation, maintenance, and repair occupations (%)
Most Common Occupations - Production, transportation, and material moving occupations (%)
Most Common Occupations - Production occupations (%)
Most Common Occupations - Transportation occupations (%)
Most Common Occupations - Material moving occupations (%)
People in Group quarters - Institutionalized population (%)
People in Group quarters - Correctional institutions (%)
People in Group quarters - Federal prisons and detention centers (%)
People in Group quarters - Halfway houses (%)
People in Group quarters - Local jails and other confinement facilities (including police lockups) (%)
People in Group quarters - Military disciplinary barracks (%)
People in Group quarters - State prisons (%)
People in Group quarters - Other types of correctional institutions (%)
People in Group quarters - Nursing homes (%)
People in Group quarters - Hospitals/wards, hospices, and schools for the handicapped (%)
People in Group quarters - Hospitals/wards and hospices for chronically ill (%)
People in Group quarters - Hospices or homes for chronically ill (%)
People in Group quarters - Military hospitals or wards for chronically ill (%)
People in Group quarters - Other hospitals or wards for chronically ill (%)
People in Group quarters - Hospitals or wards for drug/alcohol abuse (%)
People in Group quarters - Mental (Psychiatric) hospitals or wards (%)
People in Group quarters - Schools, hospitals, or wards for the mentally retarded (%)
People in Group quarters - Schools, hospitals, or wards for the physically handicapped (%)
People in Group quarters - Institutions for the deaf (%)
People in Group quarters - Institutions for the blind (%)
People in Group quarters - Orthopedic wards and institutions for the physically handicapped (%)
People in Group quarters - Wards in general hospitals for patients who have no usual home elsewhere (%)
People in Group quarters - Wards in military hospitals for patients who have no usual home elsewhere (%)
People in Group quarters - Juvenile institutions (%)
People in Group quarters - Long-term care (%)
People in Group quarters - Homes for abused, dependent, and neglected children (%)
People in Group quarters - Residential treatment centers for emotionally disturbed children (%)
People in Group quarters - Training schools for juvenile delinquents (%)
People in Group quarters - Short-term care, detention or diagnostic centers for delinquent children (%)
People in Group quarters - Type of juvenile institution unknown (%)
People in Group quarters - Noninstitutionalized population (%)
People in Group quarters - College dormitories (includes college quarters off campus) (%)
People in Group quarters - Military quarters (%)
People in Group quarters - On base (%)
People in Group quarters - Barracks, unaccompanied personnel housing (UPH), (Enlisted/Officer), ;and similar group living quarters for military personnel (%)
People in Group quarters - Transient quarters for temporary residents (%)
People in Group quarters - Military ships (%)
People in Group quarters - Group homes (%)
People in Group quarters - Homes or halfway houses for drug/alcohol abuse (%)
People in Group quarters - Homes for the mentally ill (%)
People in Group quarters - Homes for the mentally retarded (%)
People in Group quarters - Homes for the physically handicapped (%)
People in Group quarters - Other group homes (%)
People in Group quarters - Religious group quarters (%)
People in Group quarters - Dormitories (%)
People in Group quarters - Agriculture workers' dormitories on farms (%)
People in Group quarters - Job Corps and vocational training facilities (%)
People in Group quarters - Other workers' dormitories (%)
People in Group quarters - Crews of maritime vessels (%)
People in Group quarters - Other nonhousehold living situations (%)
People in Group quarters - Other noninstitutional group quarters (%)
Residents speaking English at home (%)
Residents speaking English at home - Born in the United States (%)
Residents speaking English at home - Native, born elsewhere (%)
Residents speaking English at home - Foreign born (%)
Residents speaking Spanish at home (%)
Residents speaking Spanish at home - Born in the United States (%)
Residents speaking Spanish at home - Native, born elsewhere (%)
Residents speaking Spanish at home - Foreign born (%)
Residents speaking other language at home (%)
Residents speaking other language at home - Born in the United States (%)
Residents speaking other language at home - Native, born elsewhere (%)
Residents speaking other language at home - Foreign born (%)
Class of Workers - Employee of private company (%)
Class of Workers - Self-employed in own incorporated business (%)
Class of Workers - Private not-for-profit wage and salary workers (%)
Class of Workers - Local government workers (%)
Class of Workers - State government workers (%)
Class of Workers - Federal government workers (%)
Class of Workers - Self-employed workers in own not incorporated business and Unpaid family workers (%)
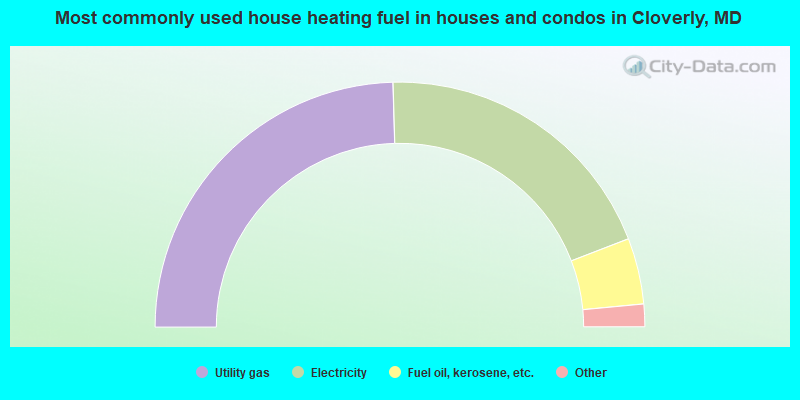
House heating fuel used in houses and condos - Utility gas (%)
House heating fuel used in houses and condos - Bottled, tank, or LP gas (%)
House heating fuel used in houses and condos - Electricity (%)
House heating fuel used in houses and condos - Fuel oil, kerosene, etc. (%)
House heating fuel used in houses and condos - Coal or coke (%)
House heating fuel used in houses and condos - Wood (%)
House heating fuel used in houses and condos - Solar energy (%)
House heating fuel used in houses and condos - Other fuel (%)
House heating fuel used in houses and condos - No fuel used (%)
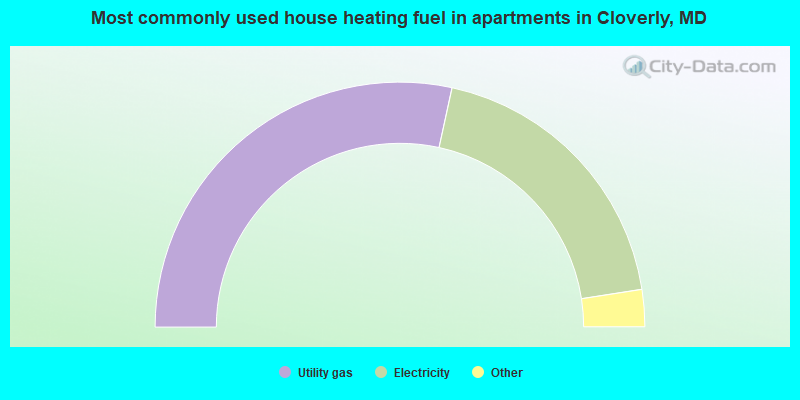
House heating fuel used in apartments - Utility gas (%)
House heating fuel used in apartments - Bottled, tank, or LP gas (%)
House heating fuel used in apartments - Electricity (%)
House heating fuel used in apartments - Fuel oil, kerosene, etc. (%)
House heating fuel used in apartments - Coal or coke (%)
House heating fuel used in apartments - Wood (%)
House heating fuel used in apartments - Solar energy (%)
House heating fuel used in apartments - Other fuel (%)
House heating fuel used in apartments - No fuel used (%)
Armed forces status - In Armed Forces (%)
Armed forces status - Civilian (%)
Armed forces status - Civilian - Veteran (%)
Armed forces status - Civilian - Nonveteran (%)
Fatal accidents locations in years 2005-2021
Fatal accidents locations in 2005
Fatal accidents locations in 2006
Fatal accidents locations in 2007
Fatal accidents locations in 2008
Fatal accidents locations in 2009
Fatal accidents locations in 2010
Fatal accidents locations in 2011
Fatal accidents locations in 2012
Fatal accidents locations in 2013
Fatal accidents locations in 2014
Fatal accidents locations in 2015
Fatal accidents locations in 2016
Fatal accidents locations in 2017
Fatal accidents locations in 2018
Fatal accidents locations in 2019
Fatal accidents locations in 2020
Fatal accidents locations in 2021
Alcohol use - People drinking some alcohol every month (%)
Alcohol use - People not drinking at all (%)
Alcohol use - Average days/month drinking alcohol
Alcohol use - Average drinks/week
Alcohol use - Average days/year people drink much
Audiometry - Average condition of hearing (%)
Audiometry - People that can hear a whisper from across a quiet room (%)
Audiometry - People that can hear normal voice from across a quiet room (%)
Audiometry - Ears ringing, roaring, buzzing (%)
Audiometry - Had a job exposure to loud noise (%)
Audiometry - Had off-work exposure to loud noise (%)
Blood Pressure & Cholesterol - Has high blood pressure (%)
Blood Pressure & Cholesterol - Checking blood pressure at home (%)
Blood Pressure & Cholesterol - Frequently checking blood cholesterol (%)
Blood Pressure & Cholesterol - Has high cholesterol level (%)
Consumer Behavior - Money monthly spent on food at supermarket/grocery store
Consumer Behavior - Money monthly spent on food at other stores
Consumer Behavior - Money monthly spent on eating out
Consumer Behavior - Money monthly spent on carryout/delivered foods
Consumer Behavior - Income spent on food at supermarket/grocery store (%)
Consumer Behavior - Income spent on food at other stores (%)
Consumer Behavior - Income spent on eating out (%)
Consumer Behavior - Income spent on carryout/delivered foods (%)
Current Health Status - General health condition (%)
Current Health Status - Blood donors (%)
Current Health Status - Has blood ever tested for HIV virus (%)
Current Health Status - Left-handed people (%)
Dermatology - People using sunscreen (%)
Diabetes - Diabetics (%)
Diabetes - Had a blood test for high blood sugar (%)
Diabetes - People taking insulin (%)
Diet Behavior & Nutrition - Diet health (%)
Diet Behavior & Nutrition - Milk product consumption (# of products/month)
Diet Behavior & Nutrition - Meals not home prepared (#/week)
Diet Behavior & Nutrition - Meals from fast food or pizza place (#/week)
Diet Behavior & Nutrition - Ready-to-eat foods (#/month)
Diet Behavior & Nutrition - Frozen meals/pizza (#/month)
Drug Use - People that ever used marijuana or hashish (%)
Drug Use - Ever used hard drugs (%)
Drug Use - Ever used any form of cocaine (%)
Drug Use - Ever used heroin (%)
Drug Use - Ever used methamphetamine (%)
Health Insurance - People covered by health insurance (%)
Kidney Conditions-Urology - Avg. # of times urinating at night
Medical Conditions - People with asthma (%)
Medical Conditions - People with anemia (%)
Medical Conditions - People with psoriasis (%)
Medical Conditions - People with overweight (%)
Medical Conditions - Elderly people having difficulties in thinking or remembering (%)
Medical Conditions - People who ever received blood transfusion (%)
Medical Conditions - People having trouble seeing even with glass/contacts (%)
Medical Conditions - People with arthritis (%)
Medical Conditions - People with gout (%)
Medical Conditions - People with congestive heart failure (%)
Medical Conditions - People with coronary heart disease (%)
Medical Conditions - People with angina pectoris (%)
Medical Conditions - People who ever had heart attack (%)
Medical Conditions - People who ever had stroke (%)
Medical Conditions - People with emphysema (%)
Medical Conditions - People with thyroid problem (%)
Medical Conditions - People with chronic bronchitis (%)
Medical Conditions - People with any liver condition (%)
Medical Conditions - People who ever had cancer or malignancy (%)
Mental Health - People who have little interest in doing things (%)
Mental Health - People feeling down, depressed, or hopeless (%)
Mental Health - People who have trouble sleeping or sleeping too much (%)
Mental Health - People feeling tired or having little energy (%)
Mental Health - People with poor appetite or overeating (%)
Mental Health - People feeling bad about themself (%)
Mental Health - People who have trouble concentrating on things (%)
Mental Health - People moving or speaking slowly or too fast (%)
Mental Health - People having thoughts they would be better off dead (%)
Oral Health - Average years since last visit a dentist
Oral Health - People embarrassed because of mouth (%)
Oral Health - People with gum disease (%)
Oral Health - General health of teeth and gums (%)
Oral Health - Average days a week using dental floss/device
Oral Health - Average days a week using mouthwash for dental problem
Oral Health - Average number of teeth
Pesticide Use - Households using pesticides to control insects (%)
Pesticide Use - Households using pesticides to kill weeds (%)
Physical Activity - People doing vigorous-intensity work activities (%)
Physical Activity - People doing moderate-intensity work activities (%)
Physical Activity - People walking or bicycling (%)
Physical Activity - People doing vigorous-intensity recreational activities (%)
Physical Activity - People doing moderate-intensity recreational activities (%)
Physical Activity - Average hours a day doing sedentary activities
Physical Activity - Average hours a day watching TV or videos
Physical Activity - Average hours a day using computer
Physical Functioning - People having limitations keeping them from working (%)
Physical Functioning - People limited in amount of work they can do (%)
Physical Functioning - People that need special equipment to walk (%)
Physical Functioning - People experiencing confusion/memory problems (%)
Physical Functioning - People requiring special healthcare equipment (%)
Prescription Medications - Average number of prescription medicines taking
Preventive Aspirin Use - Adults 40+ taking low-dose aspirin (%)
Reproductive Health - Vaginal deliveries (%)
Reproductive Health - Cesarean deliveries (%)
Reproductive Health - Deliveries resulted in a live birth (%)
Reproductive Health - Pregnancies resulted in a delivery (%)
Reproductive Health - Women breastfeeding newborns (%)
Reproductive Health - Women that had a hysterectomy (%)
Reproductive Health - Women that had both ovaries removed (%)
Reproductive Health - Women that have ever taken birth control pills (%)
Reproductive Health - Women taking birth control pills (%)
Reproductive Health - Women that have ever used Depo-Provera or injectables (%)
Reproductive Health - Women that have ever used female hormones (%)
Sexual Behavior - People 18+ that ever had sex (vaginal, anal, or oral) (%)
Sexual Behavior - Males 18+ that ever had vaginal sex with a woman (%)
Sexual Behavior - Males 18+ that ever performed oral sex on a woman (%)
Sexual Behavior - Males 18+ that ever had anal sex with a woman (%)
Sexual Behavior - Males 18+ that ever had any sex with a man (%)
Sexual Behavior - Females 18+ that ever had vaginal sex with a man (%)
Sexual Behavior - Females 18+ that ever performed oral sex on a man (%)
Sexual Behavior - Females 18+ that ever had anal sex with a man (%)
Sexual Behavior - Females 18+ that ever had any kind of sex with a woman (%)
Sexual Behavior - Average age people first had sex
Sexual Behavior - Average number of female sex partners in lifetime (males 18+)
Sexual Behavior - Average number of female vaginal sex partners in lifetime (males 18+)
Sexual Behavior - Average age people first performed oral sex on a woman (18+)
Sexual Behavior - Average number of woman performed oral sex on in lifetime (18+)
Sexual Behavior - Average number of male sex partners in lifetime (males 18+)
Sexual Behavior - Average number of male anal sex partners in lifetime (males 18+)
Sexual Behavior - Average age people first performed oral sex on a man (18+)
Sexual Behavior - Average number of male oral sex partners in lifetime (18+)
Sexual Behavior - People using protection when performing oral sex (%)
Sexual Behavior - Average number of times people have vaginal or anal sex a year
Sexual Behavior - People having sex without condom (%)
Sexual Behavior - Average number of male sex partners in lifetime (females 18+)
Sexual Behavior - Average number of male vaginal sex partners in lifetime (females 18+)
Sexual Behavior - Average number of female sex partners in lifetime (females 18+)
Sexual Behavior - Circumcised males 18+ (%)
Sleep Disorders - Average hours sleeping at night
Sleep Disorders - People that has trouble sleeping (%)
Smoking-Cigarette Use - People smoking cigarettes (%)
Taste & Smell - People 40+ having problems with smell (%)
Taste & Smell - People 40+ having problems with taste (%)
Taste & Smell - People 40+ that ever had wisdom teeth removed (%)
Taste & Smell - People 40+ that ever had tonsils teeth removed (%)
Taste & Smell - People 40+ that ever had a loss of consciousness because of a head injury (%)
Taste & Smell - People 40+ that ever had a broken nose or other serious injury to face or skull (%)
Taste & Smell - People 40+ that ever had two or more sinus infections (%)
Weight - Average height (inches)
Weight - Average weight (pounds)
Weight - Average BMI
Weight - People that are obese (%)
Weight - People that ever were obese (%)
Weight - People trying to lose weight (%)
Latest news from Cloverly, MD collected exclusively by city-data.com from local newspapers, TV, and radio stations
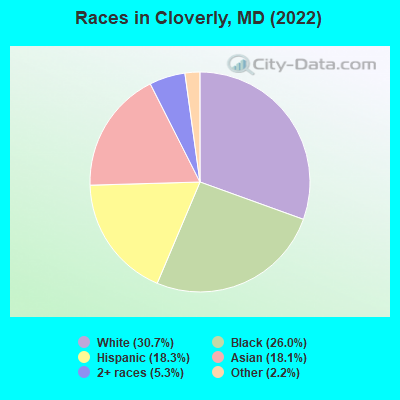
Ancestries: Ethiopian (6.2%), American (5.2%), African (4.7%), Irish (2.4%), Italian (2.3%), German (2.2%).
Current Local Time:
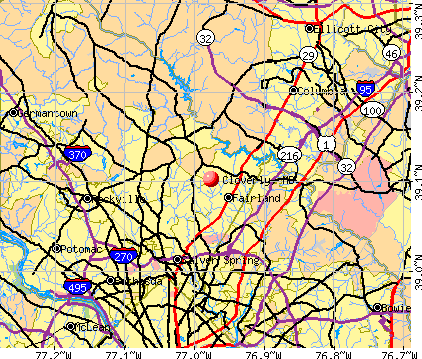
Land area: 3.91 square miles.
Population density: 3,870 people per square mile (average).
5,649 residents are foreign born (11.4% Latin America , 11.2% Asia , 7.3% Africa ).
This place:
34.5%Maryland:
15.7%
Median real estate property taxes paid for housing units with mortgages in 2022: $5,388 (0.8%)Median real estate property taxes paid for housing units with no mortgage in 2022: $6,033 (0.9%)
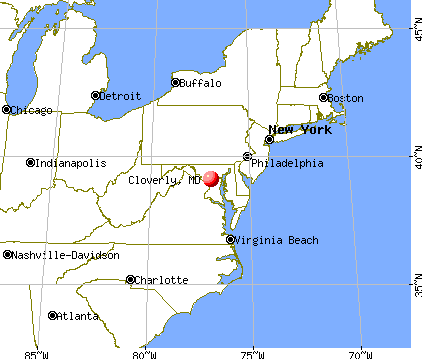
Nearest city with pop. 50,000+: Wheaton-Glenmont, MD
Nearest city with pop. 200,000+: Washington, DC
Nearest city with pop. 1,000,000+: Philadelphia, PA
Nearest cities:
Latitude: 39.10 N, Longitude: 76.98 W
Daytime population change due to commuting: -4,385 (-26.8%)Workers who live and work in this place: 2,613 (33.8%)
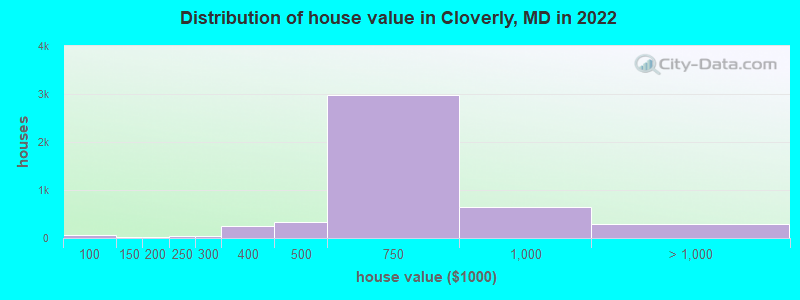
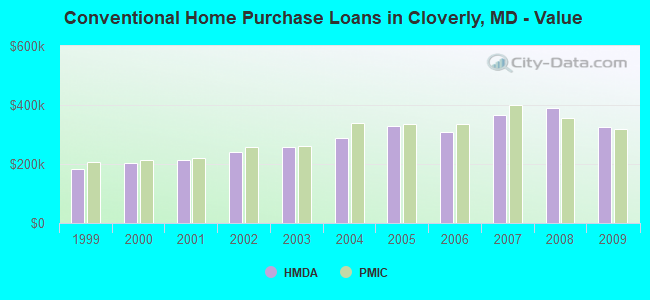
Property values in Cloverly, MD
Unemployment in December 2023:
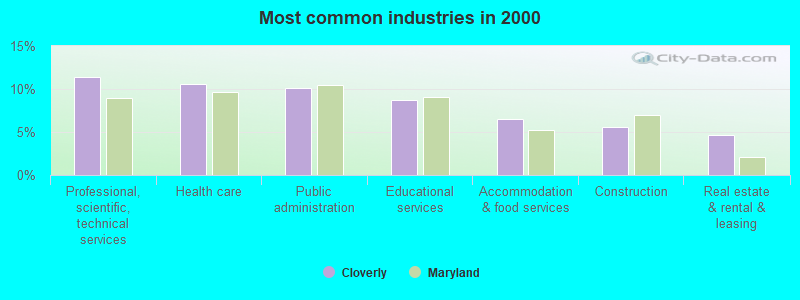
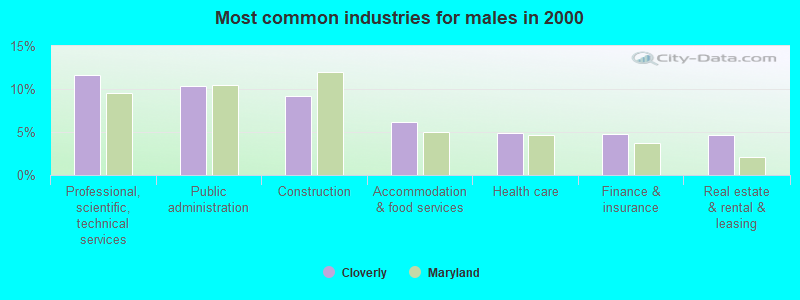
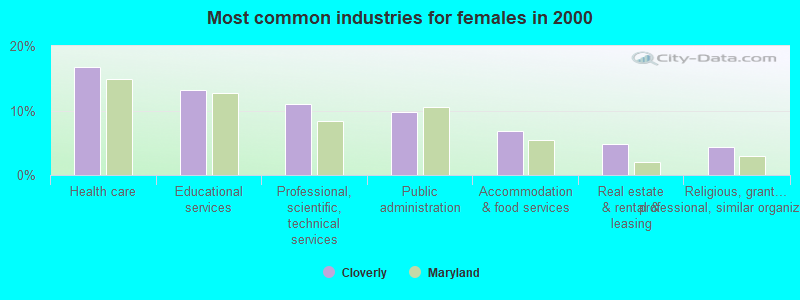
Most common industries in Cloverly, MD (%)
Both Males Females
Professional, scientific, technical services (11.4%)
Health care (10.5%)
Public administration (10.1%)
Educational services (8.7%)
Accommodation & food services (6.5%)
Construction (5.6%)
Real estate & rental & leasing (4.7%)
Professional, scientific, technical services (11.7%)
Public administration (10.3%)
Construction (9.2%)
Accommodation & food services (6.2%)
Health care (4.9%)
Finance & insurance (4.8%)
Real estate & rental & leasing (4.6%)
Health care (16.8%)
Educational services (13.1%)
Professional, scientific, technical services (11.1%)
Public administration (9.7%)
Accommodation & food services (6.9%)
Real estate & rental & leasing (4.8%)
Religious, grantmaking, civic, professional, similar organizations (4.3%)
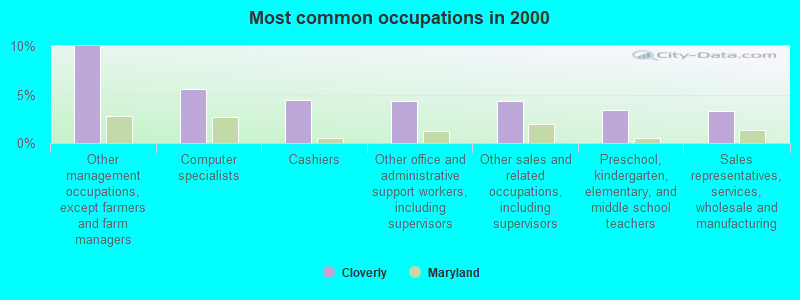
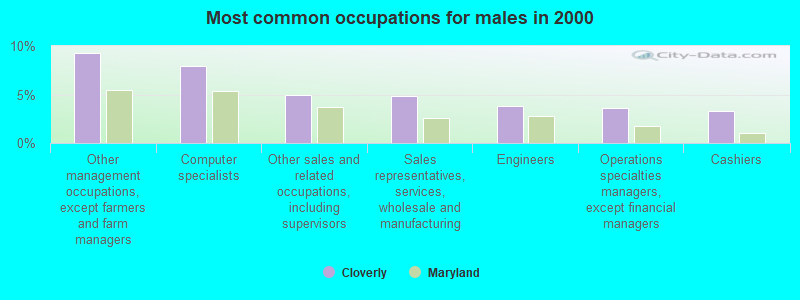
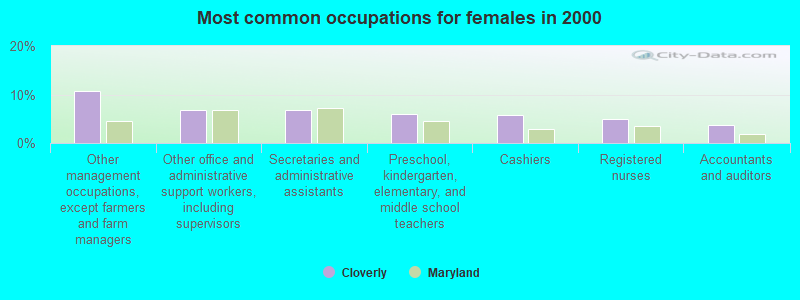
Most common occupations in Cloverly, MD (%)
Both Males Females
Other management occupations, except farmers and farm managers (10.0%)
Computer specialists (5.6%)
Cashiers (4.5%)
Other office and administrative support workers, including supervisors (4.3%)
Other sales and related occupations, including supervisors (4.3%)
Preschool, kindergarten, elementary, and middle school teachers (3.4%)
Sales representatives, services, wholesale and manufacturing (3.3%)
Other management occupations, except farmers and farm managers (9.3%)
Computer specialists (7.9%)
Other sales and related occupations, including supervisors (4.9%)
Sales representatives, services, wholesale and manufacturing (4.8%)
Engineers (3.8%)
Operations specialties managers, except financial managers (3.7%)
Cashiers (3.3%)
Other management occupations, except farmers and farm managers (10.8%)
Other office and administrative support workers, including supervisors (6.7%)
Secretaries and administrative assistants (6.7%)
Preschool, kindergarten, elementary, and middle school teachers (6.1%)
Cashiers (5.7%)
Registered nurses (4.9%)
Accountants and auditors (3.7%)
Tornado activity:
Cloverly-area historical tornado activity is slightly above Maryland state average. It is 14% greater than the overall U.S. average.
On 9/24/2001, a category F3 (max. wind speeds 158-206 mph) tornado 11.8 miles away from the Cloverly place center killed 2 people and injured 55 people and caused $101 million in damages.
On 9/5/1979, a category F3 tornado 17.3 miles away from the place center killed one person and injured 6 people and caused between $500,000 and $5,000,000 in damages.
Earthquake activity:
Cloverly-area historical earthquake activity is significantly above Maryland state average. It is 57% smaller than the overall U.S. average. On 8/23/2011 at 17:51:04, a magnitude 5.8 (5.8 MW, Depth: 3.7 mi, Class: Moderate, Intensity: VI - VII) earthquake occurred 97.5 miles away from the city center On 1/16/1994 at 01:49:16, a magnitude 4.6 (4.6 MB, 4.6 LG, Depth: 3.1 mi, Class: Light, Intensity: IV - V) earthquake occurred 98.5 miles away from the city center On 8/25/2011 at 05:07:52, a magnitude 4.5 (4.5 ML, Depth: 4.2 mi) earthquake occurred 96.3 miles away from the city center On 9/25/1998 at 19:52:52, a magnitude 5.2 (4.8 MB, 4.3 MS, 5.2 LG, 4.5 MW, Depth: 3.1 mi) earthquake occurred 244.6 miles away from the city center On 12/9/2003 at 20:59:18, a magnitude 4.5 (4.5 ML, Depth: 6.2 mi) earthquake occurred 110.3 miles away from Cloverly center On 12/9/2003 at 20:59:14, a magnitude 4.5 (4.5 MB, 4.5 LG) earthquake occurred 116.3 miles away from the city center Magnitude types: regional Lg-wave magnitude (LG), body-wave magnitude (MB), local magnitude (ML), surface-wave magnitude (MS), moment magnitude (MW) Natural disasters: The number of natural disasters in Montgomery County (19) is greater than the US average (15).Major Disasters (Presidential) Declared: 14Emergencies Declared: 5Hurricanes: 5, Winter Storms: 5, Snowstorms: 4, Storms: 4, Floods: 3, Winds: 2, Blizzard: 1, Heavy Rain: 1, Snowfall: 1, Tornado: 1, Tropical Storm: 1, Other: 1 (Note: some incidents may be assigned to more than one category). Hospitals and medical centers near Cloverly: EASTERN NEURO REHABILITATION HOSPITAL (Hospital, about 2 miles away; SILVER SPRING, MD)
FAIRLAND CENTER (Nursing Home, about 2 miles away; SILVER SPRING, MD)
HOLY CROSS REHAB AND NURSING (Nursing Home, about 3 miles away; BURTONSVILLE, MD)
MANORCARE HEALTH SERVICES -SILVER SPRING (Nursing Home, about 3 miles away; SILVER SPRING, MD)
AMEDISYS HOME HEALTH OF BURTONSVILLE (Home Health Center, about 4 miles away; SILVER SPRING, MD)
SPRINGBROOK DIALYSIS CENTER (Dialysis Facility, about 4 miles away; SILVER SPRING, MD)
SPRINGBROOK CENTER (Nursing Home, about 4 miles away; SILVER SPRING, MD)
Amtrak stations near Cloverly: 10 miles: ROCKVILLE (HUNGERFORD DR. & PARK ST.) Services: partially wheelchair accessible, public payphones, paid short-term parking, paid long-term parking, call for taxi service, public transit connection.
12 miles: NEW CARROLLTON (4300 GARDEN CITY DR.) Services: ticket office, fully wheelchair accessible, enclosed waiting area, public restrooms, public payphones, snack bar, ATM, paid short-term parking, paid long-term parking, call for car rental service, taxi stand, public transit connection.
15 miles: WASHINGTON (50 MASSACHUSETTS AVE. N.E.) Services: ticket office, fully wheelchair accessible, enclosed waiting area, public restrooms, public payphones, full-service food facilities and snack bar, ATM, paid short-term parking, paid long-term parking, car rental agency, taxi stand, public transit connection.
Colleges/universities with over 2000 students nearest to Cloverly:
University of Maryland-College Park (about 9 miles; College Park, MD ; Full-time enrollment: 32,734)
University of Maryland-University College (about 9 miles; Adelphi, MD ; FT enrollment: 25,040)
Howard Community College (about 10 miles; Columbia, MD ; FT enrollment: 6,528)
Montgomery College (about 10 miles; Rockville, MD ; FT enrollment: 17,999)
Catholic University of America (about 12 miles; Washington, DC ; FT enrollment: 5,365)
University of the District of Columbia (about 13 miles; Washington, DC ; FT enrollment: 3,675)
Howard University (about 13 miles; Washington, DC ; FT enrollment: 7,838)
Montgomery County has a predicted average indoor radon screening level greater than 4 pCi/L (pico curies per liter) - Highest Potential Average household size: This place:
3.1 peopleMaryland:
2.6 people
Percentage of family households: This place:
84.9%Whole state:
67.1%
Percentage of households with unmarried partners: This place:
2.9%Whole state:
6.4%
Likely homosexual households (counted as self-reported same-sex unmarried-partner households)
Lesbian couples: 0.4% of all households Gay men: 0.3% of all households
People in group quarters in Cloverly in 2010:
30 people in group homes intended for adults
6 people in nursing facilities/skilled-nursing facilities
5 people in other noninstitutional facilities
2 people in workers' group living quarters and job corps centers
people in homes for the mentally retarded in 2000people in other noninstitutional group quarters in 2000For population 15 years and over in Cloverly:
Never married: 28.7%Now married: 59.8%Separated: 1.7%Widowed: 2.7%Divorced: 7.1% For population 25 years and over in Cloverly:
High school or higher: 94.3%Bachelor's degree or higher: 59.9%Graduate or professional degree: 28.0%Unemployed: 2.2%Mean travel time to work (commute): 22.5 minutes
Education Gini index (Inequality in education) Here:
11.6Maryland average:
12.7
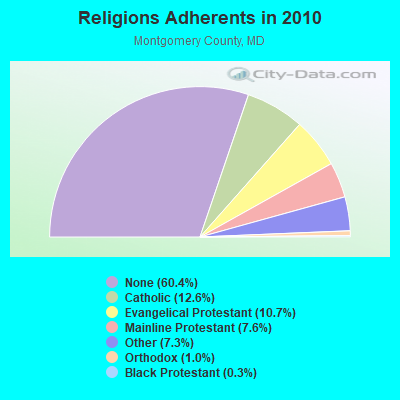
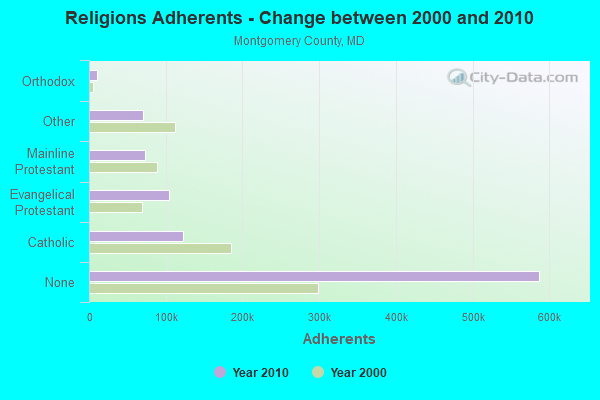
Religion statistics for Cloverly, MD (based on Montgomery County data)
Religion Adherents Congregations Catholic 122,569 39 Evangelical Protestant 104,377 319 Mainline Protestant 73,637 186 Other 70,946 153 Orthodox 9,889 14 Black Protestant 3,189 22 None 587,170 -
Source: Clifford Grammich, Kirk Hadaway, Richard Houseal, Dale E.Jones, Alexei Krindatch, Richie Stanley and Richard H.Taylor. 2012. 2010 U.S.Religion Census: Religious Congregations & Membership Study. Association of Statisticians of American Religious Bodies. Jones, Dale E., et al. 2002. Congregations and Membership in the United States 2000. Nashville, TN: Glenmary Research Center. Graphs represent county-level data
Food Environment Statistics: Number of grocery stores : 203Here :
2.16 / 10,000 pop.Maryland :
1.96 / 10,000 pop.
Number of supercenters and club stores : 2Here :
0.02 / 10,000 pop.Maryland :
0.07 / 10,000 pop.
Number of convenience stores (no gas) : 94Here :
1.00 / 10,000 pop.State :
1.22 / 10,000 pop.
Number of convenience stores (with gas) : 134Montgomery County :
1.42 / 10,000 pop.Maryland :
2.05 / 10,000 pop.
Number of full-service restaurants : 556Montgomery County :
5.91 / 10,000 pop.Maryland :
5.40 / 10,000 pop.
Adult diabetes rate : This county :
6.7%Maryland :
9.1%
Adult obesity rate : Montgomery County :
18.8%Maryland :
26.7%
Low-income preschool obesity rate : Montgomery County :
19.9%Maryland :
15.5%
Health and Nutrition: Healthy diet rate : Cloverly:
51.7%Maryland:
50.1%
Average overall health of teeth and gums : This city:
48.7%State:
47.6%
People feeling badly about themselves : Cloverly:
20.1%State:
20.0%
People not drinking alcohol at all : Cloverly:
12.2%Maryland:
11.3%
Average hours sleeping at night : Overweight people : This city:
33.9%Maryland:
34.1%
General health condition : Average condition of hearing : Cloverly:
80.3%Maryland:
80.5%
More about Health and Nutrition of Cloverly, MD Residents
6.39% of this county's 2021 resident taxpayers lived in other counties in 2020 ($98,213 average adjusted gross income )
Here:
6.39%Maryland average:
7.42%
0.04% of residents moved from foreign countries ($657 average AGI )Montgomery County:
0.04%Maryland average:
0.05%
Top counties from which taxpayers relocated into this county between 2020 and 2021:
7.69% of this county's 2020 resident taxpayers moved to other counties in 2021 ($102,008 average adjusted gross income )
Here:
7.69%Maryland average:
7.91%
0.05% of residents moved to foreign countries ($861 average AGI )Montgomery County:
0.05%Maryland average:
0.04%
Top counties to which taxpayers relocated from this county between 2020 and 2021: Businesses in Cloverly, MD
Strongest AM radio stations in Cloverly:
WTOP (1500 AM; 50 kW; WASHINGTON, DC; Owner: BONNEVILLE HOLDING COMPANY)
WTEM (980 AM; 50 kW; WASHINGTON, DC; Owner: AMFM RADIO LICENSES, L.L.C.)
WMET (1150 AM; 50 kW; GAITHERSBURG, MD; Owner: BELTWAY ACQUISITION CORPORATION)
WCBM (680 AM; 50 kW; BALTIMORE, MD; Owner: WCBM MARYLAND, INC.)
WPGC (1580 AM; 50 kW; MORNINGSIDE, MD; Owner: INFINITY WPGC(AM), INC.)
WBAL (1090 AM; 50 kW; BALTIMORE, MD; Owner: HEARST RADIO, INC.)
WGOP (700 AM; daytime; 25 kW; WALKERSVILLE, MD; Owner: BIRACH BROADCASTING CORPORATION)
WACA (1540 AM; daytime; 5 kW; WHEATON, MD; Owner: AC ACQUISITION, LLC)
WMAL (630 AM; 5 kW; WASHINGTON, DC; Owner: WMAL, INC.)
WTNT (570 AM; 5 kW; BETHESDA, MD; Owner: AMFM RADIO LICENSES, L.L.C.)
WUST (1120 AM; daytime; 20 kW; WASHINGTON, DC)
WWRC (1260 AM; 5 kW; WASHINGTON, DC; Owner: AMFM RADIO LICENSES, L.L.C.)
WBIS (1190 AM; 50 kW; ANNAPOLIS, MD; Owner: NATIONS RADIO, LLC)
Strongest FM radio stations in Cloverly:
WWDC-FM (101.1 FM; WASHINGTON, DC; Owner: AMFM RADIO LICENSES, L.L.C.)
WASH (97.1 FM; WASHINGTON, DC; Owner: AMFM RADIO LICENSES, L.L.C.)
WRQX (107.3 FM; WASHINGTON, DC; Owner: WMAL, INC.)
WHUR-FM (96.3 FM; WASHINGTON, DC; Owner: THE HOWARD UNIVERSITY)
WARW (94.7 FM; BETHESDA, MD; Owner: INFINITY BROADCASTING OPERATIONS, INC.)
WIHT (99.5 FM; WASHINGTON, DC; Owner: AMFM RADIO LICENSES, L.L.C.)
WBIG-FM (100.3 FM; WASHINGTON, DC; Owner: AMFM RADIO LICENSES, L.L.C.)
WCSP-FM (90.1 FM; WASHINGTON, DC; Owner: NATIONAL CABLE SATELLITE CORPORATION)
WKYS (93.9 FM; WASHINGTON, DC; Owner: RADIO ONE LICENSES, LLC)
WPOC (93.1 FM; BALTIMORE, MD; Owner: CITICASTERS LICENSES, L.P.)
WWMX (106.5 FM; BALTIMORE, MD; Owner: INFINITY RADIO OPERATIONS INC.)
WGMS-FM (103.5 FM; WASHINGTON, DC; Owner: BONNEVILLE HOLDING COMPANY)
WAMU (88.5 FM; WASHINGTON, DC; Owner: THE EXEC. COMM. OF THE BD. OF TRUSTEES OF AMERICAN UNIV.)
WMMJ (102.3 FM; BETHESDA, MD; Owner: RADIO ONE LICENSES, LLC)
WGTS (91.9 FM; TAKOMA PARK, MD; Owner: COLUMBIA UNION COLLEGE BROADCASTING, INC.)
WETA (90.9 FM; WASHINGTON, DC; Owner: GREATER WASHINGTON EDUCATIONAL TELECOMMUNICATIONS ASSN.)
WIYY (97.9 FM; BALTIMORE, MD; Owner: HEARST RADIO, INC.)
WPFW (89.3 FM; WASHINGTON, DC; Owner: PACIFICA FOUNDATION, INC.)
WJFK-FM (106.7 FM; MANASSAS, VA; Owner: INFINITY BROADCASTING CORP. OF WASHINGTON, DC)
WAVA (105.1 FM; ARLINGTON, VA; Owner: SALEM MEDIA OF VIRGINIA, INC.)
TV broadcast stations around Cloverly:
WBDC-TV (Channel 50; WASHINGTON, DC; Owner: WBDC BROADCASTING, INC.)
WTTG (Channel 5; WASHINGTON, DC; Owner: FOX TELEVISION STATIONS, INC.)
WJLA-TV (Channel 7; WASHINGTON, DC; Owner: ACC LICENSEE, INC.)
WUSA (Channel 9; WASHINGTON, DC; Owner: THE DETROIT NEWS, INC.)
WETA-TV (Channel 26; WASHINGTON, DC; Owner: THE GREATER WASHINGTON ED TELECOMM. ASSOC)
WDCA (Channel 20; WASHINGTON, DC; Owner: FOX TELEVISION STATIONS, INC.)
WHUT-TV (Channel 32; WASHINGTON, DC; Owner: HOWARD UNIVERSITY)
WRC-TV (Channel 4; WASHINGTON, DC; Owner: NBC SUBSIDIARY (WRC-TV), INC.)
WUTB (Channel 24; BALTIMORE, MD; Owner: FOX TELEVISION STATIONS, INC.)
WBAL-TV (Channel 11; BALTIMORE, MD; Owner: WBAL HEARST-ARGYLE TV, INC. (CA CORP.))
WMAR-TV (Channel 2; BALTIMORE, MD; Owner: SCRIPPS HOWARD BROADCASTING COMPANY)
WBFF (Channel 45; BALTIMORE, MD; Owner: CHESAPEAKE TELEVISION LICENSEE, LLC)
WNUV (Channel 54; BALTIMORE, MD; Owner: BALTIMORE (WNUV-TV) LICENSEE, INC.)
WZDC-LP (Channel 64; WASHINGTON, DC; Owner: ONDA CAPITAL, INC.)
WMPT (Channel 22; ANNAPOLIS, MD; Owner: MARYLAND PUBLIC BROADCASTING COMMISSION)
WJZ-TV (Channel 13; BALTIMORE, MD; Owner: VIACOM INC.)
WMPB (Channel 67; BALTIMORE, MD; Owner: MARYLAND PUBLIC BROADCASTING COMMISSION)
W28BY (Channel 63; BALTIMORE, MD; Owner: INFORMATION SUPER STATION, L.L.C.)
WNVC (Channel 56; FAIRFAX, VA; Owner: COMMONWEALTH PUBLIC BROADCASTING CORPORATION)
WMDO-CA (Channel 30; WASHINGTON, DC; Owner: ENTRAVISION HOLDINGS, LLC)
WKRP-LP (Channel 42; WASHINGTON, DC; Owner: CAPITAL MEDIA, LLC)
WFPT (Channel 62; FREDERICK, MD; Owner: MARYLAND PUBLIC BROADCASTING COMMISSION)
WIAV-LP (Channel 58; WASHINGTON, DC; Owner: ASIAVISION, INC.)
W63BP (Channel 63; ANNAPOLIS, MD; Owner: ANNAPOLIS BROADCASTING COMPANY, INC.)
WPXW (Channel 66; MANASSAS, VA; Owner: PAXSON WASHINGTON LICENSE, INC.)
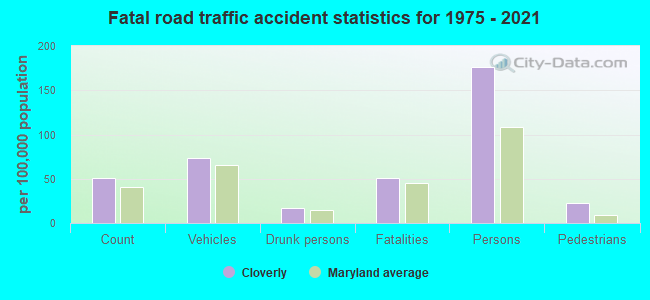
Cloverly fatal accident statistics for 1975 - 2021
Cloverly fatal accident list:
Jun 13, 2009 01:45 AM, Co-161, Lat: 39.097661, Lon: -76.985364, Vehicles: 1, Persons: 4, Fatalities: 1, Drunk persons involved: 1Lat: 39.122146, Lon: -76.988753, Vehicles: 2, Persons: 7, Fatalities: 1Lat: 39.119165, Lon: -76.989014, Vehicles: 1, Persons: 3, Pedestrians: 1, Fatalities: 1, Drunk persons involved: 1Vehicles: 2, Persons: 2, Fatalities: 1Lat: 39.121036, Lon: -76.988819, Vehicles: 1, Persons: 2, Pedestrians: 1, Fatalities: 1
National Bridge Inventory (NBI) Statistics 4 Number of bridges374ft / 114m Total length127,638 Total average daily traffic7,649 Total average daily truck traffic249,844 Total future (year 2041) average daily traffic
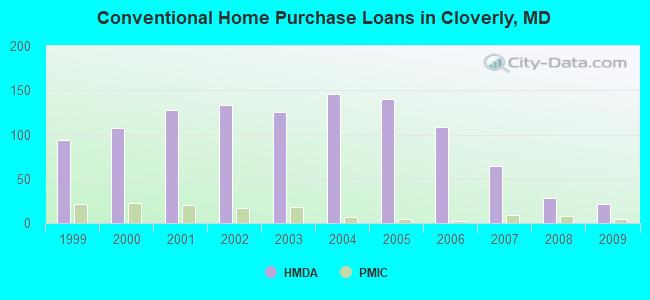
Home Mortgage Disclosure Act Aggregated Statistics For Year 2009(Based on 3 partial tracts) A) FHA, FSA/RHS & VA B) Conventional C) Refinancings D) Home Improvement Loans F) Non-occupant Loans on Number Average Value Number Average Value Number Average Value Number Average Value Number Average Value
LOANS ORIGINATED 28 $338,016 22 $325,048 175 $297,096 7 $176,327 5 $215,124 APPLICATIONS APPROVED, NOT ACCEPTED 0 $0 1 $302,080 15 $292,282 1 $84,770 1 $389,150 APPLICATIONS DENIED 4 $306,095 4 $293,480 54 $364,287 3 $183,547 3 $233,330 APPLICATIONS WITHDRAWN 3 $402,803 6 $375,583 44 $330,265 0 $0 3 $234,953 FILES CLOSED FOR INCOMPLETENESS 0 $0 1 $241,860 12 $365,738 0 $0 1 $218,690
Aggregated Statistics For Year 2008(Based on 3 partial tracts) A) FHA, FSA/RHS & VA B) Conventional C) Refinancings D) Home Improvement Loans F) Non-occupant Loans on Number Average Value Number Average Value Number Average Value Number Average Value Number Average Value
LOANS ORIGINATED 11 $402,539 28 $388,262 75 $299,511 13 $101,403 5 $255,730 APPLICATIONS APPROVED, NOT ACCEPTED 0 $0 6 $307,808 18 $302,492 1 $129,010 0 $0 APPLICATIONS DENIED 3 $425,770 6 $329,220 65 $372,200 13 $198,179 3 $241,060 APPLICATIONS WITHDRAWN 0 $0 5 $329,870 30 $358,159 3 $201,057 1 $250,620 FILES CLOSED FOR INCOMPLETENESS 0 $0 2 $242,290 8 $437,366 0 $0 1 $708,160
Aggregated Statistics For Year 2007(Based on 3 partial tracts) A) FHA, FSA/RHS & VA B) Conventional C) Refinancings D) Home Improvement Loans F) Non-occupant Loans on Number Average Value Number Average Value Number Average Value Number Average Value Number Average Value
LOANS ORIGINATED 1 $303,370 64 $366,904 142 $319,573 19 $161,376 7 $249,871 APPLICATIONS APPROVED, NOT ACCEPTED 0 $0 16 $351,336 36 $299,366 4 $76,300 2 $334,700 APPLICATIONS DENIED 0 $0 18 $423,099 89 $388,581 11 $237,085 7 $357,373 APPLICATIONS WITHDRAWN 0 $0 11 $366,747 52 $349,311 2 $370,010 2 $479,215 FILES CLOSED FOR INCOMPLETENESS 0 $0 2 $512,615 20 $367,567 0 $0 1 $340,910
Aggregated Statistics For Year 2006(Based on 3 partial tracts) B) Conventional C) Refinancings D) Home Improvement Loans F) Non-occupant Loans on Number Average Value Number Average Value Number Average Value Number Average Value
LOANS ORIGINATED 109 $309,666 191 $330,814 24 $132,391 10 $288,461 APPLICATIONS APPROVED, NOT ACCEPTED 15 $317,051 33 $322,139 5 $84,406 1 $161,200 APPLICATIONS DENIED 24 $340,880 98 $360,104 17 $156,620 4 $350,388 APPLICATIONS WITHDRAWN 15 $332,833 59 $362,019 5 $299,154 1 $281,790 FILES CLOSED FOR INCOMPLETENESS 6 $353,490 16 $341,444 2 $348,815 1 $143,460
Aggregated Statistics For Year 2005(Based on 3 partial tracts) B) Conventional C) Refinancings D) Home Improvement Loans F) Non-occupant Loans on G) Loans On Manufactured Number Average Value Number Average Value Number Average Value Number Average Value Number Average Value
LOANS ORIGINATED 140 $329,865 256 $299,614 26 $186,191 17 $260,035 1 $23,860 APPLICATIONS APPROVED, NOT ACCEPTED 10 $334,065 38 $284,658 6 $64,273 2 $199,845 0 $0 APPLICATIONS DENIED 24 $309,022 65 $324,249 15 $115,283 2 $157,065 1 $39,330 APPLICATIONS WITHDRAWN 21 $316,632 79 $301,509 7 $236,816 3 $235,717 0 $0 FILES CLOSED FOR INCOMPLETENESS 4 $255,505 15 $329,052 0 $0 1 $116,110 0 $0
Aggregated Statistics For Year 2004(Based on 3 partial tracts) B) Conventional C) Refinancings D) Home Improvement Loans F) Non-occupant Loans on Number Average Value Number Average Value Number Average Value Number Average Value
LOANS ORIGINATED 146 $287,053 242 $256,117 21 $135,292 12 $242,961 APPLICATIONS APPROVED, NOT ACCEPTED 13 $325,745 41 $260,576 5 $92,518 1 $230,960 APPLICATIONS DENIED 15 $336,063 70 $278,290 11 $91,736 4 $241,282 APPLICATIONS WITHDRAWN 13 $290,829 85 $284,046 6 $115,152 2 $428,945 FILES CLOSED FOR INCOMPLETENESS 3 $256,093 26 $279,623 1 $429,180 1 $265,940
Aggregated Statistics For Year 2003(Based on 3 partial tracts) A) FHA, FSA/RHS & VA B) Conventional C) Refinancings D) Home Improvement Loans F) Non-occupant Loans on Number Average Value Number Average Value Number Average Value Number Average Value Number Average Value
LOANS ORIGINATED 6 $223,817 125 $258,981 607 $222,127 11 $77,426 16 $182,139 APPLICATIONS APPROVED, NOT ACCEPTED 0 $0 9 $246,842 73 $203,182 6 $40,422 3 $187,030 APPLICATIONS DENIED 0 $0 13 $236,868 94 $246,447 6 $44,415 4 $168,030 APPLICATIONS WITHDRAWN 0 $0 15 $248,931 78 $242,358 2 $218,985 2 $238,170 FILES CLOSED FOR INCOMPLETENESS 0 $0 2 $251,125 19 $283,899 1 $40,070 1 $127,780
Aggregated Statistics For Year 2002(Based on 3 partial tracts) A) FHA, FSA/RHS & VA B) Conventional C) Refinancings D) Home Improvement Loans E) Loans on Dwellings For 5+ Families F) Non-occupant Loans on Number Average Value Number Average Value Number Average Value Number Average Value Number Average Value Number Average Value
LOANS ORIGINATED 5 $227,410 133 $241,080 389 $211,103 17 $54,245 1 $424,940 8 $140,111 APPLICATIONS APPROVED, NOT ACCEPTED 1 $150,060 15 $251,350 42 $197,471 7 $43,974 0 $0 1 $129,860 APPLICATIONS DENIED 0 $0 14 $195,721 63 $194,244 6 $38,540 0 $0 1 $275,750 APPLICATIONS WITHDRAWN 0 $0 12 $276,908 65 $204,628 3 $51,430 0 $0 1 $134,270 FILES CLOSED FOR INCOMPLETENESS 0 $0 5 $280,728 14 $198,866 0 $0 0 $0 1 $26,870
Aggregated Statistics For Year 2001(Based on 3 partial tracts) A) FHA, FSA/RHS & VA B) Conventional C) Refinancings D) Home Improvement Loans F) Non-occupant Loans on Number Average Value Number Average Value Number Average Value Number Average Value Number Average Value
LOANS ORIGINATED 13 $173,504 128 $213,832 228 $196,272 11 $30,516 5 $160,932 APPLICATIONS APPROVED, NOT ACCEPTED 1 $111,740 13 $226,692 26 $172,008 5 $33,048 2 $92,895 APPLICATIONS DENIED 2 $183,470 10 $219,247 56 $155,178 12 $35,139 2 $174,755 APPLICATIONS WITHDRAWN 1 $190,660 12 $258,791 60 $167,733 6 $25,067 1 $93,050 FILES CLOSED FOR INCOMPLETENESS 0 $0 2 $220,770 10 $219,751 1 $43,980 0 $0
Aggregated Statistics For Year 2000(Based on 3 partial tracts) A) FHA, FSA/RHS & VA B) Conventional C) Refinancings D) Home Improvement Loans F) Non-occupant Loans on Number Average Value Number Average Value Number Average Value Number Average Value Number Average Value
LOANS ORIGINATED 12 $175,056 107 $201,914 53 $162,832 11 $32,370 4 $180,190 APPLICATIONS APPROVED, NOT ACCEPTED 0 $0 7 $211,213 14 $137,574 5 $32,458 0 $0 APPLICATIONS DENIED 1 $150,940 15 $218,221 31 $141,233 11 $29,573 0 $0 APPLICATIONS WITHDRAWN 2 $177,185 11 $205,887 20 $131,635 4 $99,192 1 $64,510 FILES CLOSED FOR INCOMPLETENESS 0 $0 1 $461,320 5 $161,166 1 $7,950 0 $0
Aggregated Statistics For Year 1999(Based on 3 partial tracts) A) FHA, FSA/RHS & VA B) Conventional C) Refinancings D) Home Improvement Loans F) Non-occupant Loans on Number Average Value Number Average Value Number Average Value Number Average Value Number Average Value
LOANS ORIGINATED 18 $156,841 94 $181,649 129 $156,845 15 $38,623 4 $121,542 APPLICATIONS APPROVED, NOT ACCEPTED 0 $0 8 $199,651 25 $123,456 2 $18,650 1 $38,420 APPLICATIONS DENIED 1 $89,880 15 $221,209 38 $158,012 9 $32,538 1 $169,730 APPLICATIONS WITHDRAWN 1 $214,180 10 $186,357 40 $143,476 6 $110,970 0 $0 FILES CLOSED FOR INCOMPLETENESS 1 $94,130 2 $159,155 13 $150,618 0 $0 0 $0
Detailed HMDA statistics for the following Tracts:
7014.08
, 7014.09 , 7014.15
Private Mortgage Insurance Companies Aggregated Statistics For Year 2009(Based on 3 partial tracts) A) Conventional B) Refinancings Number Average Value Number Average Value
LOANS ORIGINATED 4 $318,668 1 $533,670 APPLICATIONS APPROVED, NOT ACCEPTED 1 $310,630 1 $259,260 APPLICATIONS DENIED 1 $308,610 1 $360,990 APPLICATIONS WITHDRAWN 0 $0 0 $0 FILES CLOSED FOR INCOMPLETENESS 0 $0 0 $0
Aggregated Statistics For Year 2008(Based on 3 partial tracts) A) Conventional B) Refinancings Number Average Value Number Average Value
LOANS ORIGINATED 8 $355,366 2 $442,695 APPLICATIONS APPROVED, NOT ACCEPTED 4 $464,665 1 $489,890 APPLICATIONS DENIED 1 $274,160 1 $357,940 APPLICATIONS WITHDRAWN 0 $0 0 $0 FILES CLOSED FOR INCOMPLETENESS 0 $0 0 $0
Aggregated Statistics For Year 2007(Based on 3 partial tracts) A) Conventional B) Refinancings C) Non-occupant Loans on Number Average Value Number Average Value Number Average Value
LOANS ORIGINATED 9 $399,763 8 $418,791 0 $0 APPLICATIONS APPROVED, NOT ACCEPTED 0 $0 2 $580,965 0 $0 APPLICATIONS DENIED 0 $0 1 $258,840 1 $258,840 APPLICATIONS WITHDRAWN 1 $601,350 2 $400,200 0 $0 FILES CLOSED FOR INCOMPLETENESS 0 $0 0 $0 0 $0
Aggregated Statistics For Year 2006(Based on 3 partial tracts) A) Conventional B) Refinancings Number Average Value Number Average Value
LOANS ORIGINATED 2 $335,810 2 $498,660 APPLICATIONS APPROVED, NOT ACCEPTED 0 $0 0 $0 APPLICATIONS DENIED 0 $0 0 $0 APPLICATIONS WITHDRAWN 0 $0 0 $0 FILES CLOSED FOR INCOMPLETENESS 0 $0 0 $0
Aggregated Statistics For Year 2005(Based on 3 partial tracts) A) Conventional B) Refinancings Number Average Value Number Average Value
LOANS ORIGINATED 4 $333,985 1 $580,360 APPLICATIONS APPROVED, NOT ACCEPTED 2 $386,845 1 $264,770 APPLICATIONS DENIED 0 $0 0 $0 APPLICATIONS WITHDRAWN 0 $0 1 $378,050 FILES CLOSED FOR INCOMPLETENESS 0 $0 0 $0
Aggregated Statistics For Year 2004(Based on 3 partial tracts) A) Conventional B) Refinancings C) Non-occupant Loans on Number Average Value Number Average Value Number Average Value
LOANS ORIGINATED 7 $338,111 8 $255,012 1 $209,240 APPLICATIONS APPROVED, NOT ACCEPTED 2 $296,000 3 $303,627 0 $0 APPLICATIONS DENIED 0 $0 0 $0 0 $0 APPLICATIONS WITHDRAWN 1 $352,580 1 $174,160 0 $0 FILES CLOSED FOR INCOMPLETENESS 0 $0 0 $0 0 $0
Aggregated Statistics For Year 2003(Based on 3 partial tracts) A) Conventional B) Refinancings C) Non-occupant Loans on Number Average Value Number Average Value Number Average Value
LOANS ORIGINATED 18 $260,977 16 $250,946 2 $216,060 APPLICATIONS APPROVED, NOT ACCEPTED 3 $248,223 6 $263,190 0 $0 APPLICATIONS DENIED 1 $423,340 1 $233,530 0 $0 APPLICATIONS WITHDRAWN 1 $176,170 2 $205,810 0 $0 FILES CLOSED FOR INCOMPLETENESS 0 $0 0 $0 0 $0
Aggregated Statistics For Year 2002(Based on 3 partial tracts) A) Conventional B) Refinancings Number Average Value Number Average Value
LOANS ORIGINATED 17 $255,955 14 $239,000 APPLICATIONS APPROVED, NOT ACCEPTED 5 $238,632 4 $218,722 APPLICATIONS DENIED 0 $0 0 $0 APPLICATIONS WITHDRAWN 2 $208,180 1 $254,040 FILES CLOSED FOR INCOMPLETENESS 0 $0 0 $0
Aggregated Statistics For Year 2001(Based on 3 partial tracts) A) Conventional B) Refinancings Number Average Value Number Average Value
LOANS ORIGINATED 20 $220,276 16 $225,265 APPLICATIONS APPROVED, NOT ACCEPTED 3 $233,257 3 $236,933 APPLICATIONS DENIED 1 $262,090 2 $191,840 APPLICATIONS WITHDRAWN 0 $0 0 $0 FILES CLOSED FOR INCOMPLETENESS 1 $216,070 0 $0
Aggregated Statistics For Year 2000(Based on 3 partial tracts) A) Conventional B) Refinancings Number Average Value Number Average Value
LOANS ORIGINATED 23 $215,001 5 $221,910 APPLICATIONS APPROVED, NOT ACCEPTED 2 $286,710 0 $0 APPLICATIONS DENIED 1 $145,240 1 $260,190 APPLICATIONS WITHDRAWN 1 $102,410 0 $0 FILES CLOSED FOR INCOMPLETENESS 0 $0 0 $0
Aggregated Statistics For Year 1999(Based on 3 partial tracts) A) Conventional B) Refinancings Number Average Value Number Average Value
LOANS ORIGINATED 21 $208,011 14 $181,604 APPLICATIONS APPROVED, NOT ACCEPTED 2 $247,575 5 $207,928 APPLICATIONS DENIED 1 $264,090 0 $0 APPLICATIONS WITHDRAWN 0 $0 2 $246,620 FILES CLOSED FOR INCOMPLETENESS 0 $0 0 $0
Detailed PMIC statistics for the following Tracts:
7014.08
, 7014.09 , 7014.15 Cloverly compared to Maryland state average:
Median house value above state average. Unemployed percentage significantly below state average. Black race population percentage above state average. Hispanic race population percentage significantly above state average. Median age significantly above state average. Foreign-born population percentage significantly above state average. Renting percentage significantly below state average. Length of stay since moving in significantly above state average. Number of rooms per house above state average. Number of college students above state average. Percentage of population with a bachelor's degree or higher above state average.
#16 on the list of "Top 101 cities with the most residents born in Middle Africa (population 500+)"
#21 on the list of "Top 101 cities with the most residents born in Sierra Leone (population 500+)"
#58 on the list of "Top 101 cities with the most residents born in Africa (population 500+)"
#80 on the list of "Top 101 cities with the most residents born in Korea (population 500+)"
#96 on the list of "Top 100 cities with biggest houses"
#4 on the list of "Top 101 counties with the largest number of people without health insurance coverage in 2000 (pop. 50,000+)"
#6 on the list of "Top 101 counties with the best general health status score of residents (1-5), 3 years of data"
#10 on the list of "Top 101 counties with the highest surface withdrawal of fresh water for public supply"
#13 on the list of "Top 101 counties with the highest total withdrawal of fresh water for public supply"
#14 on the list of "Top 101 counties with the highest percentage of residents that visited a dentist within the past year"


 Recent articles from our blog. Our writers, many of them Ph.D. graduates or candidates, create easy-to-read articles on a wide variety of topics.

 (5.6 miles