Columbia City, Indiana Submit your own pictures of this city and show them to the world
OSM Map
General Map
Google Map
MSN Map
OSM Map
General Map
Google Map
MSN Map
OSM Map
General Map
Google Map
MSN Map
OSM Map
General Map
Google Map
MSN Map
Please wait while loading the map...
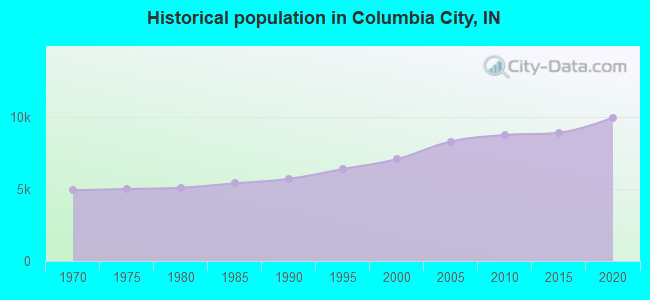
Population in 2022: 10,086 (98% urban, 2% rural). Population change since 2000: +42.5%Males: 5,012 Females: 5,074
March 2022 cost of living index in Columbia City: 83.2 (low, U.S. average is 100) Percentage of residents living in poverty in 2022: 13.0%for White Non-Hispanic residents , 13.5% for Hispanic or Latino residents , 54.3% for American Indian residents , 4.9% for two or more races residents )
Profiles of local businesses
Business Search - 14 Million verified businesses
Data:
Median household income ($)
Median household income (% change since 2000)
Household income diversity
Ratio of average income to average house value (%)
Ratio of average income to average rent
Median household income ($) - White
Median household income ($) - Black or African American
Median household income ($) - Asian
Median household income ($) - Hispanic or Latino
Median household income ($) - American Indian and Alaska Native
Median household income ($) - Multirace
Median household income ($) - Other Race
Median household income for houses/condos with a mortgage ($)
Median household income for apartments without a mortgage ($)
Races - White alone (%)
Races - White alone (% change since 2000)
Races - Black alone (%)
Races - Black alone (% change since 2000)
Races - American Indian alone (%)
Races - American Indian alone (% change since 2000)
Races - Asian alone (%)
Races - Asian alone (% change since 2000)
Races - Hispanic (%)
Races - Hispanic (% change since 2000)
Races - Native Hawaiian and Other Pacific Islander alone (%)
Races - Native Hawaiian and Other Pacific Islander alone (% change since 2000)
Races - Two or more races (%)
Races - Two or more races (% change since 2000)
Races - Other race alone (%)
Races - Other race alone (% change since 2000)
Racial diversity
Unemployment (%)
Unemployment (% change since 2000)
Unemployment (%) - White
Unemployment (%) - Black or African American
Unemployment (%) - Asian
Unemployment (%) - Hispanic or Latino
Unemployment (%) - American Indian and Alaska Native
Unemployment (%) - Multirace
Unemployment (%) - Other Race
Population density (people per square mile)
Population - Males (%)
Population - Females (%)
Population - Males (%) - White
Population - Males (%) - Black or African American
Population - Males (%) - Asian
Population - Males (%) - Hispanic or Latino
Population - Males (%) - American Indian and Alaska Native
Population - Males (%) - Multirace
Population - Males (%) - Other Race
Population - Females (%) - White
Population - Females (%) - Black or African American
Population - Females (%) - Asian
Population - Females (%) - Hispanic or Latino
Population - Females (%) - American Indian and Alaska Native
Population - Females (%) - Multirace
Population - Females (%) - Other Race
Coronavirus confirmed cases (Apr 25, 2024)
Deaths caused by coronavirus (Apr 25, 2024)
Coronavirus confirmed cases (per 100k population) (Apr 25, 2024)
Deaths caused by coronavirus (per 100k population) (Apr 25, 2024)
Daily increase in number of cases (Apr 25, 2024)
Weekly increase in number of cases (Apr 25, 2024)
Cases doubled (in days) (Apr 25, 2024)
Hospitalized patients (Apr 18, 2022)
Negative test results (Apr 18, 2022)
Total test results (Apr 18, 2022)
COVID Vaccine doses distributed (per 100k population) (Sep 19, 2023)
COVID Vaccine doses administered (per 100k population) (Sep 19, 2023)
COVID Vaccine doses distributed (Sep 19, 2023)
COVID Vaccine doses administered (Sep 19, 2023)
Likely homosexual households (%)
Likely homosexual households (% change since 2000)
Likely homosexual households - Lesbian couples (%)
Likely homosexual households - Lesbian couples (% change since 2000)
Likely homosexual households - Gay men (%)
Likely homosexual households - Gay men (% change since 2000)
Cost of living index
Median gross rent ($)
Median contract rent ($)
Median monthly housing costs ($)
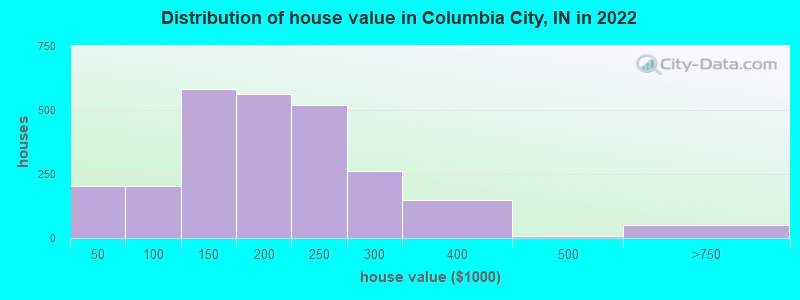
Median house or condo value ($)
Median house or condo value ($ change since 2000)
Mean house or condo value by units in structure - 1, detached ($)
Mean house or condo value by units in structure - 1, attached ($)
Mean house or condo value by units in structure - 2 ($)
Mean house or condo value by units in structure by units in structure - 3 or 4 ($)
Mean house or condo value by units in structure - 5 or more ($)
Mean house or condo value by units in structure - Boat, RV, van, etc. ($)
Mean house or condo value by units in structure - Mobile home ($)
Median house or condo value ($) - White
Median house or condo value ($) - Black or African American
Median house or condo value ($) - Asian
Median house or condo value ($) - Hispanic or Latino
Median house or condo value ($) - American Indian and Alaska Native
Median house or condo value ($) - Multirace
Median house or condo value ($) - Other Race
Median resident age
Resident age diversity
Median resident age - Males
Median resident age - Females
Median resident age - White
Median resident age - Black or African American
Median resident age - Asian
Median resident age - Hispanic or Latino
Median resident age - American Indian and Alaska Native
Median resident age - Multirace
Median resident age - Other Race
Median resident age - Males - White
Median resident age - Males - Black or African American
Median resident age - Males - Asian
Median resident age - Males - Hispanic or Latino
Median resident age - Males - American Indian and Alaska Native
Median resident age - Males - Multirace
Median resident age - Males - Other Race
Median resident age - Females - White
Median resident age - Females - Black or African American
Median resident age - Females - Asian
Median resident age - Females - Hispanic or Latino
Median resident age - Females - American Indian and Alaska Native
Median resident age - Females - Multirace
Median resident age - Females - Other Race
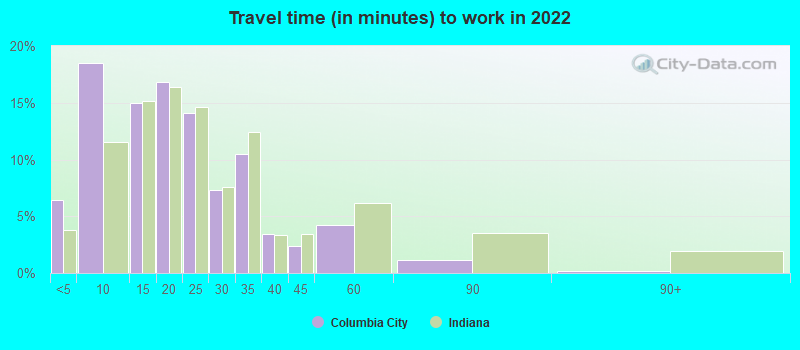
Commute - mean travel time to work (minutes)
Travel time to work - Less than 5 minutes (%)
Travel time to work - Less than 5 minutes (% change since 2000)
Travel time to work - 5 to 9 minutes (%)
Travel time to work - 5 to 9 minutes (% change since 2000)
Travel time to work - 10 to 19 minutes (%)
Travel time to work - 10 to 19 minutes (% change since 2000)
Travel time to work - 20 to 29 minutes (%)
Travel time to work - 20 to 29 minutes (% change since 2000)
Travel time to work - 30 to 39 minutes (%)
Travel time to work - 30 to 39 minutes (% change since 2000)
Travel time to work - 40 to 59 minutes (%)
Travel time to work - 40 to 59 minutes (% change since 2000)
Travel time to work - 60 to 89 minutes (%)
Travel time to work - 60 to 89 minutes (% change since 2000)
Travel time to work - 90 or more minutes (%)
Travel time to work - 90 or more minutes (% change since 2000)
Marital status - Never married (%)
Marital status - Now married (%)
Marital status - Separated (%)
Marital status - Widowed (%)
Marital status - Divorced (%)
Median family income ($)
Median family income (% change since 2000)
Median non-family income ($)
Median non-family income (% change since 2000)
Median per capita income ($)
Median per capita income (% change since 2000)
Median family income ($) - White
Median family income ($) - Black or African American
Median family income ($) - Asian
Median family income ($) - Hispanic or Latino
Median family income ($) - American Indian and Alaska Native
Median family income ($) - Multirace
Median family income ($) - Other Race
Median year house/condo built
Median year apartment built
Year house built - Built 2005 or later (%)
Year house built - Built 2000 to 2004 (%)
Year house built - Built 1990 to 1999 (%)
Year house built - Built 1980 to 1989 (%)
Year house built - Built 1970 to 1979 (%)
Year house built - Built 1960 to 1969 (%)
Year house built - Built 1950 to 1959 (%)
Year house built - Built 1940 to 1949 (%)
Year house built - Built 1939 or earlier (%)
Average household size
Household density (households per square mile)
Average household size - White
Average household size - Black or African American
Average household size - Asian
Average household size - Hispanic or Latino
Average household size - American Indian and Alaska Native
Average household size - Multirace
Average household size - Other Race
Occupied housing units (%)
Vacant housing units (%)
Owner occupied housing units (%)
Renter occupied housing units (%)
Vacancy status - For rent (%)
Vacancy status - For sale only (%)
Vacancy status - Rented or sold, not occupied (%)
Vacancy status - For seasonal, recreational, or occasional use (%)
Vacancy status - For migrant workers (%)
Vacancy status - Other vacant (%)
Residents with income below the poverty level (%)
Residents with income below 50% of the poverty level (%)
Children below poverty level (%)
Poor families by family type - Married-couple family (%)
Poor families by family type - Male, no wife present (%)
Poor families by family type - Female, no husband present (%)
Poverty status for native-born residents (%)
Poverty status for foreign-born residents (%)
Poverty among high school graduates not in families (%)
Poverty among people who did not graduate high school not in families (%)
Residents with income below the poverty level (%) - White
Residents with income below the poverty level (%) - Black or African American
Residents with income below the poverty level (%) - Asian
Residents with income below the poverty level (%) - Hispanic or Latino
Residents with income below the poverty level (%) - American Indian and Alaska Native
Residents with income below the poverty level (%) - Multirace
Residents with income below the poverty level (%) - Other Race
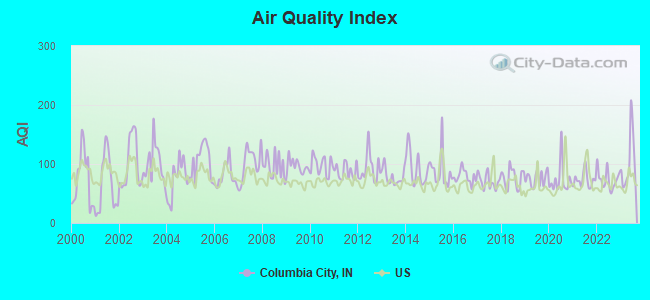
Air pollution - Air Quality Index (AQI)
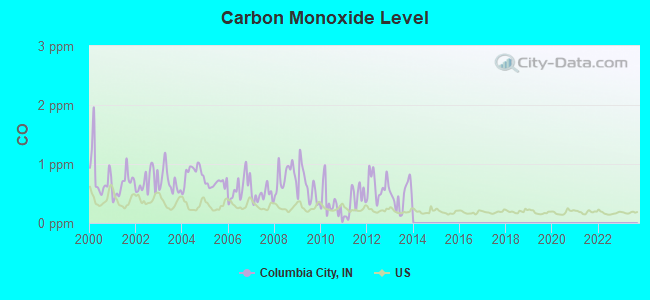
Air pollution - CO
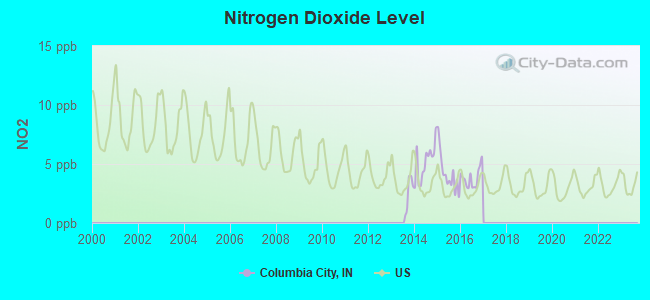
Air pollution - NO2
Air pollution - SO2
Air pollution - Ozone
Air pollution - PM10
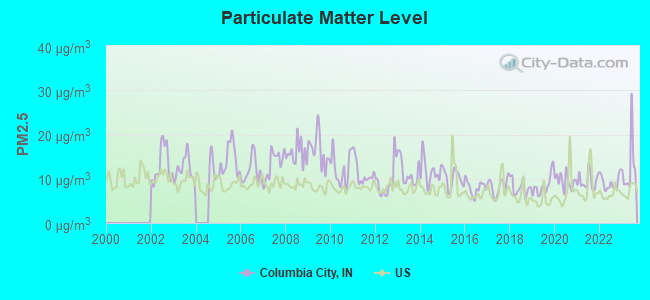
Air pollution - PM25
Air pollution - Pb
Crime - Murders per 100,000 population
Crime - Rapes per 100,000 population
Crime - Robberies per 100,000 population
Crime - Assaults per 100,000 population
Crime - Burglaries per 100,000 population
Crime - Thefts per 100,000 population
Crime - Auto thefts per 100,000 population
Crime - Arson per 100,000 population
Crime - City-data.com crime index
Crime - Violent crime index
Crime - Property crime index
Crime - Murders per 100,000 population (5 year average)
Crime - Rapes per 100,000 population (5 year average)
Crime - Robberies per 100,000 population (5 year average)
Crime - Assaults per 100,000 population (5 year average)
Crime - Burglaries per 100,000 population (5 year average)
Crime - Thefts per 100,000 population (5 year average)
Crime - Auto thefts per 100,000 population (5 year average)
Crime - Arson per 100,000 population (5 year average)
Crime - City-data.com crime index (5 year average)
Crime - Violent crime index (5 year average)
Crime - Property crime index (5 year average)
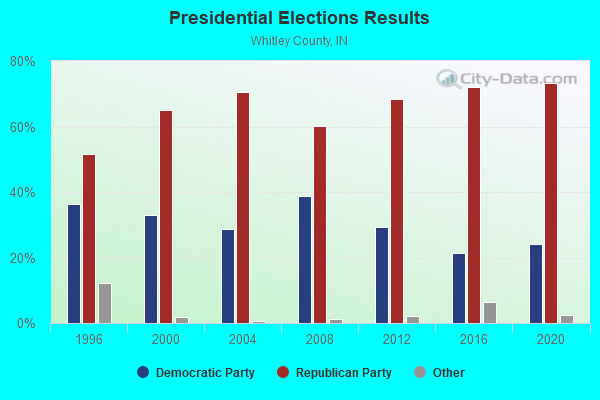
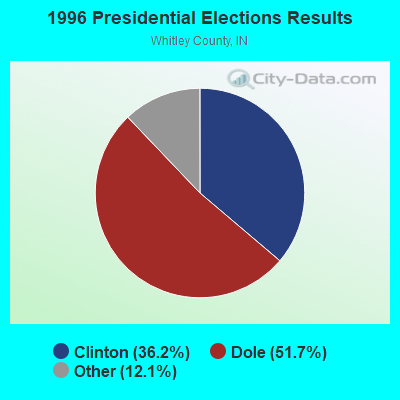
1996 Presidential Elections Results (%) - Democratic Party (Clinton)
1996 Presidential Elections Results (%) - Republican Party (Dole)
1996 Presidential Elections Results (%) - Other
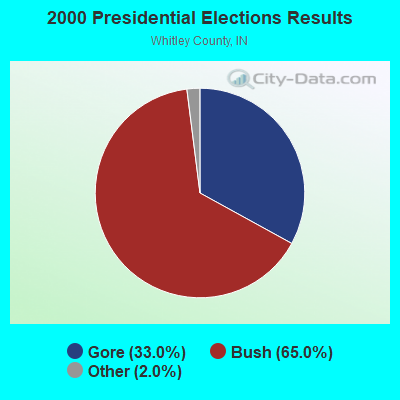
2000 Presidential Elections Results (%) - Democratic Party (Gore)
2000 Presidential Elections Results (%) - Republican Party (Bush)
2000 Presidential Elections Results (%) - Other
2004 Presidential Elections Results (%) - Democratic Party (Kerry)
2004 Presidential Elections Results (%) - Republican Party (Bush)
2004 Presidential Elections Results (%) - Other
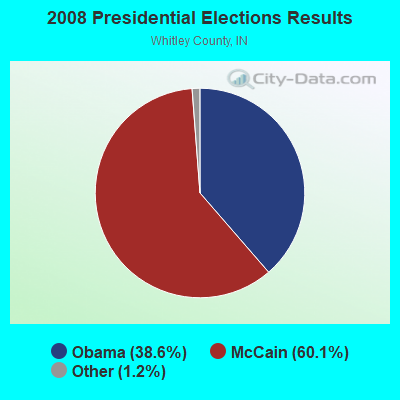
2008 Presidential Elections Results (%) - Democratic Party (Obama)
2008 Presidential Elections Results (%) - Republican Party (McCain)
2008 Presidential Elections Results (%) - Other
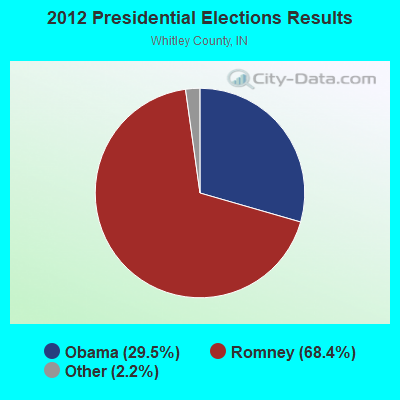
2012 Presidential Elections Results (%) - Democratic Party (Obama)
2012 Presidential Elections Results (%) - Republican Party (Romney)
2012 Presidential Elections Results (%) - Other
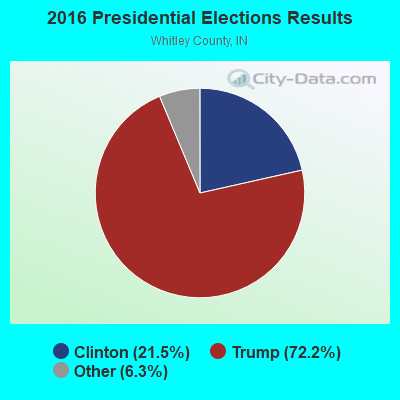
2016 Presidential Elections Results (%) - Democratic Party (Clinton)
2016 Presidential Elections Results (%) - Republican Party (Trump)
2016 Presidential Elections Results (%) - Other
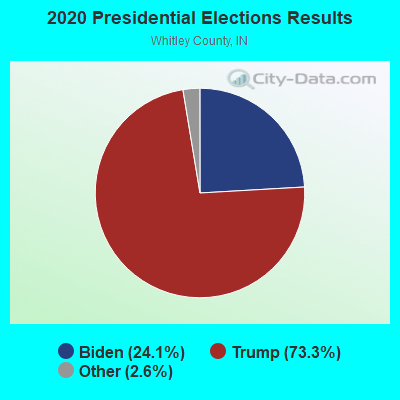
2020 Presidential Elections Results (%) - Democratic Party (Biden)
2020 Presidential Elections Results (%) - Republican Party (Trump)
2020 Presidential Elections Results (%) - Other
Ancestries Reported - Arab (%)
Ancestries Reported - Czech (%)
Ancestries Reported - Danish (%)
Ancestries Reported - Dutch (%)
Ancestries Reported - English (%)
Ancestries Reported - French (%)
Ancestries Reported - French Canadian (%)
Ancestries Reported - German (%)
Ancestries Reported - Greek (%)
Ancestries Reported - Hungarian (%)
Ancestries Reported - Irish (%)
Ancestries Reported - Italian (%)
Ancestries Reported - Lithuanian (%)
Ancestries Reported - Norwegian (%)
Ancestries Reported - Polish (%)
Ancestries Reported - Portuguese (%)
Ancestries Reported - Russian (%)
Ancestries Reported - Scotch-Irish (%)
Ancestries Reported - Scottish (%)
Ancestries Reported - Slovak (%)
Ancestries Reported - Subsaharan African (%)
Ancestries Reported - Swedish (%)
Ancestries Reported - Swiss (%)
Ancestries Reported - Ukrainian (%)
Ancestries Reported - United States (%)
Ancestries Reported - Welsh (%)
Ancestries Reported - West Indian (%)
Ancestries Reported - Other (%)
Educational Attainment - No schooling completed (%)
Educational Attainment - Less than high school (%)
Educational Attainment - High school or equivalent (%)
Educational Attainment - Less than 1 year of college (%)
Educational Attainment - 1 or more years of college (%)
Educational Attainment - Associate degree (%)
Educational Attainment - Bachelor's degree (%)
Educational Attainment - Master's degree (%)
Educational Attainment - Professional school degree (%)
Educational Attainment - Doctorate degree (%)
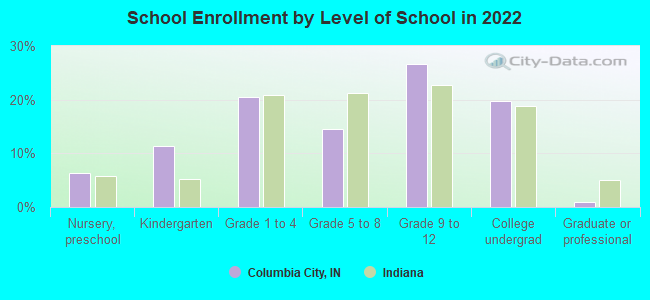
School Enrollment - Nursery, preschool (%)
School Enrollment - Kindergarten (%)
School Enrollment - Grade 1 to 4 (%)
School Enrollment - Grade 5 to 8 (%)
School Enrollment - Grade 9 to 12 (%)
School Enrollment - College undergrad (%)
School Enrollment - Graduate or professional (%)
School Enrollment - Not enrolled in school (%)
School enrollment - Public schools (%)
School enrollment - Private schools (%)
School enrollment - Not enrolled (%)
Median number of rooms in houses and condos
Median number of rooms in apartments
Housing units lacking complete plumbing facilities (%)
Housing units lacking complete kitchen facilities (%)
Density of houses
Urban houses (%)
Rural houses (%)
Households with people 60 years and over (%)
Households with people 65 years and over (%)
Households with people 75 years and over (%)
Households with one or more nonrelatives (%)
Households with no nonrelatives (%)
Population in households (%)
Family households (%)
Nonfamily households (%)
Population in families (%)
Family households with own children (%)
Median number of bedrooms in owner occupied houses
Mean number of bedrooms in owner occupied houses
Median number of bedrooms in renter occupied houses
Mean number of bedrooms in renter occupied houses
Median number of vehichles in owner occupied houses
Mean number of vehichles in owner occupied houses
Median number of vehichles in renter occupied houses
Mean number of vehichles in renter occupied houses
Mortgage status - with mortgage (%)
Mortgage status - with second mortgage (%)
Mortgage status - with home equity loan (%)
Mortgage status - with both second mortgage and home equity loan (%)
Mortgage status - without a mortgage (%)
Average family size
Average family size - White
Average family size - Black or African American
Average family size - Asian
Average family size - Hispanic or Latino
Average family size - American Indian and Alaska Native
Average family size - Multirace
Average family size - Other Race
Geographical mobility - Same house 1 year ago (%)
Geographical mobility - Moved within same county (%)
Geographical mobility - Moved from different county within same state (%)
Geographical mobility - Moved from different state (%)
Geographical mobility - Moved from abroad (%)
Place of birth - Born in state of residence (%)
Place of birth - Born in other state (%)
Place of birth - Native, outside of US (%)
Place of birth - Foreign born (%)
Housing units in structures - 1, detached (%)
Housing units in structures - 1, attached (%)
Housing units in structures - 2 (%)
Housing units in structures - 3 or 4 (%)
Housing units in structures - 5 to 9 (%)
Housing units in structures - 10 to 19 (%)
Housing units in structures - 20 to 49 (%)
Housing units in structures - 50 or more (%)
Housing units in structures - Mobile home (%)
Housing units in structures - Boat, RV, van, etc. (%)
House/condo owner moved in on average (years ago)
Renter moved in on average (years ago)
Year householder moved into unit - Moved in 1999 to March 2000 (%)
Year householder moved into unit - Moved in 1995 to 1998 (%)
Year householder moved into unit - Moved in 1990 to 1994 (%)
Year householder moved into unit - Moved in 1980 to 1989 (%)
Year householder moved into unit - Moved in 1970 to 1979 (%)
Year householder moved into unit - Moved in 1969 or earlier (%)
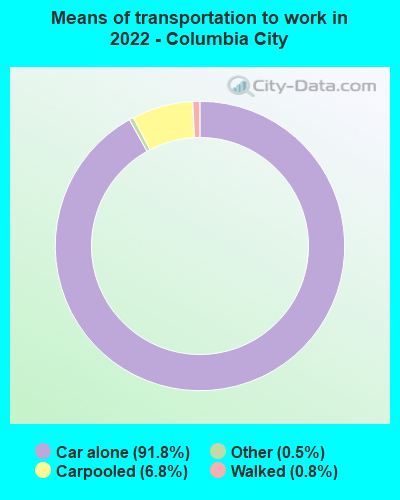
Means of transportation to work - Drove car alone (%)
Means of transportation to work - Carpooled (%)
Means of transportation to work - Public transportation (%)
Means of transportation to work - Bus or trolley bus (%)
Means of transportation to work - Streetcar or trolley car (%)
Means of transportation to work - Subway or elevated (%)
Means of transportation to work - Railroad (%)
Means of transportation to work - Ferryboat (%)
Means of transportation to work - Taxicab (%)
Means of transportation to work - Motorcycle (%)
Means of transportation to work - Bicycle (%)
Means of transportation to work - Walked (%)
Means of transportation to work - Other means (%)
Working at home (%)
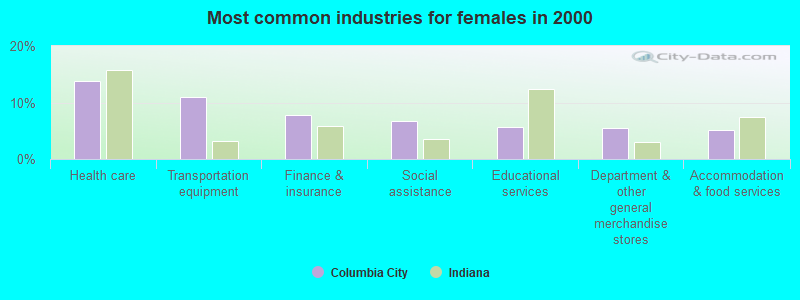
Industry diversity
Most Common Industries - Agriculture, forestry, fishing and hunting, and mining (%)
Most Common Industries - Agriculture, forestry, fishing and hunting (%)
Most Common Industries - Mining, quarrying, and oil and gas extraction (%)
Most Common Industries - Construction (%)
Most Common Industries - Manufacturing (%)
Most Common Industries - Wholesale trade (%)
Most Common Industries - Retail trade (%)
Most Common Industries - Transportation and warehousing, and utilities (%)
Most Common Industries - Transportation and warehousing (%)
Most Common Industries - Utilities (%)
Most Common Industries - Information (%)
Most Common Industries - Finance and insurance, and real estate and rental and leasing (%)
Most Common Industries - Finance and insurance (%)
Most Common Industries - Real estate and rental and leasing (%)
Most Common Industries - Professional, scientific, and management, and administrative and waste management services (%)
Most Common Industries - Professional, scientific, and technical services (%)
Most Common Industries - Management of companies and enterprises (%)
Most Common Industries - Administrative and support and waste management services (%)
Most Common Industries - Educational services, and health care and social assistance (%)
Most Common Industries - Educational services (%)
Most Common Industries - Health care and social assistance (%)
Most Common Industries - Arts, entertainment, and recreation, and accommodation and food services (%)
Most Common Industries - Arts, entertainment, and recreation (%)
Most Common Industries - Accommodation and food services (%)
Most Common Industries - Other services, except public administration (%)
Most Common Industries - Public administration (%)
Occupation diversity
Most Common Occupations - Management, business, science, and arts occupations (%)
Most Common Occupations - Management, business, and financial occupations (%)
Most Common Occupations - Management occupations (%)
Most Common Occupations - Business and financial operations occupations (%)
Most Common Occupations - Computer, engineering, and science occupations (%)
Most Common Occupations - Computer and mathematical occupations (%)
Most Common Occupations - Architecture and engineering occupations (%)
Most Common Occupations - Life, physical, and social science occupations (%)
Most Common Occupations - Education, legal, community service, arts, and media occupations (%)
Most Common Occupations - Community and social service occupations (%)
Most Common Occupations - Legal occupations (%)
Most Common Occupations - Education, training, and library occupations (%)
Most Common Occupations - Arts, design, entertainment, sports, and media occupations (%)
Most Common Occupations - Healthcare practitioners and technical occupations (%)
Most Common Occupations - Health diagnosing and treating practitioners and other technical occupations (%)
Most Common Occupations - Health technologists and technicians (%)
Most Common Occupations - Service occupations (%)
Most Common Occupations - Healthcare support occupations (%)
Most Common Occupations - Protective service occupations (%)
Most Common Occupations - Fire fighting and prevention, and other protective service workers including supervisors (%)
Most Common Occupations - Law enforcement workers including supervisors (%)
Most Common Occupations - Food preparation and serving related occupations (%)
Most Common Occupations - Building and grounds cleaning and maintenance occupations (%)
Most Common Occupations - Personal care and service occupations (%)
Most Common Occupations - Sales and office occupations (%)
Most Common Occupations - Sales and related occupations (%)
Most Common Occupations - Office and administrative support occupations (%)
Most Common Occupations - Natural resources, construction, and maintenance occupations (%)
Most Common Occupations - Farming, fishing, and forestry occupations (%)
Most Common Occupations - Construction and extraction occupations (%)
Most Common Occupations - Installation, maintenance, and repair occupations (%)
Most Common Occupations - Production, transportation, and material moving occupations (%)
Most Common Occupations - Production occupations (%)
Most Common Occupations - Transportation occupations (%)
Most Common Occupations - Material moving occupations (%)
People in Group quarters - Institutionalized population (%)
People in Group quarters - Correctional institutions (%)
People in Group quarters - Federal prisons and detention centers (%)
People in Group quarters - Halfway houses (%)
People in Group quarters - Local jails and other confinement facilities (including police lockups) (%)
People in Group quarters - Military disciplinary barracks (%)
People in Group quarters - State prisons (%)
People in Group quarters - Other types of correctional institutions (%)
People in Group quarters - Nursing homes (%)
People in Group quarters - Hospitals/wards, hospices, and schools for the handicapped (%)
People in Group quarters - Hospitals/wards and hospices for chronically ill (%)
People in Group quarters - Hospices or homes for chronically ill (%)
People in Group quarters - Military hospitals or wards for chronically ill (%)
People in Group quarters - Other hospitals or wards for chronically ill (%)
People in Group quarters - Hospitals or wards for drug/alcohol abuse (%)
People in Group quarters - Mental (Psychiatric) hospitals or wards (%)
People in Group quarters - Schools, hospitals, or wards for the mentally retarded (%)
People in Group quarters - Schools, hospitals, or wards for the physically handicapped (%)
People in Group quarters - Institutions for the deaf (%)
People in Group quarters - Institutions for the blind (%)
People in Group quarters - Orthopedic wards and institutions for the physically handicapped (%)
People in Group quarters - Wards in general hospitals for patients who have no usual home elsewhere (%)
People in Group quarters - Wards in military hospitals for patients who have no usual home elsewhere (%)
People in Group quarters - Juvenile institutions (%)
People in Group quarters - Long-term care (%)
People in Group quarters - Homes for abused, dependent, and neglected children (%)
People in Group quarters - Residential treatment centers for emotionally disturbed children (%)
People in Group quarters - Training schools for juvenile delinquents (%)
People in Group quarters - Short-term care, detention or diagnostic centers for delinquent children (%)
People in Group quarters - Type of juvenile institution unknown (%)
People in Group quarters - Noninstitutionalized population (%)
People in Group quarters - College dormitories (includes college quarters off campus) (%)
People in Group quarters - Military quarters (%)
People in Group quarters - On base (%)
People in Group quarters - Barracks, unaccompanied personnel housing (UPH), (Enlisted/Officer), ;and similar group living quarters for military personnel (%)
People in Group quarters - Transient quarters for temporary residents (%)
People in Group quarters - Military ships (%)
People in Group quarters - Group homes (%)
People in Group quarters - Homes or halfway houses for drug/alcohol abuse (%)
People in Group quarters - Homes for the mentally ill (%)
People in Group quarters - Homes for the mentally retarded (%)
People in Group quarters - Homes for the physically handicapped (%)
People in Group quarters - Other group homes (%)
People in Group quarters - Religious group quarters (%)
People in Group quarters - Dormitories (%)
People in Group quarters - Agriculture workers' dormitories on farms (%)
People in Group quarters - Job Corps and vocational training facilities (%)
People in Group quarters - Other workers' dormitories (%)
People in Group quarters - Crews of maritime vessels (%)
People in Group quarters - Other nonhousehold living situations (%)
People in Group quarters - Other noninstitutional group quarters (%)
Residents speaking English at home (%)
Residents speaking English at home - Born in the United States (%)
Residents speaking English at home - Native, born elsewhere (%)
Residents speaking English at home - Foreign born (%)
Residents speaking Spanish at home (%)
Residents speaking Spanish at home - Born in the United States (%)
Residents speaking Spanish at home - Native, born elsewhere (%)
Residents speaking Spanish at home - Foreign born (%)
Residents speaking other language at home (%)
Residents speaking other language at home - Born in the United States (%)
Residents speaking other language at home - Native, born elsewhere (%)
Residents speaking other language at home - Foreign born (%)
Class of Workers - Employee of private company (%)
Class of Workers - Self-employed in own incorporated business (%)
Class of Workers - Private not-for-profit wage and salary workers (%)
Class of Workers - Local government workers (%)
Class of Workers - State government workers (%)
Class of Workers - Federal government workers (%)
Class of Workers - Self-employed workers in own not incorporated business and Unpaid family workers (%)
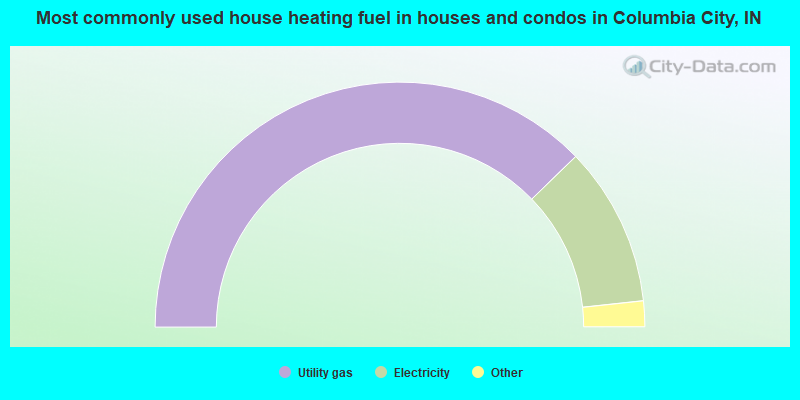
House heating fuel used in houses and condos - Utility gas (%)
House heating fuel used in houses and condos - Bottled, tank, or LP gas (%)
House heating fuel used in houses and condos - Electricity (%)
House heating fuel used in houses and condos - Fuel oil, kerosene, etc. (%)
House heating fuel used in houses and condos - Coal or coke (%)
House heating fuel used in houses and condos - Wood (%)
House heating fuel used in houses and condos - Solar energy (%)
House heating fuel used in houses and condos - Other fuel (%)
House heating fuel used in houses and condos - No fuel used (%)
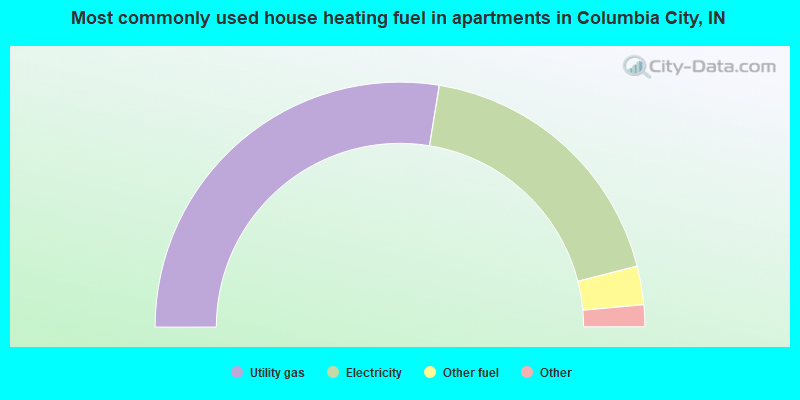
House heating fuel used in apartments - Utility gas (%)
House heating fuel used in apartments - Bottled, tank, or LP gas (%)
House heating fuel used in apartments - Electricity (%)
House heating fuel used in apartments - Fuel oil, kerosene, etc. (%)
House heating fuel used in apartments - Coal or coke (%)
House heating fuel used in apartments - Wood (%)
House heating fuel used in apartments - Solar energy (%)
House heating fuel used in apartments - Other fuel (%)
House heating fuel used in apartments - No fuel used (%)
Armed forces status - In Armed Forces (%)
Armed forces status - Civilian (%)
Armed forces status - Civilian - Veteran (%)
Armed forces status - Civilian - Nonveteran (%)
Fatal accidents locations in years 2005-2021
Fatal accidents locations in 2005
Fatal accidents locations in 2006
Fatal accidents locations in 2007
Fatal accidents locations in 2008
Fatal accidents locations in 2009
Fatal accidents locations in 2010
Fatal accidents locations in 2011
Fatal accidents locations in 2012
Fatal accidents locations in 2013
Fatal accidents locations in 2014
Fatal accidents locations in 2015
Fatal accidents locations in 2016
Fatal accidents locations in 2017
Fatal accidents locations in 2018
Fatal accidents locations in 2019
Fatal accidents locations in 2020
Fatal accidents locations in 2021
Alcohol use - People drinking some alcohol every month (%)
Alcohol use - People not drinking at all (%)
Alcohol use - Average days/month drinking alcohol
Alcohol use - Average drinks/week
Alcohol use - Average days/year people drink much
Audiometry - Average condition of hearing (%)
Audiometry - People that can hear a whisper from across a quiet room (%)
Audiometry - People that can hear normal voice from across a quiet room (%)
Audiometry - Ears ringing, roaring, buzzing (%)
Audiometry - Had a job exposure to loud noise (%)
Audiometry - Had off-work exposure to loud noise (%)
Blood Pressure & Cholesterol - Has high blood pressure (%)
Blood Pressure & Cholesterol - Checking blood pressure at home (%)
Blood Pressure & Cholesterol - Frequently checking blood cholesterol (%)
Blood Pressure & Cholesterol - Has high cholesterol level (%)
Consumer Behavior - Money monthly spent on food at supermarket/grocery store
Consumer Behavior - Money monthly spent on food at other stores
Consumer Behavior - Money monthly spent on eating out
Consumer Behavior - Money monthly spent on carryout/delivered foods
Consumer Behavior - Income spent on food at supermarket/grocery store (%)
Consumer Behavior - Income spent on food at other stores (%)
Consumer Behavior - Income spent on eating out (%)
Consumer Behavior - Income spent on carryout/delivered foods (%)
Current Health Status - General health condition (%)
Current Health Status - Blood donors (%)
Current Health Status - Has blood ever tested for HIV virus (%)
Current Health Status - Left-handed people (%)
Dermatology - People using sunscreen (%)
Diabetes - Diabetics (%)
Diabetes - Had a blood test for high blood sugar (%)
Diabetes - People taking insulin (%)
Diet Behavior & Nutrition - Diet health (%)
Diet Behavior & Nutrition - Milk product consumption (# of products/month)
Diet Behavior & Nutrition - Meals not home prepared (#/week)
Diet Behavior & Nutrition - Meals from fast food or pizza place (#/week)
Diet Behavior & Nutrition - Ready-to-eat foods (#/month)
Diet Behavior & Nutrition - Frozen meals/pizza (#/month)
Drug Use - People that ever used marijuana or hashish (%)
Drug Use - Ever used hard drugs (%)
Drug Use - Ever used any form of cocaine (%)
Drug Use - Ever used heroin (%)
Drug Use - Ever used methamphetamine (%)
Health Insurance - People covered by health insurance (%)
Kidney Conditions-Urology - Avg. # of times urinating at night
Medical Conditions - People with asthma (%)
Medical Conditions - People with anemia (%)
Medical Conditions - People with psoriasis (%)
Medical Conditions - People with overweight (%)
Medical Conditions - Elderly people having difficulties in thinking or remembering (%)
Medical Conditions - People who ever received blood transfusion (%)
Medical Conditions - People having trouble seeing even with glass/contacts (%)
Medical Conditions - People with arthritis (%)
Medical Conditions - People with gout (%)
Medical Conditions - People with congestive heart failure (%)
Medical Conditions - People with coronary heart disease (%)
Medical Conditions - People with angina pectoris (%)
Medical Conditions - People who ever had heart attack (%)
Medical Conditions - People who ever had stroke (%)
Medical Conditions - People with emphysema (%)
Medical Conditions - People with thyroid problem (%)
Medical Conditions - People with chronic bronchitis (%)
Medical Conditions - People with any liver condition (%)
Medical Conditions - People who ever had cancer or malignancy (%)
Mental Health - People who have little interest in doing things (%)
Mental Health - People feeling down, depressed, or hopeless (%)
Mental Health - People who have trouble sleeping or sleeping too much (%)
Mental Health - People feeling tired or having little energy (%)
Mental Health - People with poor appetite or overeating (%)
Mental Health - People feeling bad about themself (%)
Mental Health - People who have trouble concentrating on things (%)
Mental Health - People moving or speaking slowly or too fast (%)
Mental Health - People having thoughts they would be better off dead (%)
Oral Health - Average years since last visit a dentist
Oral Health - People embarrassed because of mouth (%)
Oral Health - People with gum disease (%)
Oral Health - General health of teeth and gums (%)
Oral Health - Average days a week using dental floss/device
Oral Health - Average days a week using mouthwash for dental problem
Oral Health - Average number of teeth
Pesticide Use - Households using pesticides to control insects (%)
Pesticide Use - Households using pesticides to kill weeds (%)
Physical Activity - People doing vigorous-intensity work activities (%)
Physical Activity - People doing moderate-intensity work activities (%)
Physical Activity - People walking or bicycling (%)
Physical Activity - People doing vigorous-intensity recreational activities (%)
Physical Activity - People doing moderate-intensity recreational activities (%)
Physical Activity - Average hours a day doing sedentary activities
Physical Activity - Average hours a day watching TV or videos
Physical Activity - Average hours a day using computer
Physical Functioning - People having limitations keeping them from working (%)
Physical Functioning - People limited in amount of work they can do (%)
Physical Functioning - People that need special equipment to walk (%)
Physical Functioning - People experiencing confusion/memory problems (%)
Physical Functioning - People requiring special healthcare equipment (%)
Prescription Medications - Average number of prescription medicines taking
Preventive Aspirin Use - Adults 40+ taking low-dose aspirin (%)
Reproductive Health - Vaginal deliveries (%)
Reproductive Health - Cesarean deliveries (%)
Reproductive Health - Deliveries resulted in a live birth (%)
Reproductive Health - Pregnancies resulted in a delivery (%)
Reproductive Health - Women breastfeeding newborns (%)
Reproductive Health - Women that had a hysterectomy (%)
Reproductive Health - Women that had both ovaries removed (%)
Reproductive Health - Women that have ever taken birth control pills (%)
Reproductive Health - Women taking birth control pills (%)
Reproductive Health - Women that have ever used Depo-Provera or injectables (%)
Reproductive Health - Women that have ever used female hormones (%)
Sexual Behavior - People 18+ that ever had sex (vaginal, anal, or oral) (%)
Sexual Behavior - Males 18+ that ever had vaginal sex with a woman (%)
Sexual Behavior - Males 18+ that ever performed oral sex on a woman (%)
Sexual Behavior - Males 18+ that ever had anal sex with a woman (%)
Sexual Behavior - Males 18+ that ever had any sex with a man (%)
Sexual Behavior - Females 18+ that ever had vaginal sex with a man (%)
Sexual Behavior - Females 18+ that ever performed oral sex on a man (%)
Sexual Behavior - Females 18+ that ever had anal sex with a man (%)
Sexual Behavior - Females 18+ that ever had any kind of sex with a woman (%)
Sexual Behavior - Average age people first had sex
Sexual Behavior - Average number of female sex partners in lifetime (males 18+)
Sexual Behavior - Average number of female vaginal sex partners in lifetime (males 18+)
Sexual Behavior - Average age people first performed oral sex on a woman (18+)
Sexual Behavior - Average number of woman performed oral sex on in lifetime (18+)
Sexual Behavior - Average number of male sex partners in lifetime (males 18+)
Sexual Behavior - Average number of male anal sex partners in lifetime (males 18+)
Sexual Behavior - Average age people first performed oral sex on a man (18+)
Sexual Behavior - Average number of male oral sex partners in lifetime (18+)
Sexual Behavior - People using protection when performing oral sex (%)
Sexual Behavior - Average number of times people have vaginal or anal sex a year
Sexual Behavior - People having sex without condom (%)
Sexual Behavior - Average number of male sex partners in lifetime (females 18+)
Sexual Behavior - Average number of male vaginal sex partners in lifetime (females 18+)
Sexual Behavior - Average number of female sex partners in lifetime (females 18+)
Sexual Behavior - Circumcised males 18+ (%)
Sleep Disorders - Average hours sleeping at night
Sleep Disorders - People that has trouble sleeping (%)
Smoking-Cigarette Use - People smoking cigarettes (%)
Taste & Smell - People 40+ having problems with smell (%)
Taste & Smell - People 40+ having problems with taste (%)
Taste & Smell - People 40+ that ever had wisdom teeth removed (%)
Taste & Smell - People 40+ that ever had tonsils teeth removed (%)
Taste & Smell - People 40+ that ever had a loss of consciousness because of a head injury (%)
Taste & Smell - People 40+ that ever had a broken nose or other serious injury to face or skull (%)
Taste & Smell - People 40+ that ever had two or more sinus infections (%)
Weight - Average height (inches)
Weight - Average weight (pounds)
Weight - Average BMI
Weight - People that are obese (%)
Weight - People that ever were obese (%)
Weight - People trying to lose weight (%)
Officers per 1,000 residents here:
2.32Indiana average:
2.16
Latest news from Columbia City, IN collected exclusively by city-data.com from local newspapers, TV, and radio stations
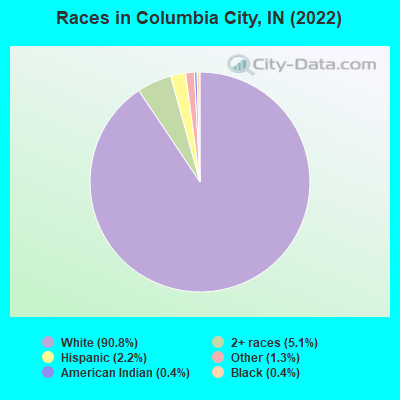
Ancestries: German (35.8%), European (16.0%), American (13.4%), English (5.7%), Irish (2.4%), Scottish (1.7%).
Current Local Time:
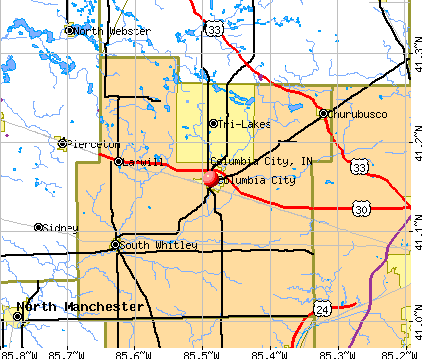
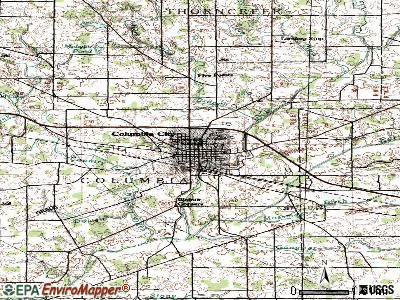
Land area: 5.21 square miles.
Population density: 1,938 people per square mile (low).
172 residents are foreign born
This city:
1.8%Indiana:
5.6%
Median real estate property taxes paid for housing units with mortgages in 2022: $1,281 (0.7%)Median real estate property taxes paid for housing units with no mortgage in 2022: $1,201 (0.7%)
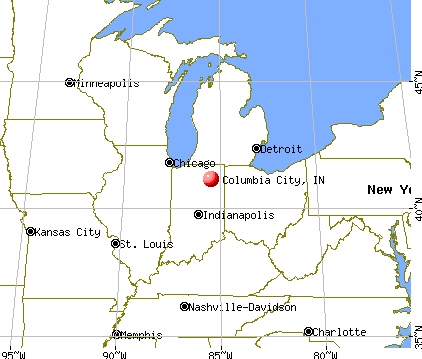
Nearest city with pop. 50,000+: Fort Wayne, IN
Nearest city with pop. 1,000,000+: Chicago, IL
Nearest cities:
Sidney, IN (3.7 miles),
Latitude: 41.16 N, Longitude: 85.49 W
Daytime population change due to commuting: +392 (+4.1%)Workers who live and work in this city: 1,550 (32.9%)
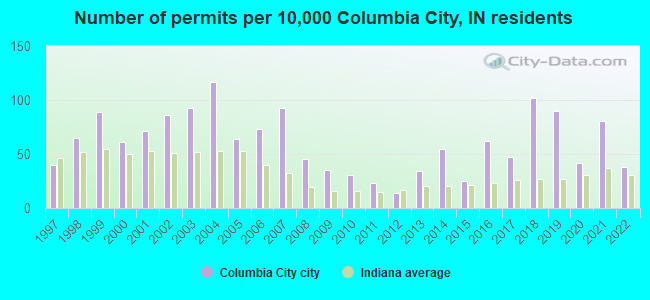
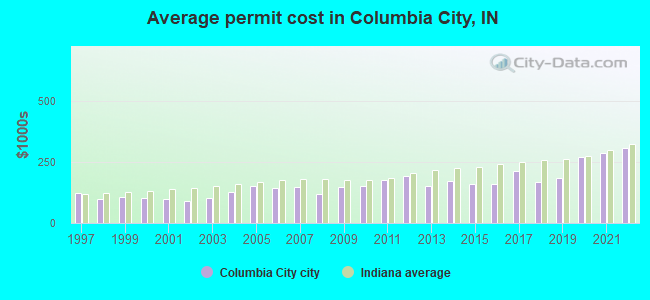
Single-family new house construction building permits:
2022: 27 buildings , average cost: $309,6002021: 57 buildings , average cost: $285,5002020: 30 buildings , average cost: $272,2002019: 64 buildings , average cost: $184,1002018: 72 buildings , average cost: $168,6002017: 33 buildings , average cost: $211,7002016: 44 buildings , average cost: $161,0002015: 18 buildings , average cost: $158,8002014: 39 buildings , average cost: $171,8002013: 24 buildings , average cost: $152,3002012: 10 buildings , average cost: $193,7002011: 16 buildings , average cost: $174,6002010: 22 buildings , average cost: $150,8002009: 25 buildings , average cost: $149,2002008: 32 buildings , average cost: $120,5002007: 66 buildings , average cost: $146,8002006: 52 buildings , average cost: $142,3002005: 45 buildings , average cost: $152,4002004: 83 buildings , average cost: $126,8002003: 66 buildings , average cost: $102,1002002: 61 buildings , average cost: $88,5002001: 50 buildings , average cost: $97,4002000: 43 buildings , average cost: $101,1001999: 63 buildings , average cost: $105,7001998: 46 buildings , average cost: $98,0001997: 28 buildings , average cost: $124,200Unemployment in December 2023:
Population change in the 1990s: +1,008 (+16.6%).
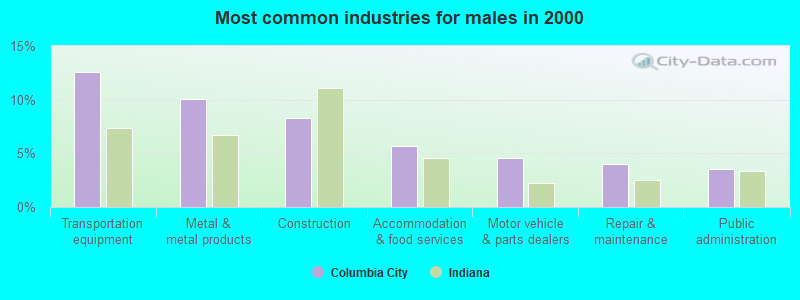
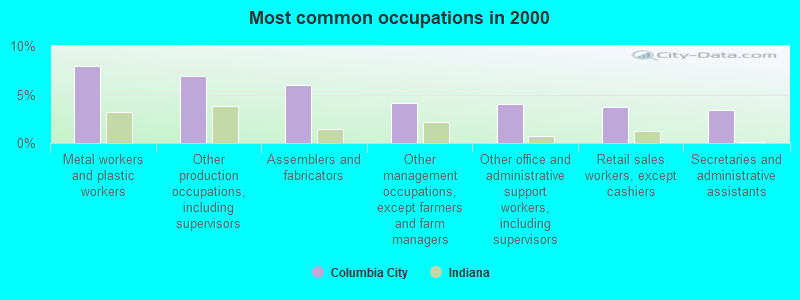
Most common occupations in Columbia City, IN (%)
Both Males Females
Metal workers and plastic workers (8.0%)
Other production occupations, including supervisors (6.9%)
Assemblers and fabricators (6.0%)
Other management occupations, except farmers and farm managers (4.2%)
Other office and administrative support workers, including supervisors (4.1%)
Retail sales workers, except cashiers (3.7%)
Secretaries and administrative assistants (3.4%)
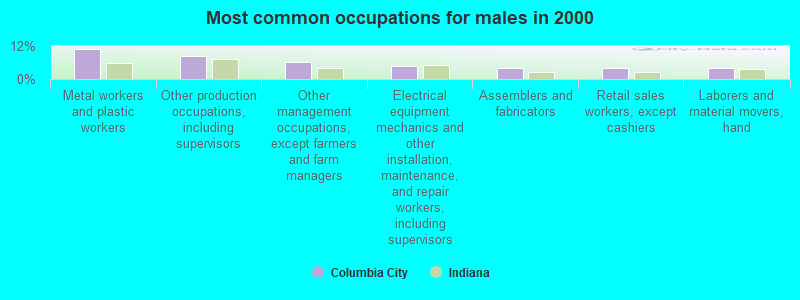
Metal workers and plastic workers (11.0%)
Other production occupations, including supervisors (8.5%)
Other management occupations, except farmers and farm managers (6.1%)
Electrical equipment mechanics and other installation, maintenance, and repair workers, including supervisors (4.7%)
Assemblers and fabricators (4.1%)
Retail sales workers, except cashiers (3.9%)
Laborers and material movers, hand (3.9%)
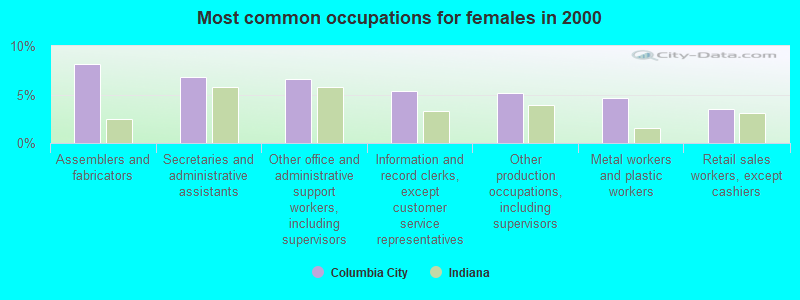
Assemblers and fabricators (8.1%)
Secretaries and administrative assistants (6.9%)
Other office and administrative support workers, including supervisors (6.6%)
Information and record clerks, except customer service representatives (5.4%)
Other production occupations, including supervisors (5.1%)
Metal workers and plastic workers (4.6%)
Retail sales workers, except cashiers (3.5%)
Tornado activity:
Columbia City-area historical tornado activity is near Indiana state average. It is 82% greater than the overall U.S. average.
On 4/3/1974, a category F4 (max. wind speeds 207-260 mph) tornado 29.3 miles away from the Columbia City city center killed 18 people and injured 285 people and caused between $50,000,000 and $500,000,000 in damages.
On 4/11/1965, a category F4 tornado 33.8 miles away from the city center killed 5 people and injured 41 people and caused between $50,000 and $500,000 in damages.
Earthquake activity:
Columbia City-area historical earthquake activity is significantly above Indiana state average. It is 6% greater than the overall U.S. average. On 4/18/2008 at 09:36:59, a magnitude 5.4 (5.1 MB, 4.8 MS, 5.4 MW, 5.2 MW, Class: Moderate, Intensity: VI - VII) earthquake occurred 226.4 miles away from Columbia City center On 7/12/1986 at 08:19:37, a magnitude 4.5 (4.5 MB, Class: Light, Intensity: IV - V) earthquake occurred 72.5 miles away from the city center On 7/27/1980 at 18:52:21, a magnitude 5.2 (5.1 MB, 4.7 MS, 5.0 UK, 5.2 UK) earthquake occurred 220.2 miles away from the city center On 6/10/1987 at 23:48:54, a magnitude 5.1 (4.9 MB, 4.4 MS, 4.6 MS, 5.1 LG) earthquake occurred 205.6 miles away from the city center On 4/18/2008 at 09:36:59, a magnitude 5.2 (5.2 MW, Depth: 8.9 mi) earthquake occurred 226.5 miles away from the city center On 1/31/1986 at 16:46:43, a magnitude 5.0 (5.0 MB) earthquake occurred 226.7 miles away from Columbia City center Magnitude types: regional Lg-wave magnitude (LG), body-wave magnitude (MB), surface-wave magnitude (MS), moment magnitude (MW) Natural disasters: The number of natural disasters in Whitley County (13) is near the US average (15).Major Disasters (Presidential) Declared: 7Emergencies Declared: 5Floods: 6, Storms: 4, Winter Storms: 4, Tornadoes: 3, Snowstorms: 2, Hurricane: 1, Snow: 1, Other: 1 (Note: some incidents may be assigned to more than one category). Hospitals in Columbia City: PARKVIEW HOME HEALTH AND HOSPICE (105 NORTH MADISON) PARKVIEW WHITLEY HOSPITAL (Voluntary non-profit - Private, 1260 E SR 205) PASSAGES INC (343 WESTON DR) VOCA CORPORATION OF INDIANA (810 CARLYLE ST) VOCA CORPORATION OF INDIANA (395 N WESTCHESTER DR) Nursing Homes in Columbia City: COLUMBIA CITY COM CARE CENTER (ROUTE 9) COLUMBIA CITY NURSING HOME (522 NORTH LINE STREET) HICKORY CREEK AT COLUMBIA CITY (522 NORTH LINE ST) MILLER'S MERRY MANOR (640 W ELLSWORTH ST) MILLERS MERRY MANOR INC (RR 1 710 W ELLSWORTH EXTENSION) PARKVIEW OAKS (411 N WOLF RD) Colleges/universities with over 2000 students nearest to Columbia City:
University of Saint Francis-Fort Wayne (about 18 miles; Fort Wayne, IN ; Full-time enrollment: 2,075)
Indiana University-Purdue University-Fort Wayne (about 20 miles; Fort Wayne, IN ; FT enrollment: 10,126)
Indiana Institute of Technology (about 21 miles; Fort Wayne, IN ; FT enrollment: 4,320)
Indiana Wesleyan University (about 46 miles; Marion, IN ; FT enrollment: 13,681)
Taylor University (about 49 miles; Upland, IN ; FT enrollment: 2,272)
Indiana University-South Bend (about 52 miles; South Bend, IN ; FT enrollment: 5,563)
University of Notre Dame (about 55 miles; Notre Dame, IN ; FT enrollment: 12,214)
Public high school in Columbia City:
Public elementary/middle schools in Columbia City: INDIAN SPRINGS MIDDLE SCH Students: 833, Location: 1692 S SR 9, Grades: 6-8)NORTHERN HEIGHTS ELEMENTARY SCH Students: 495, Location: 5209 N SR 109, Grades: KG-5)LITTLE TURTLE ELEMENTARY SCHOOL Students: 455, Location: 1710 S STATE RD 9, Grades: KG-5)MARY RABER ELEMENTARY SCHOOL Students: 401, Location: 700 E JACKSON ST, Grades: PK-5)COESSE SCHOOL Students: 322, Location: 2250 S 500 E, Grades: KG-5)Private elementary/middle school in Columbia City: FAITH CHRISTIAN ACADEMY Students: 42, Location: 1550 E STATE ROAD 205, Grades: PK-8)
See full list of schools located in Columbia City Library in Columbia City: PEABODY PUBLIC LIBRARY Operating income: $1,131,857; Location: 1160 EAST HIGHWAY 205; 88,132 books ; 2,132 e-books ; 5,758 audio materials ; 5,921 video materials ; 10 local licensed databases ; 37 state licensed databases ; 168 print serial subscriptions )
Notable locations in Columbia City: (A) , Columbia City Fire Department (B) . Display/hide their locations on the map
Streams, rivers, and creeks: (A) . Display/hide its location on the map
Parks in Columbia City include: (1) , Devol Field (2) . Display/hide their locations on the map
Tourist attraction:
Hotels:
Courts:
Birthplace of: Dave Herman (fighter) - Martial artist, Keller E. Rockey - Soilder.
Whitley County has a predicted average indoor radon screening level greater than 4 pCi/L (pico curies per liter) - Highest Potential Drinking water stations with addresses in Columbia City and their reported violations in the past:
COLUMBIA CITY WATER DEPARTMENT (Population served: 8,000, Groundwater):
Past health violations:
MCL, Acute (TCR) - In SEP-2012, Contaminant: Coliform. Follow-up actions: St Boil Water Order (SEP-10-2012), St Public Notif requested (SEP-10-2012), St Compliance achieved (SEP-10-2012), St Violation/Reminder Notice (SEP-10-2012), St Public Notif received (JUN-18-2013)
Population served: 300, Groundwater):
Past health violations:
MCL, Monthly (TCR) - In AUG-2007, Contaminant: Coliform. Follow-up actions: St Boil Water Order (AUG-20-2007), St Violation/Reminder Notice (AUG-20-2007), St Public Notif requested (AUG-20-2007), St Public Notif received (AUG-22-2007), St Compliance achieved (MAY-17-2010)
Past monitoring violations:
Follow-up Or Routine LCR Tap M/R - In OCT-10-2008, Contaminant: Lead and Copper Rule. Follow-up actions: St Public Notif requested (NOV-10-2008), St Violation/Reminder Notice (NOV-10-2008), St Public Notif received (NOV-16-2008), St Compliance achieved (OCT-05-2009)
One routine major monitoring violation
Population served: 201, Groundwater):
Past monitoring violations:
2 routine major monitoring violations
4 regular monitoring violations
Population served: 70, Groundwater):
Past health violations:
MCL, Monthly (TCR) - In SEP-2010, Contaminant: Coliform. Follow-up actions: St Public Notif requested (OCT-12-2010), St Violation/Reminder Notice (OCT-12-2010), St Boil Water Order (OCT-12-2010), St Compliance achieved (JAN-18-2011)
Past monitoring violations:
4 routine major monitoring violations
One minor monitoring violation
2 regular monitoring violations
Drinking water stations with addresses in Columbia City that have no violations reported:
PARKVIEW WHITLEY HOSPITAL (Population served: 25, Primary Water Source Type: Groundwater)
Average household size: This city:
2.3 peopleIndiana:
2.5 people
Percentage of family households: This city:
61.1%Whole state:
66.9%
Percentage of households with unmarried partners: This city:
7.8%Whole state:
6.9%
Likely homosexual households (counted as self-reported same-sex unmarried-partner households)
Lesbian couples: 0.4% of all households Gay men: 0.2% of all households
People in group quarters in Columbia City in 2010:
112 people in local jails and other municipal confinement facilities
64 people in nursing facilities/skilled-nursing facilities
58 people in correctional residential facilities
27 people in group homes intended for adults
4 people in emergency and transitional shelters (with sleeping facilities) for people experiencing homelessness
People in group quarters in Columbia City in 2000:
122 people in local jails and other confinement facilities (including police lockups)
89 people in nursing homes
24 people in homes for the mentally retarded
Banks with branches in Columbia City (2011 data):
Peoples Federal Savings Bank of DeKalb County: Columbia City Branch at 123-129 South Main Street, branch established on 1925/01/01; North Main Street Branch at 507 North Main Street, branch established on 1998/04/20. Info updated 2011/07/21: Bank assets: $484.6 mil, Deposits: $362.5 mil, headquarters in Auburn, IN, positive income , Mortgage Lending Specialization, 15 total offices
STAR Financial Bank: Columbia City Branch at 102 West Van Buren Street, branch established on 1929/01/01; Frontage Road Branch at 105 Frontage Road, branch established on 1991/07/29. Info updated 2006/11/03: Bank assets: $1,622.5 mil, Deposits: $1,346.4 mil, headquarters in Fort Wayne, IN, positive income , Commercial Lending Specialization, 48 total offices , Holding Company: Star Financial Group, Inc.
JPMorgan Chase Bank, National Association: Columbia City Banking Center Branch at 620 Countryside Drive, branch established on 2003/10/13. Info updated 2011/11/10: Bank assets: $1,811,678.0 mil, Deposits: $1,190,738.0 mil, headquarters in Columbus, OH, positive income , International Specialization, 5577 total offices , Holding Company: Jpmorgan Chase & Co.
1st Source Bank: Columbia City Walmart Branch at 404 West Plaza Drive, branch established on 1997/12/08. Info updated 2008/06/16: Bank assets: $4,361.6 mil, Deposits: $3,520.6 mil, headquarters in South Bend, IN, positive income , Commercial Lending Specialization, 79 total offices , Holding Company: 1st Source Corporation
Crossroads Bank: W Connexion Way Branch at 526 W. Connexion Way, branch established on 2006/06/30. Info updated 2011/07/21: Bank assets: $327.0 mil, Deposits: $280.0 mil, headquarters in Wabash, IN, positive income , 5 total offices
Lake City Bank: Columbia City Branch at Sr 9 And U.S. 30, branch established on 1986/02/17. Info updated 2006/05/11: Bank assets: $2,885.4 mil, Deposits: $2,413.2 mil, headquarters in Warsaw, IN, positive income , Commercial Lending Specialization, 45 total offices , Holding Company: Lakeland Financial Corporation
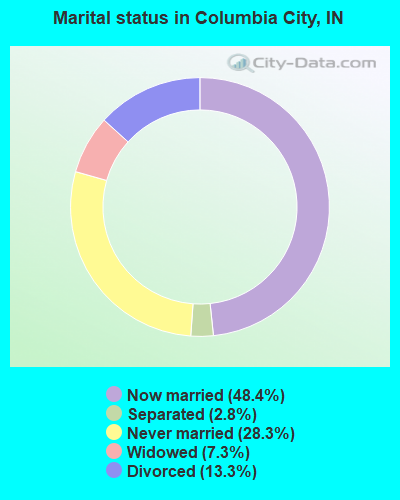
For population 15 years and over in Columbia City:
Never married: 28.3%Now married: 48.4%Separated: 2.8%Widowed: 7.3%Divorced: 13.3% For population 25 years and over in Columbia City:
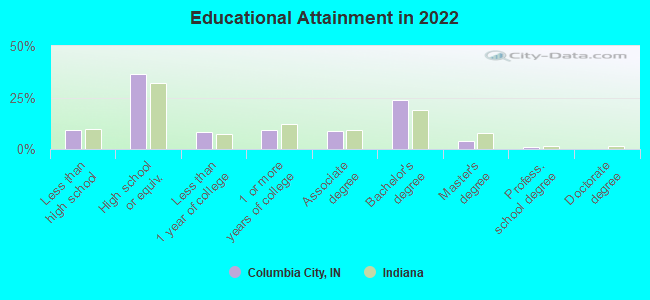
High school or higher: 90.5%Bachelor's degree or higher: 27.0%Graduate or professional degree: 4.4%Unemployed: 3.1%Mean travel time to work (commute): 17.5 minutes
Education Gini index (Inequality in education) Here:
9.2Indiana average:
11.3
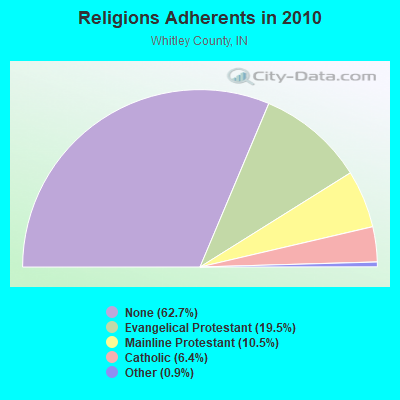
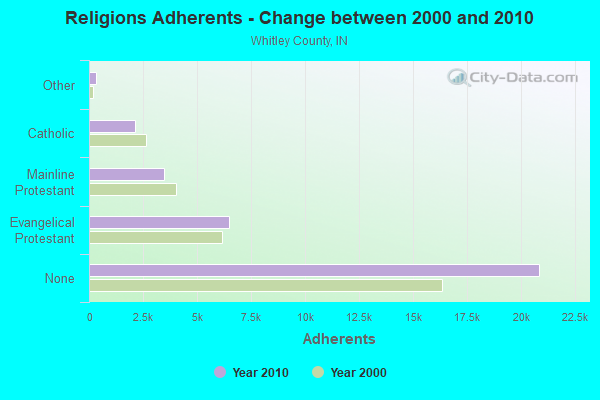
Religion statistics for Columbia City, IN (based on Whitley County data)
Religion Adherents Congregations Evangelical Protestant 6,493 41 Mainline Protestant 3,491 17 Catholic 2,120 3 Other 314 2 None 20,874 -
Source: Clifford Grammich, Kirk Hadaway, Richard Houseal, Dale E.Jones, Alexei Krindatch, Richie Stanley and Richard H.Taylor. 2012. 2010 U.S.Religion Census: Religious Congregations & Membership Study. Association of Statisticians of American Religious Bodies. Jones, Dale E., et al. 2002. Congregations and Membership in the United States 2000. Nashville, TN: Glenmary Research Center. Graphs represent county-level data
Food Environment Statistics: Number of grocery stores : 8Here :
2.46 / 10,000 pop.Indiana :
1.73 / 10,000 pop.
Number of supercenters and club stores : 1Here :
0.31 / 10,000 pop.State :
0.21 / 10,000 pop.
Number of convenience stores (with gas) : 11Here :
3.38 / 10,000 pop.Indiana :
3.57 / 10,000 pop.
Number of full-service restaurants : 24This county :
7.38 / 10,000 pop.Indiana :
6.78 / 10,000 pop.
Adult diabetes rate : This county :
9.2%Indiana :
9.2%
Adult obesity rate : Whitley County :
29.2%Indiana :
29.0%
Low-income preschool obesity rate : Health and Nutrition: Healthy diet rate : This city:
45.8%Indiana:
49.3%
Average overall health of teeth and gums : This city:
38.5%Indiana:
46.2%
Average BMI : Columbia City:
28.6Indiana:
28.7
People feeling badly about themselves : This city:
20.9%Indiana:
21.3%
People not drinking alcohol at all : Columbia City:
13.5%Indiana:
10.6%
Average hours sleeping at night : Overweight people : Columbia City:
33.0%Indiana:
33.9%
General health condition : This city:
51.2%Indiana:
56.1%
Average condition of hearing : More about Health and Nutrition of Columbia City, IN Residents
Local government employment and payroll (March 2022)
Function
Full-time employees
Monthly full-time payroll
Average yearly full-time wage
Part-time employees
Monthly part-time payroll
Other and Unallocable
23 $116,015 $60,530 0 $0 Police Protection - Officers
22 $118,052 $64,392 0 $0 Electric Power
11 $62,764 $68,470 2 $2,126 Firefighters
10 $68,331 $81,997 1 $853 Streets and Highways
9 $46,854 $62,472 0 $0 Other Government Administration
8 $17,772 $26,658 0 $0 Parks and Recreation
8 $37,264 $55,896 0 $0 Sewerage
7 $35,513 $60,879 1 $779 Water Supply
7 $41,091 $70,442 1 $797 Financial Administration
1 $6,738 $80,856 0 $0 Police - Other
0 $0 1 $724
Totals for Government
106 $550,394 $62,309 6 $5,279
Columbia City government finances - Expenditure in 2021 (per resident):
Construction - Sewerage: $11,906,000 ($1180.45)
General - Other: $1,000 ($0.10)Current Operations - Electric Utilities: $11,091,000 ($1099.64)
Sewerage: $2,129,000 ($211.08)Central Staff Services: $1,461,000 ($144.85)Police Protection: $1,327,000 ($131.57)General - Other: $1,184,000 ($117.39)Regular Highways: $1,129,000 ($111.94)Water Utilities: $1,014,000 ($100.54)Parks and Recreation: $849,000 ($84.18)Local Fire Protection: $612,000 ($60.68)Solid Waste Management: $415,000 ($41.15)Health - Other: $297,000 ($29.45)Housing and Community Development: $132,000 ($13.09)General Public Buildings: $89,000 ($8.82)Financial Administration: $24,000 ($2.38)Judicial and Legal Services: $15,000 ($1.49)Miscellaneous Commercial Activities - Other: $10,000 ($0.99)General - Interest on Debt: $2,226,000 ($220.70)
Other Capital Outlay - Central Staff Services: $92,000 ($9.12)
Local Fire Protection: $75,000 ($7.44)
Columbia City government finances - Revenue in 2021 (per resident):
Charges - Sewerage: $9,815,000 ($973.13)
Solid Waste Management: $336,000 ($33.31)Parks and Recreation: $170,000 ($16.86)Miscellaneous Commercial Activities: $20,000 ($1.98)Other: $18,000 ($1.78)Local Intergovernmental - Highways: $73,000 ($7.24)
Miscellaneous - Donations From Private Sources: $485,000 ($48.09)
Fines and Forfeits: $97,000 ($9.62)Rents: $20,000 ($1.98)Interest Earnings: $8,000 ($0.79)Revenue - Electric Utilities: $12,011,000 ($1190.86)
Water Utilities: $3,720,000 ($368.83)State Intergovernmental - Sewerage: $11,015,000 ($1092.11)
Other: $1,867,000 ($185.11)Highways: $1,315,000 ($130.38)General Local Government Support: $325,000 ($32.22)Electric Utilities: $1,000 ($0.10)Tax - Property: $2,191,000 ($217.23)
Public Utilities Sales: $49,000 ($4.86)Other License: $9,000 ($0.89)
Columbia City government finances - Debt in 2021 (per resident):
Long Term Debt - Beginning Outstanding - Unspecified Public Purpose: $23,587,000 ($2338.59)
Outstanding Unspecified Public Purpose: $23,587,000 ($2338.59)
Columbia City government finances - Cash and Securities in 2021 (per resident):
Bond Funds - Cash and Securities: $51,000 ($5.06)
Other Funds - Cash and Securities: $6,924,000 ($686.50)
Sinking Funds - Cash and Securities: $4,684,000 ($464.41)
Businesses in Columbia City, IN
Name Count Name Count
ALDI 1 Kroger 1 AT&T 1 La-Z-Boy 1 Ace Hardware 1 Lane Furniture 1 Advance Auto Parts 1 Long John Silver's 1 Arby's 1 McDonald's 1 AutoZone 1 New Balance 1 Burger King 1 Nike 1 CVS 1 Papa John's Pizza 1 Chevrolet 1 Pizza Hut 1 DHL 1 Quality 1 Dairy Queen 1 RadioShack 1 Dunkin Donuts 1 Sears 1 Fashion Bug 1 Subway 2 FedEx 3 T-Mobile 1 Ford 1 Taco Bell 1 GNC 1 U-Haul 1 Goodwill 1 UPS 4 H&R Block 2 Walgreens 1 Hardee's 1 Walmart 1 Jones New York 1 Wendy's 1 KFC 1 YMCA 1
Strongest AM radio stations in Columbia City:
WOWO (1190 AM; 50 kW; FORT WAYNE, IN; Owner: PATHFINDER COMMUNICATIONS CORPORATION)
WONO (1380 AM; 5 kW; FORT WAYNE, IN; Owner: PATHFINDER COMMUNICATIONS CORPORATION)
WIBC (1070 AM; 50 kW; INDIANAPOLIS, IN; Owner: EMMIS RADIO LICENSE CORPORATION)
WGL (1250 AM; 2 kW; FORT WAYNE, IN; Owner: TRAVIS BROADCASTING, LLC)
WFCV (1090 AM; daytime; 2 kW; FORT WAYNE, IN; Owner: BOTT BROADCASTING COMPANY)
WLW (700 AM; 50 kW; CINCINNATI, OH; Owner: JACOR BROADCASTING CORPORATION)
WLS (890 AM; 50 kW; CHICAGO, IL; Owner: WLS, INC.)
WFDF (910 AM; 50 kW; FLINT, MI; Owner: ABC, INC.)
WSCR (670 AM; 50 kW; CHICAGO, IL; Owner: INFINITY BROADCASTING OPERATIONS, INC.)
WJR (760 AM; 50 kW; DETROIT, MI; Owner: ABC, INC.)
WGN (720 AM; 50 kW; CHICAGO, IL; Owner: WGN CONTINENTAL BROADCASTING CO.)
WMSH-FM (99 AM; 1 kW; STURGIS, MI; Owner: LAKE CITIES BROADCASTING CORPORATION)
WBBM (780 AM; 50 kW; CHICAGO, IL; Owner: INFINITY BROADCASTING OPERATIONS, INC.)
Strongest FM radio stations in Columbia City:
WJHS (91.5 FM; COLUMBIA CITY, IN; Owner: COLUMBIA CITY JOINT HIGH SCHOOL)
WSHI (106.3 FM; COLUMBIA CITY, IN; Owner: JAMMIN' BROADCASTING, LLC)
WMEE (97.3 FM; FORT WAYNE, IN; Owner: PATHFINDER COMMUNICATIONS CORPORATION)
WBCL (90.3 FM; FORT WAYNE, IN; Owner: TAYLOR UNIVERSITY BROADCASTING, INC.)
WLAB (88.3 FM; FORT WAYNE, IN; Owner: INDIANA DISTTRICT OF THE LUTHERAN CHURCH - MO SYNOD, INC.)
WAJI (95.1 FM; FORT WAYNE, IN; Owner: SARKES TARZIAN, INC.)
WBNI-FM (89.1 FM; FORT WAYNE, IN; Owner: PUBLIC BROADCASTING OF NE IN., INC.)
WFWI (92.3 FM; FORT WAYNE, IN; Owner: PATHFINDER COMMUNICATIONS CORPORATION)
WNHT (96.3 FM; CHURUBUSCO, IN; Owner: TRAVIS BROADCASTING, LLC)
WLZQ (101.1 FM; SOUTH WHITLEY, IN; Owner: LARKO COMMUNICATIONS INC)
WBTU (93.3 FM; KENDALLVILLE, IN; Owner: ARTISTIC MEDIA PARTNERS, INC.)
WCKZ (94.1 FM; ROANOKE, IN; Owner: TRAVIS BROADCASTING, LLC)
WYLT (103.9 FM; FORT WAYNE, IN; Owner: TAVIS BROADCASTING, LLC)
W277AK (103.3 FM; FORT WAYNE, IN; Owner: CSN INTERNATIONAL)
WXKE (102.9 FM; HUNTINGTON, IN; Owner: TAVIS BROADCASTING, LLC)
WAWC (103.5 FM; SYRACUSE, IN; Owner: WILLIAM ANDREW DIXON)
WLEG (102.7 FM; LIGONIER, IN; Owner: PATHFINDER COMMUNICATIONS CORPORATION)
WJFX (107.9 FM; NEW HAVEN, IN; Owner: FORT WAYNE RADIO CORP.)
WCYT (91.1 FM; LAFAYETTE TOWNSHIP, IN; Owner: SOUTHWEST ALLEN COUNTY SCHOOLS)
WLDE (101.7 FM; FORT WAYNE, IN; Owner: SARKES TARZIAN, INC.)
TV broadcast stations around Columbia City:
WFFT-TV (Channel 55; FORT WAYNE, IN; Owner: QUOROM OF FT. WAYNE LICENSE, LLC)
WANE-TV (Channel 15; FORT WAYNE, IN; Owner: INDIANA BROADCASTING, LLC)
WPTA (Channel 21; FORT WAYNE, IN; Owner: WPTA-TV LICENSE, INC.)
WFWA (Channel 39; FORT WAYNE, IN; Owner: FORT WAYNE PUBLIC TELEVISION, INC.)
WISE-TV (Channel 33; FORT WAYNE, IN; Owner: NVG-FORT WAYNE II, LLC)
W66BD (Channel 53; FORT WAYNE, IN; Owner: TRI-STATE CHRISTIAN TELEVISION)
W45AG (Channel 45; FORT WAYNE, IN; Owner: TRAN STAR, INC.)
DW68BN (Channel 68; FORT WAYNE, IN; Owner: ZONATION BROADCASTING)
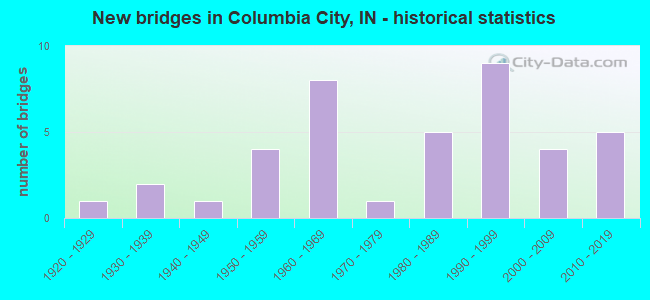
National Bridge Inventory (NBI) Statistics 40 Number of bridges312ft / 94.6m Total length $960,000 Total costs129,708 Total average daily traffic23,486 Total average daily truck traffic
New bridges - historical statistics
1 1920-1929 2 1930-1939 1 1940-1949 4 1950-1959 8 1960-1969 1 1970-1979 5 1980-1989 9 1990-1999 4 2000-2009 5 2010-2019
See full National Bridge Inventory statistics for Columbia City, IN
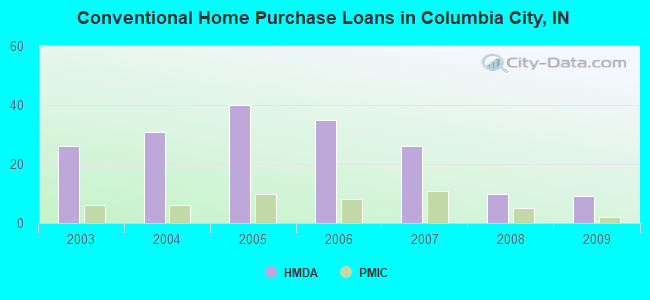
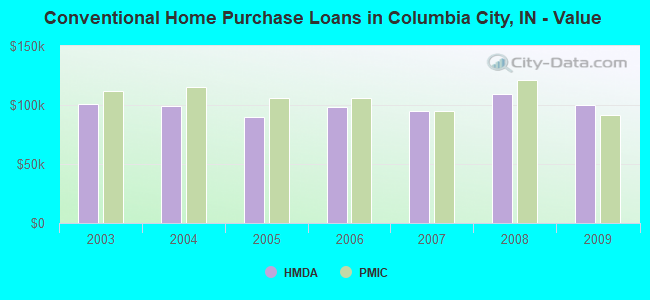
Home Mortgage Disclosure Act Aggregated Statistics For Year 2009(Based on 1 partial tract) A) FHA, FSA/RHS & VA B) Conventional C) Refinancings D) Home Improvement Loans F) Non-occupant Loans on G) Loans On Manufactured Number Average Value Number Average Value Number Average Value Number Average Value Number Average Value Number Average Value
LOANS ORIGINATED 11 $97,746 9 $100,060 40 $112,855 2 $62,680 2 $95,295 0 $0 APPLICATIONS APPROVED, NOT ACCEPTED 0 $0 0 $0 4 $107,842 0 $0 0 $0 0 $0 APPLICATIONS DENIED 2 $101,595 3 $56,013 10 $109,688 1 $12,160 0 $0 2 $25,870 APPLICATIONS WITHDRAWN 1 $73,180 1 $85,570 5 $142,300 0 $0 1 $44,660 0 $0 FILES CLOSED FOR INCOMPLETENESS 0 $0 0 $0 4 $109,998 0 $0 0 $0 0 $0
Aggregated Statistics For Year 2008(Based on 1 partial tract) A) FHA, FSA/RHS & VA B) Conventional C) Refinancings D) Home Improvement Loans F) Non-occupant Loans on G) Loans On Manufactured Number Average Value Number Average Value Number Average Value Number Average Value Number Average Value Number Average Value
LOANS ORIGINATED 6 $103,033 10 $109,334 20 $104,060 2 $24,765 1 $86,010 1 $13,040 APPLICATIONS APPROVED, NOT ACCEPTED 0 $0 2 $86,230 2 $101,595 0 $0 0 $0 0 $0 APPLICATIONS DENIED 1 $58,810 3 $104,727 11 $104,460 2 $45,105 1 $102,810 2 $26,865 APPLICATIONS WITHDRAWN 0 $0 0 $0 7 $133,829 1 $33,610 0 $0 0 $0 FILES CLOSED FOR INCOMPLETENESS 0 $0 0 $0 1 $121,380 0 $0 0 $0 0 $0
Aggregated Statistics For Year 2007(Based on 1 partial tract) A) FHA, FSA/RHS & VA B) Conventional C) Refinancings D) Home Improvement Loans F) Non-occupant Loans on G) Loans On Manufactured Number Average Value Number Average Value Number Average Value Number Average Value Number Average Value Number Average Value
LOANS ORIGINATED 3 $98,390 26 $94,877 17 $91,224 6 $37,513 2 $100,380 1 $38,250 APPLICATIONS APPROVED, NOT ACCEPTED 0 $0 4 $90,982 3 $86,450 1 $8,180 0 $0 0 $0 APPLICATIONS DENIED 0 $0 4 $69,868 14 $109,729 2 $18,795 1 $74,510 1 $52,180 APPLICATIONS WITHDRAWN 0 $0 2 $99,165 6 $104,102 0 $0 0 $0 0 $0 FILES CLOSED FOR INCOMPLETENESS 0 $0 0 $0 2 $91,980 0 $0 0 $0 0 $0
Aggregated Statistics For Year 2006(Based on 1 partial tract) A) FHA, FSA/RHS & VA B) Conventional C) Refinancings D) Home Improvement Loans F) Non-occupant Loans on G) Loans On Manufactured Number Average Value Number Average Value Number Average Value Number Average Value Number Average Value Number Average Value
LOANS ORIGINATED 4 $93,415 35 $98,585 21 $81,880 5 $27,504 4 $76,832 1 $41,790 APPLICATIONS APPROVED, NOT ACCEPTED 0 $0 5 $85,964 3 $68,100 1 $30,290 1 $35,820 0 $0 APPLICATIONS DENIED 1 $73,630 4 $117,958 19 $90,744 2 $69,535 2 $52,180 2 $41,015 APPLICATIONS WITHDRAWN 0 $0 4 $117,350 9 $102,344 1 $36,920 0 $0 0 $0 FILES CLOSED FOR INCOMPLETENESS 0 $0 2 $89,435 3 $91,313 0 $0 0 $0 0 $0
Aggregated Statistics For Year 2005(Based on 1 partial tract) A) FHA, FSA/RHS & VA B) Conventional C) Refinancings D) Home Improvement Loans F) Non-occupant Loans on G) Loans On Manufactured Number Average Value Number Average Value Number Average Value Number Average Value Number Average Value Number Average Value
LOANS ORIGINATED 4 $96,675 40 $89,418 33 $88,929 4 $37,035 6 $61,982 2 $65,775 APPLICATIONS APPROVED, NOT ACCEPTED 1 $113,420 3 $71,783 5 $100,512 1 $60,140 1 $36,480 1 $39,130 APPLICATIONS DENIED 0 $0 6 $79,448 21 $96,168 3 $29,553 1 $125,580 3 $51,147 APPLICATIONS WITHDRAWN 1 $79,150 1 $113,200 13 $98,135 1 $51,300 0 $0 1 $115,640 FILES CLOSED FOR INCOMPLETENESS 0 $0 4 $81,200 2 $103,145 0 $0 0 $0 0 $0
Aggregated Statistics For Year 2004(Based on 1 partial tract) A) FHA, FSA/RHS & VA B) Conventional C) Refinancings D) Home Improvement Loans F) Non-occupant Loans on G) Loans On Manufactured Number Average Value Number Average Value Number Average Value Number Average Value Number Average Value Number Average Value
LOANS ORIGINATED 4 $106,848 31 $99,067 33 $90,631 3 $36,113 4 $75,728 2 $42,670 APPLICATIONS APPROVED, NOT ACCEPTED 0 $0 4 $91,480 5 $87,334 0 $0 0 $0 1 $10,390 APPLICATIONS DENIED 1 $53,950 6 $85,492 20 $84,494 3 $25,133 1 $88,660 2 $63,015 APPLICATIONS WITHDRAWN 0 $0 4 $90,320 14 $101,011 0 $0 0 $0 0 $0 FILES CLOSED FOR INCOMPLETENESS 0 $0 2 $110,770 2 $126,580 0 $0 0 $0 0 $0
Aggregated Statistics For Year 2003(Based on 1 partial tract) A) FHA, FSA/RHS & VA B) Conventional C) Refinancings D) Home Improvement Loans F) Non-occupant Loans on Number Average Value Number Average Value Number Average Value Number Average Value Number Average Value
LOANS ORIGINATED 7 $88,250 26 $100,822 78 $90,081 4 $16,748 2 $79,375 APPLICATIONS APPROVED, NOT ACCEPTED 0 $0 2 $70,310 8 $88,799 2 $45,435 1 $20,340 APPLICATIONS DENIED 1 $74,290 5 $78,800 24 $86,874 2 $14,150 0 $0 APPLICATIONS WITHDRAWN 0 $0 2 $87,115 16 $87,694 1 $31,400 0 $0 FILES CLOSED FOR INCOMPLETENESS 0 $0 1 $97,280 3 $86,377 0 $0 0 $0
Detailed HMDA statistics for the following Tracts:
0504.00
Private Mortgage Insurance Companies Aggregated Statistics For Year 2009(Based on 1 partial tract) A) Conventional B) Refinancings Number Average Value Number Average Value
LOANS ORIGINATED 2 $91,315 2 $115,195 APPLICATIONS APPROVED, NOT ACCEPTED 0 $0 2 $125,805 APPLICATIONS DENIED 1 $170,470 0 $0 APPLICATIONS WITHDRAWN 0 $0 0 $0 FILES CLOSED FOR INCOMPLETENESS 0 $0 0 $0
Aggregated Statistics For Year 2008(Based on 1 partial tract) A) Conventional B) Refinancings Number Average Value Number Average Value
LOANS ORIGINATED 5 $120,898 3 $127,573 APPLICATIONS APPROVED, NOT ACCEPTED 2 $88,995 1 $148,800 APPLICATIONS DENIED 0 $0 0 $0 APPLICATIONS WITHDRAWN 0 $0 0 $0 FILES CLOSED FOR INCOMPLETENESS 0 $0 0 $0
Aggregated Statistics For Year 2007(Based on 1 partial tract) A) Conventional B) Refinancings Number Average Value Number Average Value
LOANS ORIGINATED 11 $95,073 2 $102,370 APPLICATIONS APPROVED, NOT ACCEPTED 1 $198,770 1 $67,440 APPLICATIONS DENIED 0 $0 0 $0 APPLICATIONS WITHDRAWN 0 $0 0 $0 FILES CLOSED FOR INCOMPLETENESS 0 $0 0 $0
Aggregated Statistics For Year 2006(Based on 1 partial tract) A) Conventional B) Refinancings C) Non-occupant Loans on Number Average Value Number Average Value Number Average Value
LOANS ORIGINATED 8 $106,349 2 $100,270 1 $32,060 APPLICATIONS APPROVED, NOT ACCEPTED 1 $127,130 1 $56,160 0 $0 APPLICATIONS DENIED 0 $0 0 $0 0 $0 APPLICATIONS WITHDRAWN 0 $0 0 $0 0 $0 FILES CLOSED FOR INCOMPLETENESS 0 $0 0 $0 0 $0
Aggregated Statistics For Year 2005(Based on 1 partial tract) A) Conventional B) Refinancings C) Non-occupant Loans on Number Average Value Number Average Value Number Average Value
LOANS ORIGINATED 10 $105,796 2 $93,970 1 $93,080 APPLICATIONS APPROVED, NOT ACCEPTED 1 $112,980 1 $67,440 0 $0 APPLICATIONS DENIED 0 $0 0 $0 0 $0 APPLICATIONS WITHDRAWN 1 $51,070 0 $0 0 $0 FILES CLOSED FOR INCOMPLETENESS 0 $0 0 $0 0 $0
Aggregated Statistics For Year 2004(Based on 1 partial tract) A) Conventional B) Refinancings Number Average Value Number Average Value
LOANS ORIGINATED 6 $115,340 6 $106,092 APPLICATIONS APPROVED, NOT ACCEPTED 1 $83,350 2 $89,435 APPLICATIONS DENIED 0 $0 0 $0 APPLICATIONS WITHDRAWN 0 $0 1 $80,260 FILES CLOSED FOR INCOMPLETENESS 0 $0 0 $0
Aggregated Statistics For Year 2003(Based on 1 partial tract) A) Conventional B) Refinancings Number Average Value Number Average Value
LOANS ORIGINATED 6 $111,913 9 $100,920 APPLICATIONS APPROVED, NOT ACCEPTED 0 $0 3 $121,973 APPLICATIONS DENIED 0 $0 0 $0 APPLICATIONS WITHDRAWN 0 $0 0 $0 FILES CLOSED FOR INCOMPLETENESS 0 $0 0 $0
Detailed PMIC statistics for the following Tracts:
0504.00
Fire-safe hotels and motels in Columbia City, Indiana:
Quality Inn, 701 W Connexion Way, Columbia City, Indiana 46725 Phone: (260) 248-4551, Fax: (260) 248-4559
holiday inn express and suites, 606 N Opportunity Dr, Columbia city, Indiana 46725 Phone: (260) 248-2131
All 2 fire-safe hotels and motels in Columbia City, Indiana Columbia City compared to Indiana state average:
Unemployed percentage significantly below state average. Black race population percentage significantly below state average. Hispanic race population percentage below state average. Foreign-born population percentage significantly below state average. Length of stay since moving in above state average. Columbia City on our top lists :
#16 on the list of "Top 101 cities with largest percentage of males in occupations: production occupations (population 5,000+)"
#28 on the list of "Top 101 cities with largest percentage of males in industries: manufacturing (population 5,000+)"
Top Patent Applicants
Ludovic Andre Chretien (23)
Gregory C. Stalcup (19)
Mark R. Disilvestro (16)
Michael R. Koller (15)
Alicia Rufner (13)
John E. Meyers (12)
Brian G. Emerick (12)
Rachele Barbara Cocks (10)
Michael E. Hawkins (10)
Jeffrey A. Mcanelly (10)
Total of 343 patent applications in 2008-2024.


 Recent articles from our blog. Our writers, many of them Ph.D. graduates or candidates, create easy-to-read articles on a wide variety of topics.

 (19.6 miles
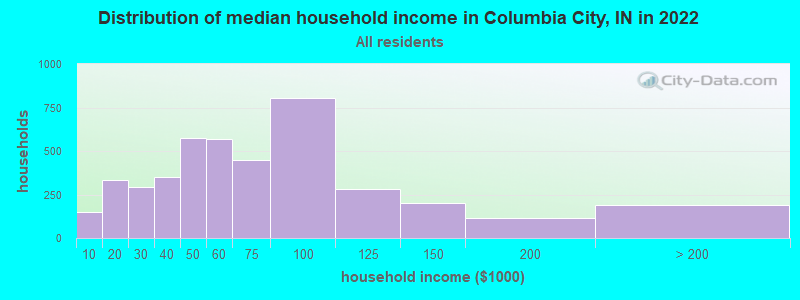


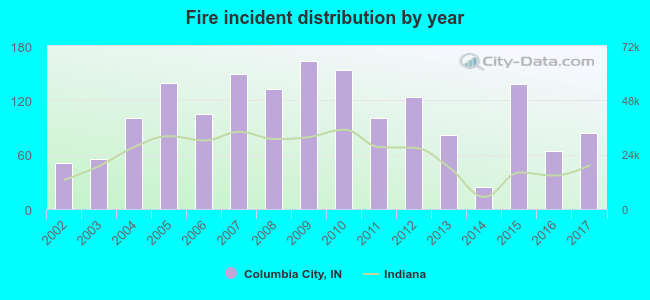 Based on the data from the years 2002 - 2017 the average number of fire incidents per year is 104. The highest number of reported fire incidents - 163 took place in 2009, and the least - 24 in 2014. The data has an increasing trend.
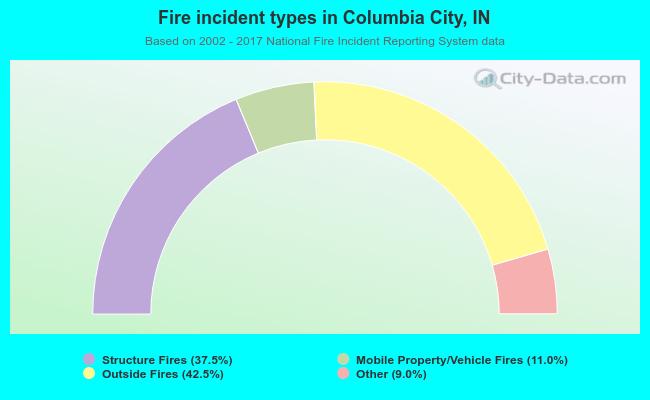 When looking into fire subcategories, the most reports belonged to: Outside Fires (42.5%), and Structure Fires (37.5%).