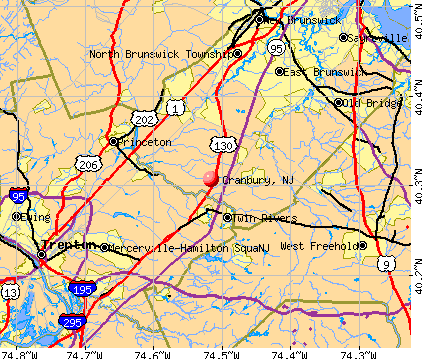
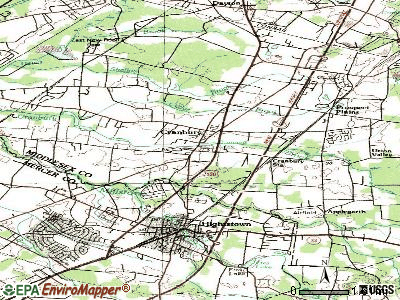
Cranbury, New Jersey
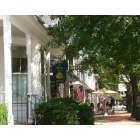
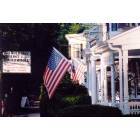
Cranbury: Summer Lunch on Main Street
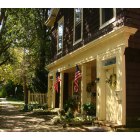
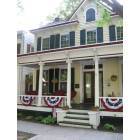
Cranbury: Home on Main Street
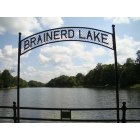
Cranbury: Brainerd Lake, Main Street
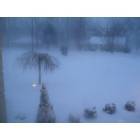
Cranbury: After the snow storm on January 22, 2005
Cranbury: 17 North Main, an 1850 building in transition to: The Blue Rooster Bakery & Cafe
Cranbury: Main Street Business District
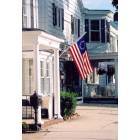
Cranbury: Main Street
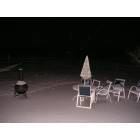
Cranbury: Taken January 19, 2005
- add
your
Submit your own pictures of this place and show them to the world
- OSM Map
- General Map
- Google Map
- MSN Map
Population change since 2000: +8.6%
| Males: 1,093 | |
| Females: 1,088 |
| Median resident age: | 48.0 years |
| New Jersey median age: | 40.4 years |
Zip codes: 08512.
| Cranbury: | $196,856 |
| NJ: | $96,346 |
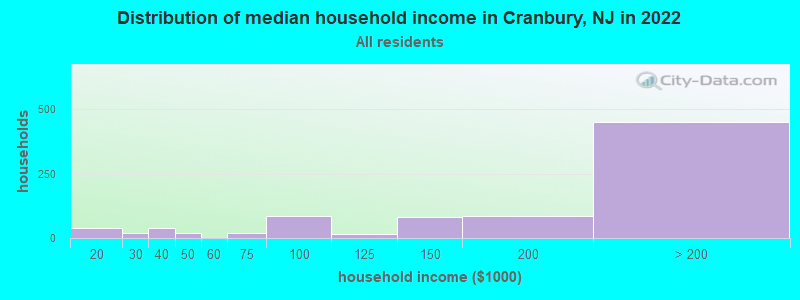
Estimated per capita income in 2022: $85,206 (it was $51,095 in 2000)
Cranbury CDP income, earnings, and wages data
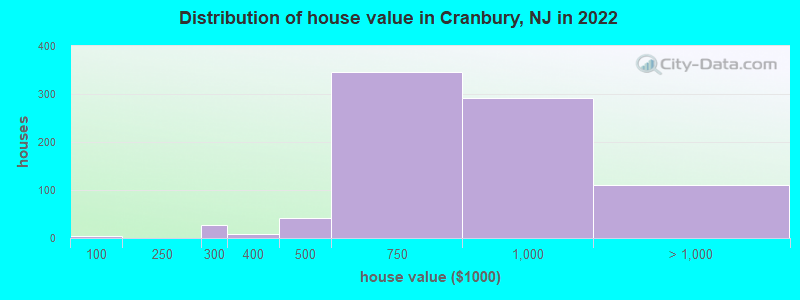
Estimated median house or condo value in 2022: $800,204 (it was $309,300 in 2000)
| Cranbury: | $800,204 |
| NJ: | $428,900 |
Mean prices in 2022: all housing units: $453,250; detached houses: $489,297; townhouses or other attached units: $387,943; in 2-unit structures: $281,108; in 3-to-4-unit structures: $341,963; in 5-or-more-unit structures: $260,268; mobile homes: $71,279
Median gross rent in 2022: $1,643.
(3.4% for White Non-Hispanic residents, 100.0% for other race residents, 3.7% for two or more races residents)
Detailed information about poverty and poor residents in Cranbury, NJ

Compare current foreclosures near Cranbury, NJ:
| Photo | Address | Area | Beds / Baths | Price | Details |
|---|---|---|---|---|---|

|
#1
Dey Rd
Cranbury, NJ 08512
|
- sq. feet
|
- baths - beds |
show details | |

|
#2
Poplar Dr
Cranbury, NJ 08512
|
3,120 sq. feet
|
- baths - beds |
show details | |

|
#3
Half Acre Rd
Cranbury, NJ 08512
|
- sq. feet
|
- baths - beds |
show details | |

|
#4
Old Stone Mill Dr
Cranbury, NJ 08512
|
865 sq. feet
|
- baths - beds |
show details | |

|
#5
Old Stone Mill Dr
Cranbury, NJ 08512
|
865 sq. feet
|
- baths - beds |
show details | |

|
#6
Aristotle Way
Cranbury, NJ 08512
|
1,951 sq. feet
|
- baths - beds |
show details | |

|
#7
Corporate Dr Ste C
Cranbury, NJ 08512
|
- sq. feet
|
- baths - beds |
show details | |

|
#8
Eiker Rd
Cranbury, NJ 08512
|
1,713 sq. feet
|
- baths - beds |
show details | |

|
#9
Evans Dr
Cranbury, NJ 08512
|
1,979 sq. feet
|
- baths - beds |
show details | |

|
#10
Princeton Arms, Apartment N-1
Cranbury, NJ 08512
|
- sq. feet
|
- baths - beds |
show details |
| Photo | Address | Area | Beds / Baths | Price | Details |
|---|---|---|---|---|---|

|
#11
Cranbury Neck Rd
Cranbury, NJ 08512
|
1,417 sq. feet
|
- baths - beds |
show details | |

|
#12
Princeton Arms N # 1
Cranbury, NJ 08512
|
- sq. feet
|
- baths - beds |
show details | |

|
#13
Woodmill Dr
Cranbury, NJ 08512
|
1,200 sq. feet
|
- baths - beds |
show details | |

|
#14
Catherine St
South Amboy, NJ 08879
|
2,266 sq. feet
|
3 baths 4 beds |
$351,900
|
show details |

|
#15
Moore Ct
Pennington, NJ 08534
|
940 sq. feet
|
1 baths 2 beds |
$195,993
|
show details |

|
#16
Tennent Rd
Morganville, NJ 07751
|
1,040 sq. feet
|
2 baths 3 beds |
$494,900
|
show details |

|
#17
Brunswick Ave
Trenton, NJ 08618
|
1,088 sq. feet
|
1 baths 2 beds |
$74,900
|
show details |

|
#18
Hazelhurst St
New Brunswick, NJ 08901
|
465 sq. feet
|
1 baths 1 beds |
$335,000
|
show details |

|
#19
Bunker Hill Ave
Trenton, NJ 08648
|
840 sq. feet
|
1 baths 2 beds |
$275,000
|
show details |

|
#20
Brainerd Dr
Cranbury, NJ 08512
|
- sq. feet
|
- baths - beds |
show details |
| Photo | Address | Area | Beds / Baths | Price | Details |
|---|---|---|---|---|---|

|
#21
S Main St
Cranbury, NJ 08512
|
- sq. feet
|
- baths - beds |
show details | |

|
#22
S 8th Ave
Highland Park, NJ 08904
|
- sq. feet
|
2 baths 4 beds |
$379,900
|
show details |

|
#23
Pkwy Dr
Freehold, NJ 07728
|
1,262 sq. feet
|
1 baths 2 beds |
show details | |

|
#24
Springhouse Ct
Bordentown, NJ 08505
|
3,040 sq. feet
|
2 baths 5 beds |
show details | |

|
#25
Waverly Dr W
Edison, NJ 08817
|
1,947 sq. feet
|
2 baths 4 beds |
show details | |

|
#26
Athens Ave
South Amboy, NJ 08879
|
1,790 sq. feet
|
2 baths 3 beds |
show details | |

|
#27
Route 206
Trenton, NJ 08610
|
1,808 sq. feet
|
2 baths 3 beds |
show details | |

|
#28
Foy Dr
Trenton, NJ 08690
|
2,416 sq. feet
|
3 baths 4 beds |
show details | |

|
#29
Bloomfield Rd
Englishtown, NJ 07726
|
3,053 sq. feet
|
3 baths 4 beds |
show details | |

|
#30
Potter Rd
Freehold, NJ 07728
|
4,062 sq. feet
|
3 baths 5 beds |
show details |
| Photo | Address | Area | Beds / Baths | Price | Details |
|---|---|---|---|---|---|

|
#31
Lawrenceville Rd
Princeton, NJ 08540
|
2,409 sq. feet
|
3 baths 4 beds |
show details | |

|
#32
Crine Rd
Morganville, NJ 07751
|
3,058 sq. feet
|
3 baths 5 beds |
show details | |

|
#33
Ardmore Ave
Trenton, NJ 08629
|
1,392 sq. feet
|
2 baths 3 beds |
show details | |

|
#34
N Lafayette Ave
Morrisville, PA 19067
|
1,896 sq. feet
|
1 baths 2 beds |
show details | |

|
#35
Marshall Ave
Trenton, NJ 08610
|
672 sq. feet
|
1 baths 3 beds |
show details | |

|
#36
Tynemouth Ct
Trenton, NJ 08691
|
1,341 sq. feet
|
3 baths 3 beds |
show details | |

|
#37
William St
Manville, NJ 08835
|
1,180 sq. feet
|
2 baths 3 beds |
show details | |

|
#38
Forman Dr
Trenton, NJ 08690
|
1,080 sq. feet
|
1 baths 3 beds |
show details | |

|
#39
Oliver Ave
Trenton, NJ 08618
|
1,270 sq. feet
|
1 baths 3 beds |
show details | |

|
#40
Cedar Swamp Rd
Jackson, NJ 08527
|
1,799 sq. feet
|
3 baths 4 beds |
show details |
| Photo | Address | Area | Beds / Baths | Price | Details |
|---|---|---|---|---|---|

|
#41
Centre St
Trenton, NJ 08611
|
1,856 sq. feet
|
2 baths 3 beds |
show details | |

|
#42
South St
Old Bridge, NJ 08857
|
2,198 sq. feet
|
2 baths 4 beds |
show details | |

|
#43
Grant Ct
Columbus, NJ 08022
|
2,646 sq. feet
|
3 baths 4 beds |
show details | |

|
#44
Jewel Rd
Princeton Junction, NJ 08550
|
- sq. feet
|
2 baths 4 beds |
show details | |

|
#45
Valley View Rd
Trenton, NJ 08620
|
1,646 sq. feet
|
2 baths 3 beds |
show details | |

|
#46
N Pennsylvania Ave
Morrisville, PA 19067
|
- sq. feet
|
2 baths 6 beds |
show details | |

|
#47
Renfrew Ave
Trenton, NJ 08618
|
2,016 sq. feet
|
3 baths 3 beds |
show details | |

|
#48
Groendyke Cir
Perrineville, NJ 08535
|
- sq. feet
|
3 baths 6 beds |
show details | |

|
#49
Georges Rd
Dayton, NJ 08810
|
1,035 sq. feet
|
1 baths 3 beds |
show details | |

|
Check over 1 million property listings on Foreclosure.com!
|
browse all offers | |||


- 1,76672.6%White alone
- 24310.0%Asian alone
- 1907.8%Black alone
- 803.3%Two or more races
- 552.3%Hispanic
- 190.8%Other race alone
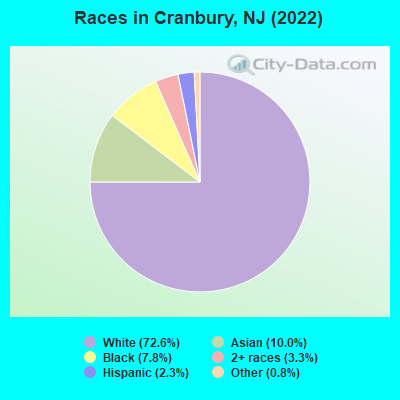
Races in Cranbury detailed stats: ancestries, foreign born residents, place of birth
According to our research of New Jersey and other state lists, there was 1 registered sex offender living in Cranbury, New Jersey as of April 23, 2024.
The ratio of all residents to sex offenders in Cranbury is 2,270 to 1.
The ratio of registered sex offenders to all residents in this city is lower than the state average.
Type |
2009 |
2010 |
2011 |
2012 |
2013 |
2014 |
2015 |
2016 |
2017 |
2018 |
2019 |
2020 |
2022 |
|---|---|---|---|---|---|---|---|---|---|---|---|---|---|
| Murders (per 100,000) | 0 (0.0) | 0 (0.0) | 0 (0.0) | 0 (0.0) | 0 (0.0) | 0 (0.0) | 0 (0.0) | 0 (0.0) | 0 (0.0) | 0 (0.0) | 0 (0.0) | 0 (0.0) | 0 (0.0) |
| Rapes (per 100,000) | 0 (0.0) | 0 (0.0) | 0 (0.0) | 0 (0.0) | 0 (0.0) | 0 (0.0) | 0 (0.0) | 0 (0.0) | 0 (0.0) | 0 (0.0) | 0 (0.0) | 0 (0.0) | 0 (0.0) |
| Robberies (per 100,000) | 1 (24.9) | 0 (0.0) | 0 (0.0) | 0 (0.0) | 2 (51.3) | 0 (0.0) | 0 (0.0) | 0 (0.0) | 0 (0.0) | 0 (0.0) | 0 (0.0) | 0 (0.0) | 0 (0.0) |
| Assaults (per 100,000) | 3 (74.8) | 3 (77.8) | 2 (51.7) | 1 (25.7) | 0 (0.0) | 0 (0.0) | 5 (126.8) | 2 (50.5) | 0 (0.0) | 0 (0.0) | 3 (74.8) | 1 (24.5) | 1 (25.1) |
| Burglaries (per 100,000) | 3 (74.8) | 6 (155.6) | 4 (103.4) | 16 (410.6) | 6 (153.8) | 9 (229.1) | 6 (152.2) | 3 (75.8) | 1 (25.2) | 1 (25.6) | 6 (149.5) | 3 (73.4) | 4 (100.3) |
| Thefts (per 100,000) | 31 (772.5) | 31 (803.7) | 31 (801.0) | 42 (1,078) | 36 (923.1) | 33 (839.9) | 28 (710.3) | 30 (758.0) | 25 (630.4) | 35 (897.4) | 25 (623.0) | 35 (856.6) | 32 (802.2) |
| Auto thefts (per 100,000) | 1 (24.9) | 2 (51.9) | 1 (25.8) | 3 (77.0) | 3 (76.9) | 1 (25.5) | 0 (0.0) | 1 (25.3) | 1 (25.2) | 1 (25.6) | 3 (74.8) | 0 (0.0) | 3 (75.2) |
| Arson (per 100,000) | 0 (0.0) | 0 (0.0) | 1 (25.8) | 1 (25.7) | 0 (0.0) | 0 (0.0) | 0 (0.0) | 0 (0.0) | 0 (0.0) | 0 (0.0) | 0 (0.0) | 0 (0.0) | 0 (0.0) |
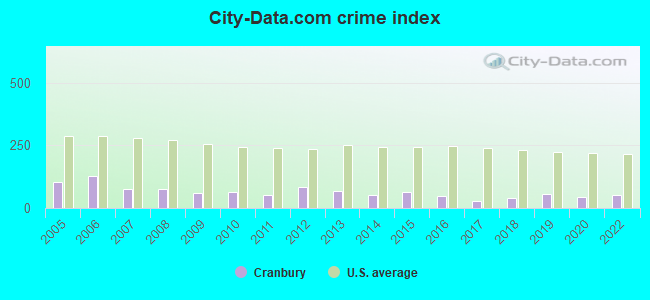
| City-Data.com crime index | 60.6 | 62.7 | 51.7 | 83.1 | 69.2 | 51.7 | 64.4 | 47.8 | 29.0 | 39.7 | 56.3 | 44.3 | 50.1 |
The City-Data.com crime index weighs serious crimes and violent crimes more heavily. Higher means more crime, U.S. average is 246.1. It adjusts for the number of visitors and daily workers commuting into cities.
Crime rate in Cranbury detailed stats: murders, rapes, robberies, assaults, burglaries, thefts, arson
Full-time law enforcement employees in 2021, including police officers: 20 (19 officers - 18 male; 1 female).
| Officers per 1,000 residents here: | 4.36 |
| New Jersey average: | 5.53 |
 Recent articles from our blog. Our writers, many of them Ph.D. graduates or candidates, create easy-to-read articles on a wide variety of topics.

 | Choosing between South (Moorestown) and Central (Cranbury/Manalapan) Jersey (11 replies) |
| Feedback from Cranbury Residents (3 replies) |
| Moving to Cranbury or Monroe. (3 replies) |
| do you consider trenton/mercer county to be philly or nyc metro area? (83 replies) |
| Cost of live in Cranbury, NJ (3 replies) |
| Cranbury parents? (3 replies) |
Latest news from Cranbury, NJ collected exclusively by city-data.com from local newspapers, TV, and radio stations
Ancestries: Italian (20.6%), English (9.2%), Irish (8.3%), Greek (6.8%), Russian (6.2%), Bulgarian (4.0%).
Current Local Time: EST time zone
Incorporated in 1872
Elevation: 103 feet
Land area: 1.24 square miles.
Population density: 1,761 people per square mile (low).
310 residents are foreign born (5.9% Asia, 5.2% Europe).
| This place: | 12.7% |
| New Jersey: | 23.2% |
Median real estate property taxes paid for housing units with mortgages in 2022: $9,892 (1.1%)
Median real estate property taxes paid for housing units with no mortgage in 2022: $9,551 (1.4%)
Nearest city with pop. 50,000+: Trenton, NJ  (14.0 miles , pop. 85,403).
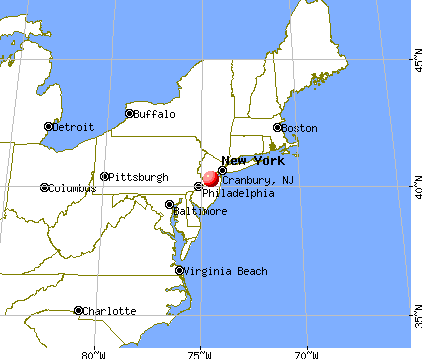
Nearest city with pop. 200,000+: Staten Island, NY (27.4 miles , pop. 443,728).
Nearest city with pop. 1,000,000+: Brooklyn, NY (38.0 miles , pop. 2,465,326).
Nearest cities:
), ), ), ), ), Latitude: 40.31 N, Longitude: 74.52 W
Daytime population change due to commuting: +1,744 (+71.7%)
Workers who live and work in this place: 545 (37.1%)
Area code: 609
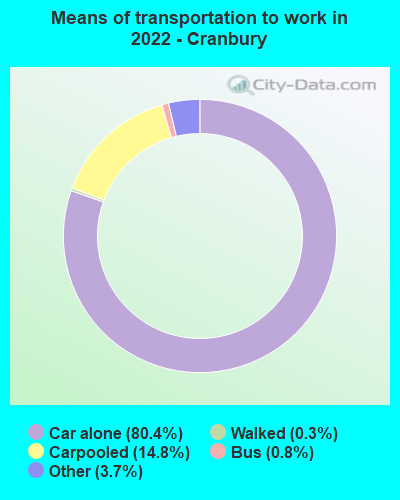
| Here: | 4.1% |
| New Jersey: | 4.5% |
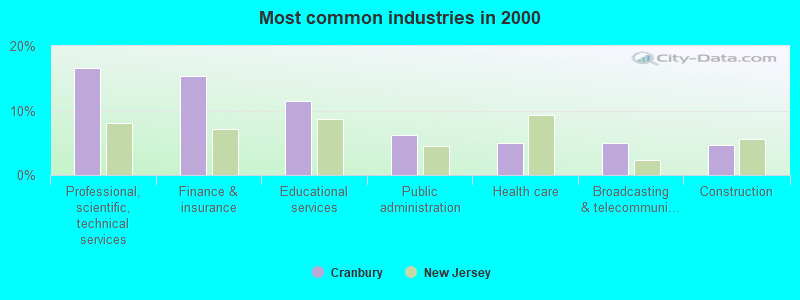
- Professional, scientific, technical services (16.6%)
- Finance & insurance (15.3%)
- Educational services (11.4%)
- Public administration (6.2%)
- Health care (5.0%)
- Broadcasting & telecommunications (5.0%)
- Construction (4.6%)
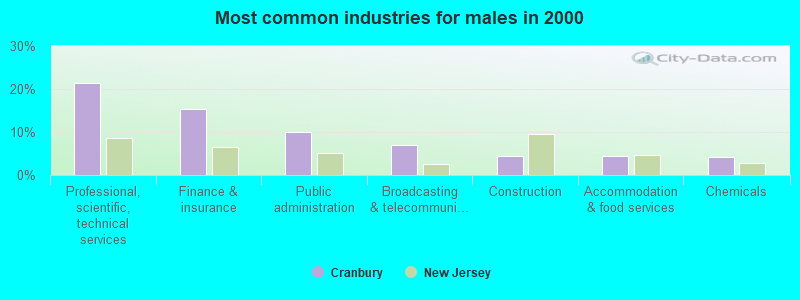
- Professional, scientific, technical services (21.3%)
- Finance & insurance (15.4%)
- Public administration (10.0%)
- Broadcasting & telecommunications (7.0%)
- Construction (4.3%)
- Accommodation & food services (4.3%)
- Chemicals (4.1%)
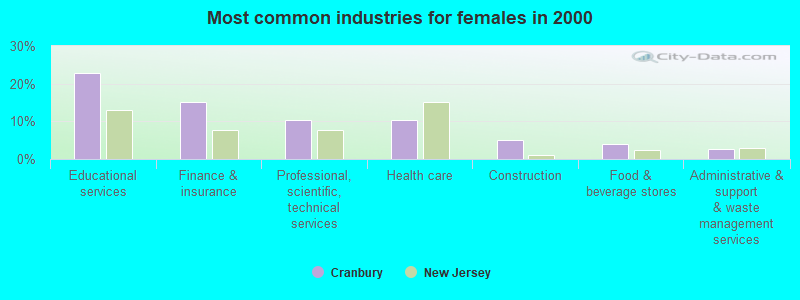
- Educational services (22.7%)
- Finance & insurance (15.1%)
- Professional, scientific, technical services (10.4%)
- Health care (10.4%)
- Construction (4.9%)
- Food & beverage stores (4.0%)
- Administrative & support & waste management services (2.7%)

- Top executives (6.1%)
- Computer specialists (5.4%)
- Secretaries and administrative assistants (5.1%)
- Other management occupations, except farmers and farm managers (4.5%)
- Preschool, kindergarten, elementary, and middle school teachers (4.4%)
- Advertising, marketing, promotions, public relations, and sales managers (4.0%)
- Sales representatives, services, wholesale and manufacturing (3.8%)
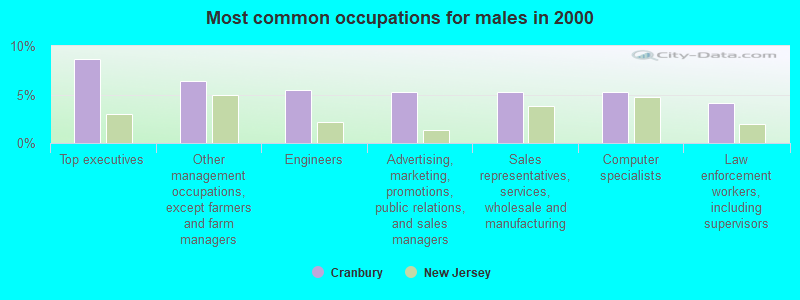
- Top executives (8.7%)
- Other management occupations, except farmers and farm managers (6.4%)
- Engineers (5.5%)
- Advertising, marketing, promotions, public relations, and sales managers (5.3%)
- Sales representatives, services, wholesale and manufacturing (5.3%)
- Computer specialists (5.3%)
- Law enforcement workers, including supervisors (4.1%)
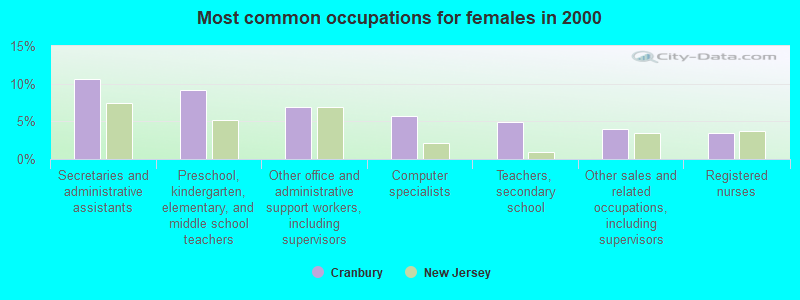
- Secretaries and administrative assistants (10.6%)
- Preschool, kindergarten, elementary, and middle school teachers (9.1%)
- Other office and administrative support workers, including supervisors (6.9%)
- Computer specialists (5.7%)
- Teachers, secondary school (4.9%)
- Other sales and related occupations, including supervisors (4.0%)
- Registered nurses (3.5%)
Average climate in Cranbury, New Jersey
Based on data reported by over 4,000 weather stations


|
|

(lower is better)
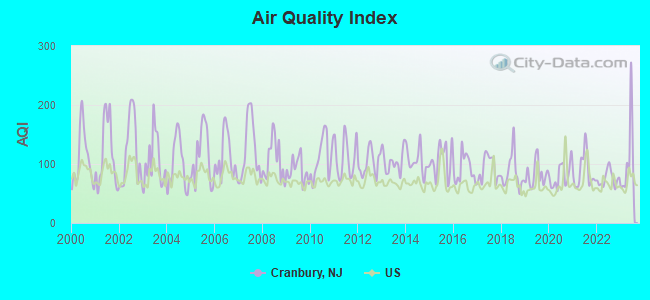
Air Quality Index (AQI) level in 2023 was 107. This is significantly worse than average.
| City: | 107 |
| U.S.: | 73 |
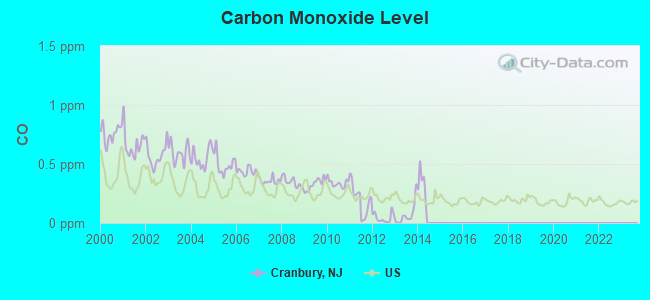
Carbon Monoxide (CO) [ppm] level in 2013 was 0.0690. This is significantly better than average. Closest monitor was 13.2 miles away from the city center.
| City: | 0.0690 |
| U.S.: | 0.2513 |
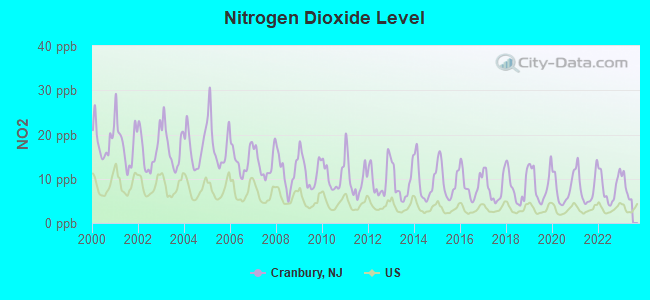
Nitrogen Dioxide (NO2) [ppb] level in 2022 was 7.95. This is significantly worse than average. Closest monitor was 7.6 miles away from the city center.
| City: | 7.95 |
| U.S.: | 5.11 |
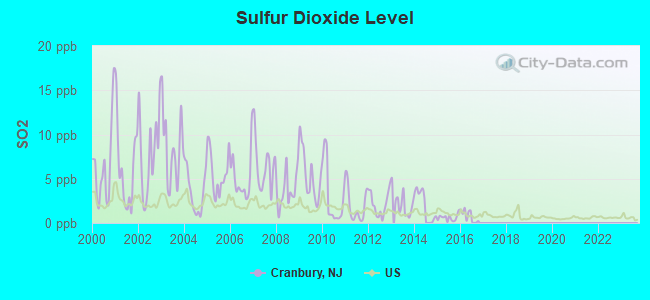
Sulfur Dioxide (SO2) [ppb] level in 2016 was 0.754. This is significantly better than average. Closest monitor was 12.0 miles away from the city center.
| City: | 0.754 |
| U.S.: | 1.515 |
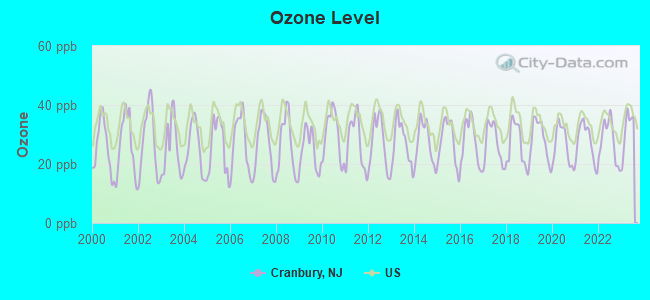
Ozone [ppb] level in 2023 was 31.6. This is about average. Closest monitor was 7.6 miles away from the city center.
| City: | 31.6 |
| U.S.: | 33.3 |
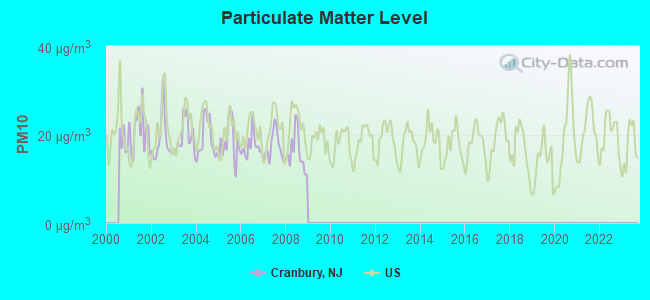
Particulate Matter (PM10) [µg/m3] level in 2008 was 16.0. This is better than average. Closest monitor was 14.3 miles away from the city center.
| City: | 16.0 |
| U.S.: | 19.2 |
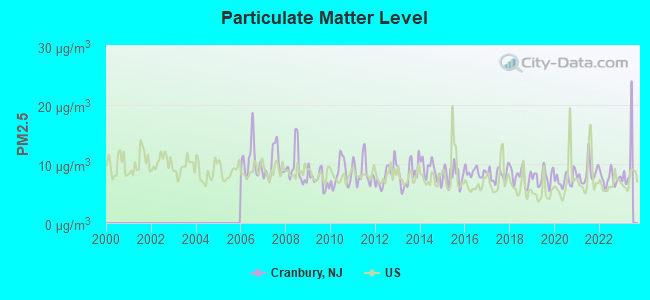
Particulate Matter (PM2.5) [µg/m3] level in 2022 was 7.51. This is about average. Closest monitor was 11.7 miles away from the city center.
| City: | 7.51 |
| U.S.: | 8.11 |
Tornado activity:
Cranbury-area historical tornado activity is near New Jersey state average. It is 27% smaller than the overall U.S. average.
On 10/18/1990, a category F3 (max. wind speeds 158-206 mph) tornado 17.9 miles away from the Cranbury place center injured 8 people and caused between $500,000 and $5,000,000 in damages.
On 5/28/1973, a category F3 tornado 34.1 miles away from the place center caused between $50,000 and $500,000 in damages.
Earthquake activity:
Cranbury-area historical earthquake activity is significantly above New Jersey state average. It is 68% smaller than the overall U.S. average.On 8/23/2011 at 17:51:04, a magnitude 5.8 (5.8 MW, Depth: 3.7 mi, Class: Moderate, Intensity: VI - VII) earthquake occurred 247.3 miles away from the city center
On 1/16/1994 at 01:49:16, a magnitude 4.6 (4.6 MB, 4.6 LG, Depth: 3.1 mi, Class: Light, Intensity: IV - V) earthquake occurred 80.2 miles away from the city center
On 10/7/1983 at 10:18:46, a magnitude 5.3 (5.1 MB, 5.3 LG, 5.1 ML) earthquake occurred 252.3 miles away from Cranbury center
On 1/16/1994 at 00:42:43, a magnitude 4.2 (4.2 MB, 4.0 LG, Depth: 3.1 mi) earthquake occurred 78.6 miles away from Cranbury center
On 4/20/2002 at 10:50:47, a magnitude 5.3 (5.3 ML, Depth: 3.0 mi) earthquake occurred 293.9 miles away from Cranbury center
On 4/20/2002 at 10:50:47, a magnitude 5.2 (5.2 MB, 4.2 MS, 5.2 MW, 5.0 MW) earthquake occurred 292.0 miles away from Cranbury center
Magnitude types: regional Lg-wave magnitude (LG), body-wave magnitude (MB), local magnitude (ML), surface-wave magnitude (MS), moment magnitude (MW)
Natural disasters:
The number of natural disasters in Middlesex County (26) is a lot greater than the US average (15).Major Disasters (Presidential) Declared: 17
Emergencies Declared: 9
Causes of natural disasters: Floods: 7, Hurricanes: 7, Storms: 6, Heavy Rains: 4, Snowstorms: 3, Blizzards: 2, Water Shortages: 2, Winter Storms: 2, Tornado: 1, Wind: 1, Other: 3 (Note: some incidents may be assigned to more than one category).
Main business address for: 1ST CONSTITUTION BANCORP (SAVINGS INSTITUTION, FEDERALLY CHARTERED), PALATIN TECHNOLOGIES INC (PHARMACEUTICAL PREPARATIONS).
Hospitals and medical centers in Cranbury:
Heliports located in Cranbury:
Amtrak stations near Cranbury:
- 6 miles: PRINCETON JUNCTION (WALLACE RD.) . Services: ticket office, fully wheelchair accessible, enclosed waiting area, public restrooms, snack bar, paid short-term parking, paid long-term parking, call for car rental service, taxi stand, public transit connection.
- 14 miles: NEW BRUNSWICK (FRENCH & ALBANY STS.) . Services: ticket office, fully wheelchair accessible, enclosed waiting area, public restrooms, public payphones, snack bar, ATM, free short-term parking, free long-term parking, call for car rental service, taxi stand, public transit connection.
- 14 miles: TRENTON (72 S. CLINTON AVE.) . Services: ticket office, fully wheelchair accessible, enclosed waiting area, public restrooms, public payphones, snack bar, ATM, paid short-term parking, paid long-term parking, car rental agency, taxi stand, public transit connection.
College/University in Cranbury:
Colleges/universities with over 2000 students nearest to Cranbury:
- Mercer County Community College (about 8 miles; West Windsor, NJ; Full-time enrollment: 5,728)
- Princeton University (about 9 miles; Princeton, NJ; FT enrollment: 6,897)
- Rider University (about 13 miles; Lawrenceville, NJ; FT enrollment: 4,960)
- The College of New Jersey (about 15 miles; Ewing, NJ; FT enrollment: 7,573)
- Rutgers University-New Brunswick (about 15 miles; New Brunswick, NJ; FT enrollment: 39,388)
- Thomas Edison State College (about 15 miles; Trenton, NJ; FT enrollment: 4,972)
- Middlesex County College (about 16 miles; Edison, NJ; FT enrollment: 9,849)
Public elementary/middle school in Cranbury:
- CRANBURY SCHOOL (Students: 637, Location: 23 N MAIN ST, Grades: PK-8)
Private elementary/middle school in Cranbury:
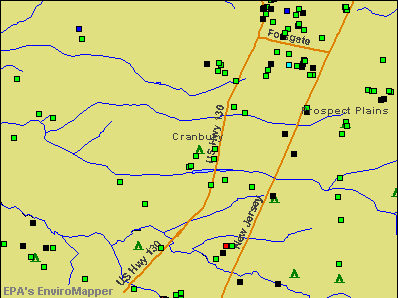
Points of interest:
Notable locations in Cranbury: Cranbury Volunteer First Aid Squad (A), Cranbury Volunteer Fire Company 1 Station 48 (B). Display/hide their locations on the map
Main business address in Cranbury: 1ST CONSTITUTION BANCORP (A). Display/hide its location on the map
Churches in Cranbury include: Saint David's Episcopal Church (A), Cranbury United Methodist Church (B). Display/hide their locations on the map
Cemeteries: Brainerd Cemetery (1), Westminster Cemetery (2). Display/hide their locations on the map
Reservoir: Brainerd Lake (A). Display/hide its location on the map
Tourist attraction: Cranbury Museum (4 Park Place East).
Hotel: Marriott Residence Inn Cranbury (2662 US Highway 130).
Drinking water stations with addresses in Cranbury and their reported violations in the past:
ST DAVIDS EPISCOPAL CHURCH (Population served: 303, Groundwater):Past health violations:SUNOCO GAS (Population served: 62, Groundwater):
- MCL, Monthly (TCR) - In OCT-2013, Contaminant: Coliform. Follow-up actions: St Public Notif requested (OCT-21-2013), St Formal NOV issued (OCT-21-2013), St Compliance achieved (NOV-07-2013), St Public Notif received (NOV-13-2013)
Past health violations:Past monitoring violations:
- MCL, Monthly (TCR) - In JAN-2009, Contaminant: Coliform. Follow-up actions: St Compliance achieved (FEB-26-2009), St Public Notif requested (MAR-13-2009), St Formal NOV issued (MAR-13-2009)
- 4 routine major monitoring violations
- One minor monitoring violation
| This place: | 2.9 people |
| New Jersey: | 2.7 people |
| This place: | 79.2% |
| Whole state: | 69.3% |
| This place: | 2.8% |
| Whole state: | 5.9% |
Likely homosexual households (counted as self-reported same-sex unmarried-partner households)
- Lesbian couples: 0.1% of all households
- Gay men: 0.0% of all households
45 people in nursing homes in 2000
Banks with branches in Cranbury (2011 data):
- 1st Constitution Bank: Cranbury Village Branch at 74 North Main Street, branch established on 1927/01/01; at 2650 Route 130, branch established on 1989/07/24. Info updated 2011/08/31: Bank assets: $791.7 mil, Deposits: $624.5 mil, local headquarters, positive income, Commercial Lending Specialization, 14 total offices, Holding Company: 1st Constitution Bancorp
- PNC Bank, National Association: Cranbury Branch at 2664 Route 130, branch established on 2007/07/23. Info updated 2012/03/20: Bank assets: $263,309.6 mil, Deposits: $197,343.0 mil, headquarters in Wilmington, DE, positive income, Commercial Lending Specialization, 3085 total offices, Holding Company: Pnc Financial Services Group, Inc., The
- New Jersey Community Bank: Cranbury Branch at 68 South Main Street, branch established on 2011/06/09. Info updated 2011/12/13: Bank assets: $132.0 mil, Deposits: $116.4 mil, headquarters in Freehold, NJ, positive income, Commercial Lending Specialization, 3 total offices
For population 15 years and over in Cranbury:
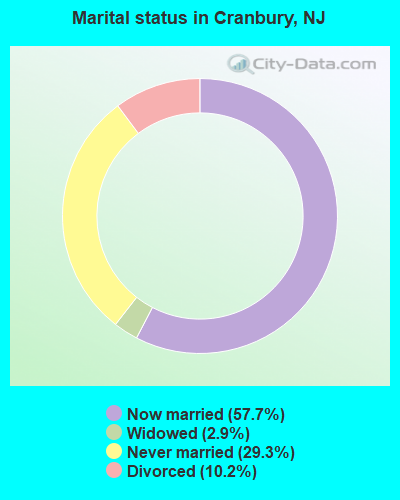
- Never married: 29.3%
- Now married: 57.7%
- Separated: 0.0%
- Widowed: 2.9%
- Divorced: 10.2%
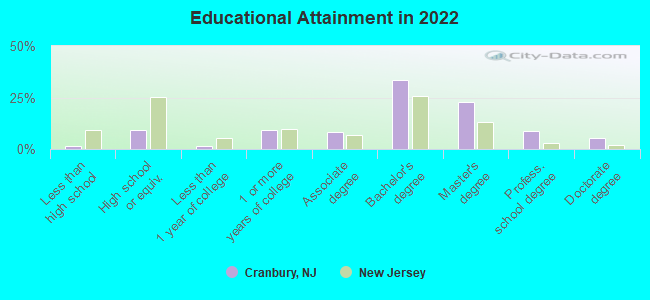
For population 25 years and over in Cranbury:
- High school or higher: 98.5%
- Bachelor's degree or higher: 70.1%
- Graduate or professional degree: 35.7%
- Unemployed: 2.1%
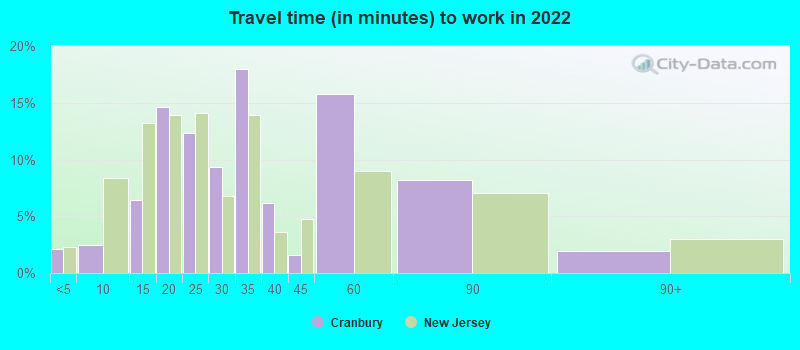
- Mean travel time to work (commute): 22.2 minutes
| Here: | 9.0 |
| New Jersey average: | 12.8 |
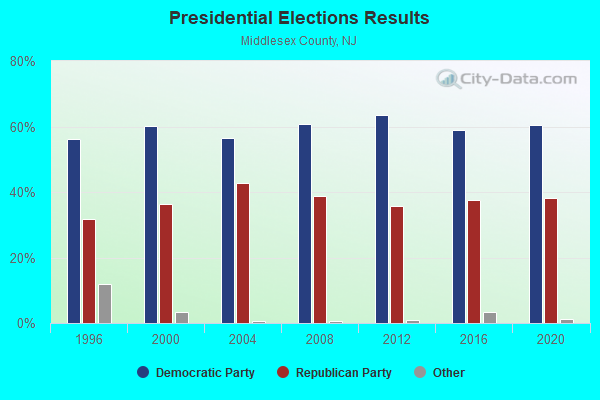
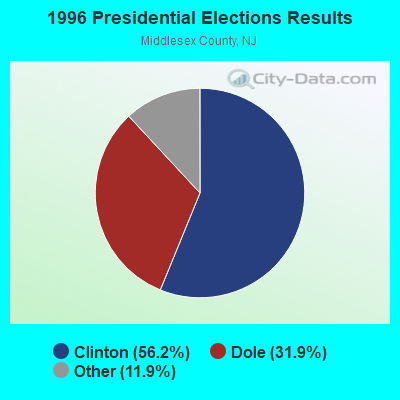
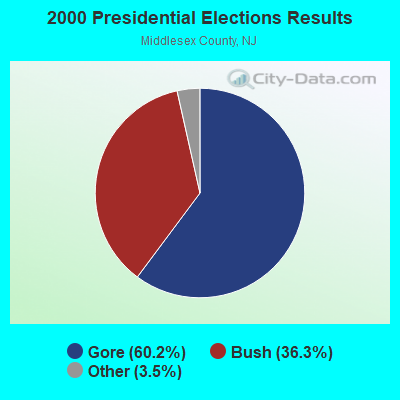
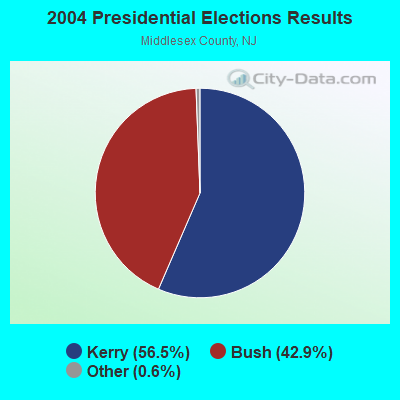
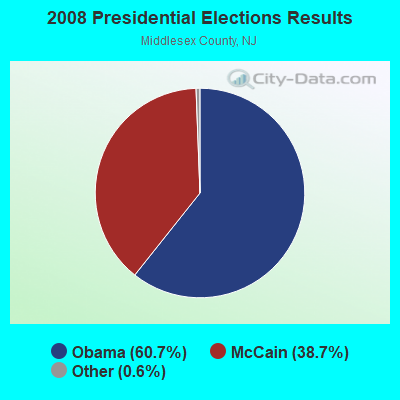
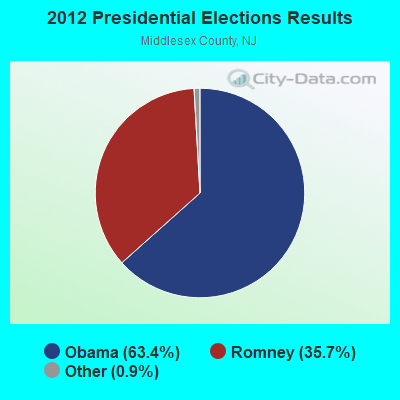
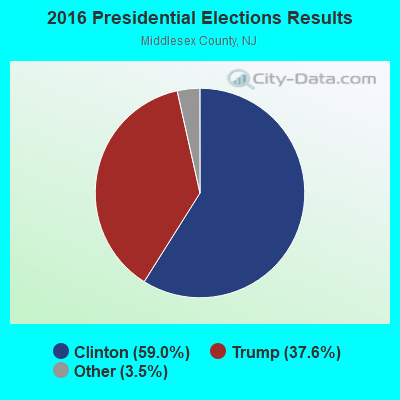
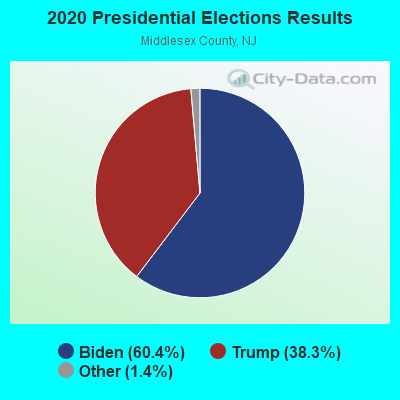
Graphs represent county-level data. Detailed 2008 Election Results
Religion statistics for Cranbury, NJ (based on Middlesex County data)
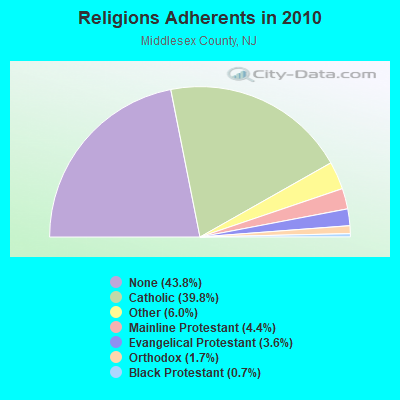
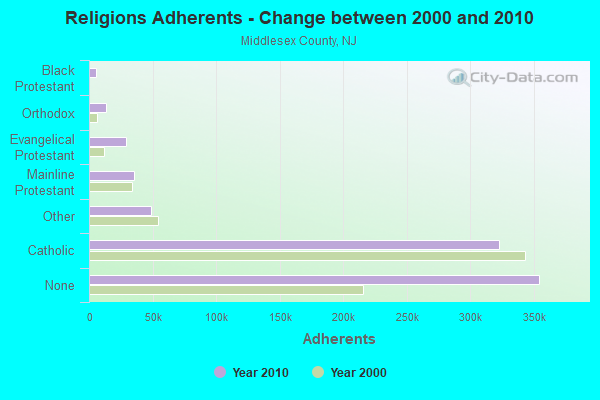
| Religion | Adherents | Congregations |
|---|---|---|
| Catholic | 322,340 | 74 |
| Other | 48,717 | 73 |
| Mainline Protestant | 35,693 | 113 |
| Evangelical Protestant | 29,296 | 130 |
| Orthodox | 13,491 | 14 |
| Black Protestant | 5,879 | 17 |
| None | 354,442 | - |
Food Environment Statistics:
| This county: | 2.82 / 10,000 pop. |
| New Jersey: | 2.90 / 10,000 pop. |
| Middlesex County: | 0.05 / 10,000 pop. |
| New Jersey: | 0.06 / 10,000 pop. |
| Here: | 2.20 / 10,000 pop. |
| State: | 1.76 / 10,000 pop. |
| Middlesex County: | 0.88 / 10,000 pop. |
| New Jersey: | 0.81 / 10,000 pop. |
| This county: | 6.09 / 10,000 pop. |
| New Jersey: | 7.15 / 10,000 pop. |
| Here: | 7.6% |
| New Jersey: | 8.3% |
| Here: | 23.8% |
| New Jersey: | 23.3% |
| Here: | 18.2% |
| New Jersey: | 18.0% |
Health and Nutrition:
| Cranbury: | 61.6% |
| New Jersey: | 50.6% |
| Here: | 63.1% |
| New Jersey: | 48.5% |
| Cranbury: | 27.2 |
| State: | 28.5 |
| Cranbury: | 16.5% |
| New Jersey: | 20.0% |
| Cranbury: | 7.6% |
| State: | 11.1% |
| This city: | 7.1 |
| New Jersey: | 6.8 |
| Here: | 31.9% |
| New Jersey: | 33.6% |
| Cranbury: | 66.9% |
| New Jersey: | 56.9% |
| This city: | 83.2% |
| New Jersey: | 80.0% |
More about Health and Nutrition of Cranbury, NJ Residents
6.75% of this county's 2021 resident taxpayers lived in other counties in 2020 ($80,605 average adjusted gross income)
| Here: | 6.75% |
| New Jersey average: | 6.70% |
0.01% of residents moved from foreign countries ($55 average AGI)
Middlesex County: 0.01% New Jersey average: 0.01%
Top counties from which taxpayers relocated into this county between 2020 and 2021:
| from Union County, NJ | |
| from Hudson County, NJ | |
| from Somerset County, NJ |
7.27% of this county's 2020 resident taxpayers moved to other counties in 2021 ($94,247 average adjusted gross income)
| Here: | 7.27% |
| New Jersey average: | 7.02% |
0.02% of residents moved to foreign countries ($103 average AGI)
Middlesex County: 0.02% New Jersey average: 0.02%
Top counties to which taxpayers relocated from this county between 2020 and 2021:
| to Somerset County, NJ | |
| to Monmouth County, NJ | |
| to Mercer County, NJ |
| Businesses in Cranbury, NJ | ||||
| Name | Count | Name | Count | |
|---|---|---|---|---|
| Cinnabon | 1 | Marriott | 2 | |
| Crate & Barrel | 1 | MasterBrand Cabinets | 1 | |
| DHL | 1 | Starbucks | 2 | |
| FedEx | 3 | UPS | 11 | |
| Holiday Inn | 1 | |||
Strongest AM radio stations in Cranbury:
- WMCA (570 AM; 50 kW; NEW YORK, NY; Owner: SALEM MEDIA OF NEW YORK, LLC)
- WWJZ (640 AM; 50 kW; MOUNT HOLLY, NJ; Owner: ABC, INC.)
- WHWH (1350 AM; 10 kW; PRINCETON, NJ; Owner: MULTICULTURAL RADIO BROADCASTING, INC.)
- WOR (710 AM; 50 kW; NEW YORK, NY; Owner: BUCKLEY BROADCASTING CORPORATION)
- WTTM (1680 AM; 10 kW; PRINCETON, NJ; Owner: MULTICULTURAL RADIO BROADCASTING, INC.)
- WPHT (1210 AM; 50 kW; PHILADELPHIA, PA; Owner: INFINITY BROADCASTING OPERATIONS, INC.)
- WINS (1010 AM; 50 kW; NEW YORK, NY; Owner: INFINITY BROADCASTING OPERATIONS, INC.)
- WABC (770 AM; 50 kW; NEW YORK, NY; Owner: WABC-AM RADIO, INC.)
- KYW (1060 AM; 50 kW; PHILADELPHIA, PA; Owner: INFINITY BROADCASTING OPERATIONS, INC.)
- WZZD (990 AM; 50 kW; PHILADELPHIA, PA; Owner: PENNSYLVANIA MEDIA ASSOCIATES, INC.)
- WEPN (1050 AM; 50 kW; NEW YORK, NY; Owner: NEW YORK AM RADIO, LLC)
- WFAN (660 AM; 50 kW; NEW YORK, NY; Owner: INFINITY BROADCASTING OPERATIONS, INC.)
- WPEN (950 AM; 50 kW; PHILADELPHIA, PA; Owner: GREATER PHILADELPHIA RADIO, INC.)
Strongest FM radio stations in Cranbury:
- WKXW-FM (101.5 FM; TRENTON, NJ; Owner: MILLENNIUM CENTRAL NEW JERSEY LICENSE HOLDCO, LLC)
- WNJT-FM (88.1 FM; TRENTON, NJ; Owner: NEW JERSEY PUBLIC BRD/CST AUTHORITY)
- WPRB (103.3 FM; PRINCETON, NJ; Owner: PRINCETON BROADCASTING SERVICE, INC.)
- W220AG (91.9 FM; LAWRENCEVILLE, ETC., NJ; Owner: BUX-MONT EDUCATIONAL RADIO ASSOC.)
- WMGQ (98.3 FM; NEW BRUNSWICK, NJ; Owner: THE SENTINEL PUBLISHING CO.)
- WWFM (89.1 FM; TRENTON, NJ; Owner: MERCER COUNTY COMMUNITY COLLEGE)
- WAWZ (99.1 FM; ZAREPHATH, NJ; Owner: PILLAR OF FIRE)
- WPST (97.5 FM; TRENTON, NJ; Owner: NASSAU BROADCASTING II, L.L.C.)
- WRKS (98.7 FM; NEW YORK, NY; Owner: EMMIS RADIO LICENSE CORP OF NEW YORK)
- WNYC-FM (93.9 FM; NEW YORK, NY; Owner: WNYC RADIO)
- WPAT-FM (93.1 FM; PATERSON, NJ; Owner: WPAT LICENSING, INC.)
- WTHK (94.5 FM; TRENTON, NJ; Owner: NASSAU BROADCASTING II, L.L.C.)
- WQCD (101.9 FM; NEW YORK, NY; Owner: EMMIS RADIO LICENSE CORPORATION)
- WNEW (102.7 FM; NEW YORK, NY; Owner: INFINITY BROADCASTING OPERATIONS, INC.)
- WKTU (103.5 FM; LAKE SUCCESS, NY; Owner: AMFM RADIO LICENSES, LLC)
- WCAA (105.9 FM; NEWARK, NJ; Owner: WADO-AM LICENSE CORP. ("WADO"))
- WBAI (99.5 FM; NEW YORK, NY; Owner: PACIFICA FOUNDATION, INC.)
- WBLS (107.5 FM; NEW YORK, NY; Owner: ICBC BROADCAST HOLDINGS-NY, INC.)
- WLTW (106.7 FM; NEW YORK, NY; Owner: AMFM NEW YORK LICENSES, LLC)
- WQXR-FM (96.3 FM; NEW YORK, NY; Owner: THE NEW YORK TIMES ELECTRONIC MEDIA COMPANY)
TV broadcast stations around Cranbury:
- WNJT (Channel 52; TRENTON, NJ; Owner: NEW JERSEY PUBLIC BROADCASTING AUTHORITY)
- WNJN (Channel 50; MONTCLAIR, NJ; Owner: NEW JERSEY PUBLIC B/CNG AUTHORITY)
- WCBS-TV (Channel 2; NEW YORK, NY; Owner: CBS BROADCASTING INC.)
- WNYW (Channel 5; NEW YORK, NY; Owner: FOX TELEVISION STATIONS, INC.)
- WABC-TV (Channel 7; NEW YORK, NY; Owner: AMERICAN BROADCASTING COMPANIES, INC)
- WPIX (Channel 11; NEW YORK, NY; Owner: WPIX, INC.)
- WWOR-TV (Channel 9; SECAUCUS, NJ; Owner: FOX TELEVISION STATIONS, INC.)
- W36AS (Channel 36; NEW BRUNSWICK, NJ; Owner: DEEPAK VISWANATH)
- WPXN-TV (Channel 31; NEW YORK, NY; Owner: PAXSON COMMUNICATIONS LICENSE COMPANY, LLC)
- WNBC (Channel 4; NEW YORK, NY; Owner: NATIONAL BROADCASTING COMPANY, INC.)
- WNET (Channel 13; NEWARK, NJ; Owner: EDUCATIONAL BROADCASTING CORPORATION)
- WXTV (Channel 41; PATERSON, NJ; Owner: WXTV LICENSE PARTNERSHIP, G.P.)
- WNJU (Channel 47; LINDEN, NJ; Owner: WNJU LICENSE CORPORATION)
- KYW-TV (Channel 3; PHILADELPHIA, PA; Owner: CBS BROADCASTING INC.)
- WFUT (Channel 68; NEWARK, NJ; Owner: UNIVISION NEW YORK LLC)
- WLBX-LP (Channel 22; CRANFORD, NJ; Owner: RENARD COMMUNICATIONS CORP.)
- WPXO-LP (Channel 34; EAST ORANGE, NJ; Owner: PAXSON COMMUNICATIONS LPTV, INC.)
- WXNY-LP (Channel 32; NEW YORK, NY; Owner: ISLAND BROADCASTING COMPANY)
- WNYE-TV (Channel 25; NEW YORK, NY; Owner: NEW YORK CITY BOARD OF EDUCATION)
- WPHL-TV (Channel 17; PHILADELPHIA, PA; Owner: TRIBUNE TELEVISION COMPANY)
- WPPX (Channel 61; WILMINGTON, DE; Owner: PAXSON PHILADELPHIA LICENSE, INC.)
- WPVI-TV (Channel 6; PHILADELPHIA, PA; Owner: ABC, INC.)
- WPSG (Channel 57; PHILADELPHIA, PA; Owner: VIACOM STATIONS GROUP OF PHILADELPHIA INC.)
- WUVP (Channel 65; VINELAND, NJ; Owner: UNIVISION PHILADELPHIA LLC)
- WCAU (Channel 10; PHILADELPHIA, PA; Owner: NBC SUBSIDIARY (WCAU-TV), L.P.)
- National Bridge Inventory (NBI) Statistics
- 18Number of bridges
- 151ft / 46.5mTotal length
- $2,074,000Total costs
- 760,405Total average daily traffic
- 89,394Total average daily truck traffic
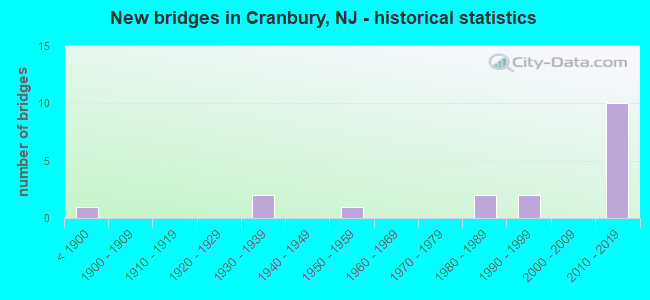
- New bridges - historical statistics
- 1Before 1900
- 21930-1939
- 11950-1959
- 21980-1989
- 21990-1999
- 102010-2019
FCC Registered Antenna Towers:
8 (See the full list of FCC Registered Antenna Towers in Cranbury)FCC Registered Broadcast Land Mobile Towers:
18 (See the full list of FCC Registered Broadcast Land Mobile Towers in Cranbury, NJ)FCC Registered Microwave Towers:
6- STATION, Int Prospect Plains Rd & S River Cranbury Rd 1.5 Mi Ne Of (Lat: 40.327028 Lon: -74.493194), Structure height: 25.6 m, Call Sign: WNEQ289,
Assigned Frequencies: 6695.00 MHz, Grant Date: 02/27/1992, Expiration Date: 02/27/1997, Phone: (908) 918-5199
- 278 Prospect Plains Rd (Lat: 40.316750 Lon: -74.488750), Overall height: 61 m, Call Sign: WNTZ476,
Assigned Frequencies: 6585.00 MHz, Grant Date: 07/05/1995, Expiration Date: 07/05/2000, Cancellation Date: 10/08/2000, Phone: (908) 247-0900
- WD3, 129 Millstone Road (Lat: 40.294194 Lon: -74.564583), Type: Pole, Structure height: 48.8 m, Call Sign: WQMJ957, Licensee ID: L00959074,
Assigned Frequencies: 17960.0 MHz, 17750.0 MHz, 23030.0 MHz, Grant Date: 08/30/2010, Expiration Date: 08/30/2020, Cancellation Date: 06/17/2013, Certifier: Alan Macdonald, Registrant: Telecom Transport Management, Inc., 146 N. Canal Street, Suite 210, Seattle, WA 98103, Phone: (206) 569-3041, Fax: (206) 545-9585, Email:
- 2VS, Cranbury Station Rd (Lat: 40.275778 Lon: -74.515778), Type: Tank, Structure height: 42.7 m, Call Sign: WQMK388, Licensee ID: L00959074,
Assigned Frequencies: 19310.0 MHz, Grant Date: 09/01/2010, Expiration Date: 09/01/2020, Cancellation Date: 11/07/2020, Certifier: Alan Macdonald, Registrant: Telecom Transport Management, Inc., 146 N. Canal Street, Suite 210, Seattle, WA 98103, Phone: (206) 569-3041, Fax: (206) 545-9585, Email:
- Cranbury NJ, Molly Pitcher Service Area, Nj Turnpike Authority-Milepost 71.7 (Lat: 40.317056 Lon: -74.489722), Type: Mast, Structure height: 55.2 m, Overall height: 61.3 m, Call Sign: WQPW868,
Assigned Frequencies: 6286.19 MHz, 6345.49 MHz, Grant Date: 06/22/2022, Expiration Date: 09/05/2032, Certifier: James R Barsuglia, Registrant: New Jersey State Police, River Rd, West Trenton, NJ 08628, Phone: (609) 882-2000, Email:
- NJY0141, Station, Off Cranbury Road (Lat: 40.301250 Lon: -74.493611), Type: Mtower, Structure height: 45.7 m, Call Sign: WQTI371,
Assigned Frequencies: 10935.0 MHz, 11055.0 MHz, 10935.0 MHz, 11055.0 MHz, 10935.0 MHz, 11055.0 MHz, 10935.0 MHz, 11055.0 MHz, 10935.0 MHz, 11055.0 MHz... (+10 more), Grant Date: 03/05/2024, Expiration Date: 02/10/2034, Certifier: Brett Lindsey, Registrant: Micronet Communications, Inc., 812 Lexington Dr, Plano, TX 75075, Phone: (972) 422-7200, Email:
FCC Registered Amateur Radio Licenses:
50 (See the full list of FCC Registered Amateur Radio Licenses in Cranbury)FAA Registered Aircraft:
4- Aircraft: FAIRCHILD KR-21 (Category: Land, Seats: 2, Weight: Up to 12,499 Pounds, Speed: 79 mph), Engine: KINNER K5 SERIES (100 HP) (Reciprocating)
N-Number: 206V, N206V, N-206V, Serial Number: 1030, Airworthiness Date: 03/15/1961, Certificate Issue Date: 09/28/2012
Registrant (Individual): Jerome C Yochelson, 16 S Main St, Cranbury, NJ 08512 - Aircraft: JACK A FROHBIETER QUESTAIR VENTURE (Category: Land, Seats: 2, Weight: Up to 12,499 Pounds), Engine: CONT MOTOR IO-550-G (280 HP) (Reciprocating)
N-Number: 281F, N281F, N-281F, Serial Number: 70, Year manufactured: 2019, Airworthiness Date: 04/18/2019, Certificate Issue Date: 05/16/2017
Registrant (Individual): Jack A Frohbieter, 34 Cranbury Neck Rd, Cranbury, NJ 08512 - Aircraft: CESSNA 182Q (Category: Land, Seats: 4, Weight: Up to 12,499 Pounds, Speed: 112 mph), Engine: CONT MOTOR O-470 SERIES (230 HP) (Reciprocating)
N-Number: 2911D, N2911D, N-2911D, Serial Number: 18267459, Year manufactured: 1979, Airworthiness Date: 12/14/1979, Certificate Issue Date: 02/14/2006
Registrant (Individual): Ralph V Pagano, 1 Evans Dr, Cranbury, NJ 08512
Deregistered: Cancel Date: 12/22/1988 - Aircraft: CESSNA 172M (Category: Land, Seats: 4, Weight: Up to 12,499 Pounds, Speed: 108 mph), Engine: LYCOMING 0-320 SERIES (180 HP) (4 Cycle)
N-Number: 5470R, N5470R, N-5470R, Serial Number: 17263543, Year manufactured: 1974, Airworthiness Date: 07/12/1974, Certificate Issue Date: 06/10/1977
Registrant (Individual): Mihai Lupovici, Rd 2 Box 135b Petty Road, Cranbury, NJ 08512
Deregistered: Cancel Date: 04/18/2018
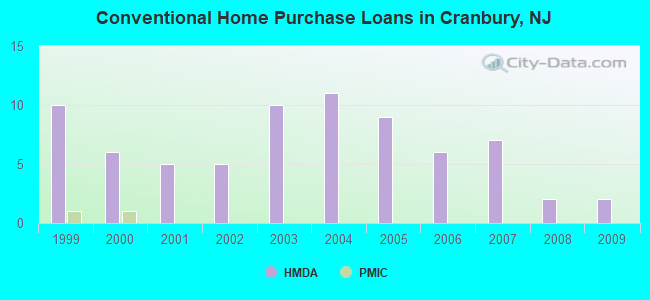
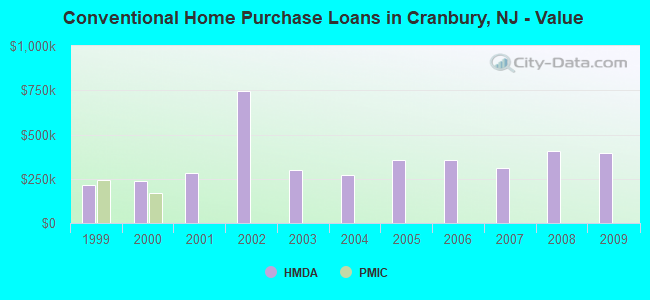
| Home Mortgage Disclosure Act Aggregated Statistics For Year 2009 (Based on 1 partial tract) | ||||||
| B) Conventional Home Purchase Loans | C) Refinancings | D) Home Improvement Loans | ||||
|---|---|---|---|---|---|---|
| Number | Average Value | Number | Average Value | Number | Average Value | |
| LOANS ORIGINATED | 2 | $394,085 | 14 | $347,781 | 1 | $137,950 |
| APPLICATIONS APPROVED, NOT ACCEPTED | 0 | $0 | 1 | $414,690 | 0 | $0 |
| APPLICATIONS DENIED | 0 | $0 | 3 | $378,687 | 1 | $48,970 |
| APPLICATIONS WITHDRAWN | 0 | $0 | 2 | $319,565 | 0 | $0 |
| FILES CLOSED FOR INCOMPLETENESS | 0 | $0 | 0 | $0 | 0 | $0 |
Detailed HMDA statistics for the following Tracts: 0087.00
| Private Mortgage Insurance Companies Aggregated Statistics For Year 2000 (Based on 1 partial tract) | ||
| A) Conventional Home Purchase Loans | ||
|---|---|---|
| Number | Average Value | |
| LOANS ORIGINATED | 1 | $167,060 |
| APPLICATIONS APPROVED, NOT ACCEPTED | 0 | $0 |
| APPLICATIONS DENIED | 0 | $0 |
| APPLICATIONS WITHDRAWN | 0 | $0 |
| FILES CLOSED FOR INCOMPLETENESS | 0 | $0 |
Detailed PMIC statistics for the following Tracts: 0087.00
2004 - 2018 National Fire Incident Reporting System (NFIRS) incidents
- Fire incident types reported to NFIRS in Cranbury, NJ
- 23639.9%Structure Fires
- 16928.6%Mobile Property/Vehicle Fires
- 16327.6%Outside Fires
- 233.9%Other
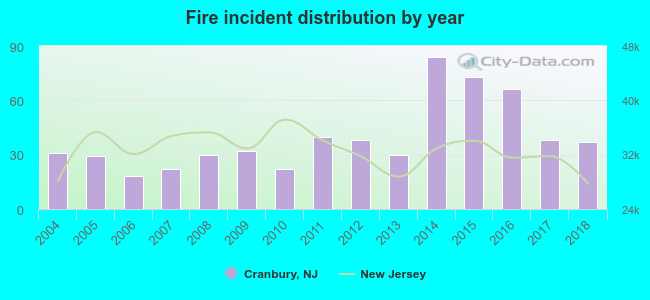 According to the data from the years 2004 - 2018 the average number of fire incidents per year is 39. The highest number of reported fires - 84 took place in 2014, and the least - 18 in 2006. The data has a rising trend.
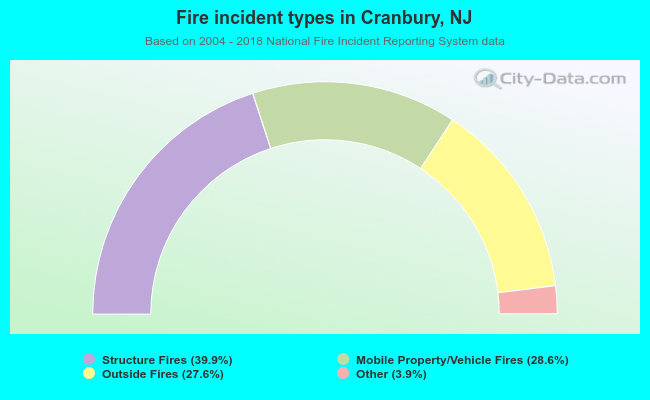 When looking into fire subcategories, the most incidents belonged to: Structure Fires (39.9%), and Mobile Property/Vehicle Fires (28.6%).
Fire-safe hotels and motels in Cranbury, New Jersey:
- Staybridge Suites Hotel, 1272 S River Rd, Cranbury, New Jersey 08512 , Phone: (609) 409-7181, Fax: (609) 409-7182
- TownePlace Suites Cranbury- South Brunswick, 2535 Rt 130, Cranbury, New Jersey 08512 , Phone: (844) 323-5221, Fax: (609) 655-4009
- Hampton Inn Cranbury, 1261 S River Rd, Cranbury, New Jersey 08512 , Phone: (609) 642-6440, Fax: (609) 642-8096
| Most common first names in Cranbury, NJ among deceased individuals | ||
| Name | Count | Lived (average) |
|---|---|---|
| John | 93 | 76.3 years |
| Joseph | 84 | 75.4 years |
| William | 80 | 76.0 years |
| Robert | 72 | 71.3 years |
| Helen | 72 | 80.6 years |
| Mary | 71 | 83.3 years |
| Edward | 65 | 76.7 years |
| Charles | 51 | 75.7 years |
| Ruth | 48 | 79.3 years |
| Frank | 45 | 79.3 years |
| Most common last names in Cranbury, NJ among deceased individuals | ||
| Last name | Count | Lived (average) |
|---|---|---|
| Cohen | 25 | 75.4 years |
| Smith | 19 | 77.2 years |
| Schwartz | 16 | 80.1 years |
| Miller | 16 | 78.5 years |
| Kaplan | 16 | 78.8 years |
| Johnson | 14 | 76.4 years |
| Goldstein | 13 | 82.0 years |
| Shapiro | 13 | 78.0 years |
| Goldberg | 12 | 75.4 years |
| Brown | 12 | 77.8 years |
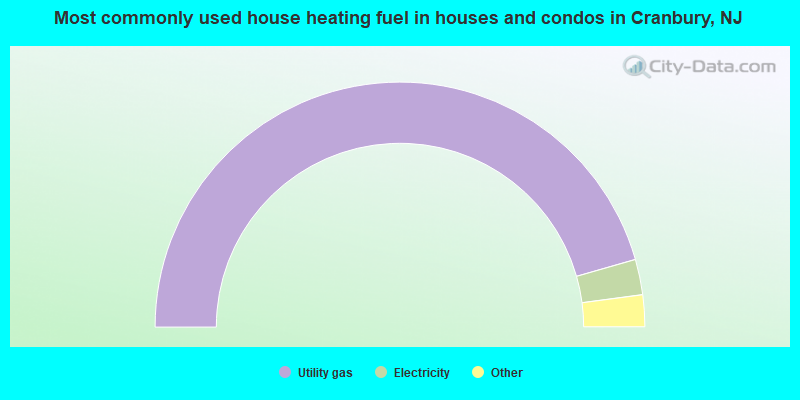
- 91.2%Utility gas
- 4.7%Electricity
- 3.2%Fuel oil, kerosene, etc.
- 1.0%Wood
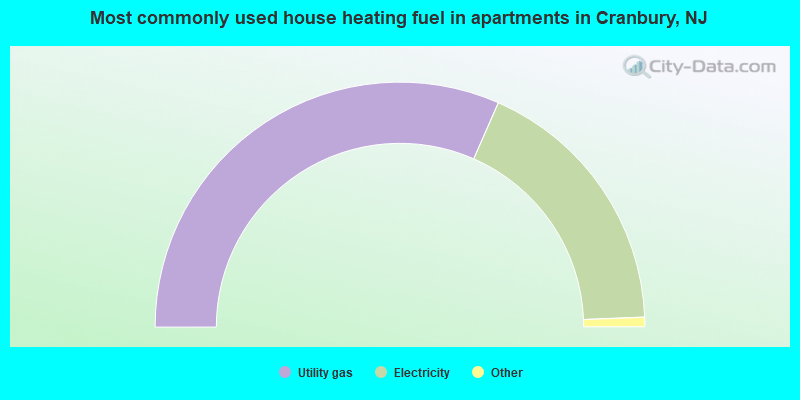
- 64.0%Utility gas
- 36.0%Electricity
Cranbury compared to New Jersey state average:
- Median household income above state average.
- Median house value above state average.
- Unemployed percentage significantly below state average.
- Hispanic race population percentage significantly below state average.
- Foreign-born population percentage below state average.
- Renting percentage below state average.
- Length of stay since moving in significantly above state average.
- Number of rooms per house above state average.
- Institutionalized population percentage significantly above state average.
- Percentage of population with a bachelor's degree or higher significantly above state average.
Cranbury on our top lists:
- #30 on the list of "Top 101 cities with the most residents born in Australia (population 500+)"
- #50 on the list of "Top 101 cities with the most residents born in Hong Kong (population 500+)"
- #53 on the list of "Top 101 cities with the most residents born in Australia and New Zealand Subregion (population 500+)"
- #90 on the list of "Top 101 cities with the most residents born in India (population 500+)"
- #15 on the list of "Top 101 counties with the most Orthodox adherents"
- #17 on the list of "Top 101 counties with the lowest percentage of residents that keep firearms around their homes"
- #24 on the list of "Top 101 counties with the lowest number of infant deaths per 1000 residents 2007-2013 (pop. 50,000+)"
- #25 on the list of "Top 101 counties with the largest decrease in the number of infant deaths per 1000 residents 2000-2006 to 2007-2013 (pop. 50,000+)"
- #29 on the list of "Top 101 counties with the most Catholic congregations"
State forum archive:
- New Jersey Pages: 2 3 4 5 6 7 8 9 10 11 12 13 14 15 16 17 18 19 20 21 22 23 24 25 26 27 28 29 30 31 32 33 34 35 36 37 38 39 40 41 42 43 44 45 46 47 48 49 50 51 52 53 54 55 56 57 58 59 60 61 62 63 64 65 66 67 68 69 70 71 72 73 74 75 76 77 78 79 80 81 82 83 84 85 86 87 88 89 90 91 92 93 94 95 96 97 98 99 100 101 102 103 104 105 106 107 108 109 110 111 112 113 114 115 116 117 118 119 120 121 122 123 124 125 126 127 128 129 130 131 132 133 134 135 136 137 138 139 140 141 142 143 144 145 146 147 148 149 150 151 152 153 154 155 156 157 158 159 160 161 162 163 164 165 166 167 168 169 170 171 172 173 174 175 176 177 178 179 180 181 182 183 184 185 186 187 188 189 190 191 192 193 194 195 196 197 198 199 200 201 202 203 204 205 206 207

|
|
Total of 759 patent applications in 2008-2024.