Denison, Texas Submit your own pictures of this city and show them to the world
OSM Map
General Map
Google Map
MSN Map
OSM Map
General Map
Google Map
MSN Map
OSM Map
General Map
Google Map
MSN Map
OSM Map
General Map
Google Map
MSN Map
Please wait while loading the map...
Population in 2022: 26,328 (96% urban, 4% rural). Population change since 2000: +15.6%Males: 12,516 Females: 13,812
March 2022 cost of living index in Denison: 85.3 (less than average, U.S. average is 100) Percentage of residents living in poverty in 2022: 18.1%for White Non-Hispanic residents , 22.2% for Black residents , 25.6% for Hispanic or Latino residents , 11.1% for American Indian residents , 69.0% for other race residents , 19.9% for two or more races residents )
Profiles of local businesses
Business Search - 14 Million verified businesses
Data:
Median household income ($)
Median household income (% change since 2000)
Household income diversity
Ratio of average income to average house value (%)
Ratio of average income to average rent
Median household income ($) - White
Median household income ($) - Black or African American
Median household income ($) - Asian
Median household income ($) - Hispanic or Latino
Median household income ($) - American Indian and Alaska Native
Median household income ($) - Multirace
Median household income ($) - Other Race
Median household income for houses/condos with a mortgage ($)
Median household income for apartments without a mortgage ($)
Races - White alone (%)
Races - White alone (% change since 2000)
Races - Black alone (%)
Races - Black alone (% change since 2000)
Races - American Indian alone (%)
Races - American Indian alone (% change since 2000)
Races - Asian alone (%)
Races - Asian alone (% change since 2000)
Races - Hispanic (%)
Races - Hispanic (% change since 2000)
Races - Native Hawaiian and Other Pacific Islander alone (%)
Races - Native Hawaiian and Other Pacific Islander alone (% change since 2000)
Races - Two or more races (%)
Races - Two or more races (% change since 2000)
Races - Other race alone (%)
Races - Other race alone (% change since 2000)
Racial diversity
Unemployment (%)
Unemployment (% change since 2000)
Unemployment (%) - White
Unemployment (%) - Black or African American
Unemployment (%) - Asian
Unemployment (%) - Hispanic or Latino
Unemployment (%) - American Indian and Alaska Native
Unemployment (%) - Multirace
Unemployment (%) - Other Race
Population density (people per square mile)
Population - Males (%)
Population - Females (%)
Population - Males (%) - White
Population - Males (%) - Black or African American
Population - Males (%) - Asian
Population - Males (%) - Hispanic or Latino
Population - Males (%) - American Indian and Alaska Native
Population - Males (%) - Multirace
Population - Males (%) - Other Race
Population - Females (%) - White
Population - Females (%) - Black or African American
Population - Females (%) - Asian
Population - Females (%) - Hispanic or Latino
Population - Females (%) - American Indian and Alaska Native
Population - Females (%) - Multirace
Population - Females (%) - Other Race
Coronavirus confirmed cases (Apr 19, 2024)
Deaths caused by coronavirus (Apr 19, 2024)
Coronavirus confirmed cases (per 100k population) (Apr 19, 2024)
Deaths caused by coronavirus (per 100k population) (Apr 19, 2024)
Daily increase in number of cases (Apr 19, 2024)
Weekly increase in number of cases (Apr 19, 2024)
Cases doubled (in days) (Apr 19, 2024)
Hospitalized patients (Apr 18, 2022)
Negative test results (Apr 18, 2022)
Total test results (Apr 18, 2022)
COVID Vaccine doses distributed (per 100k population) (Sep 19, 2023)
COVID Vaccine doses administered (per 100k population) (Sep 19, 2023)
COVID Vaccine doses distributed (Sep 19, 2023)
COVID Vaccine doses administered (Sep 19, 2023)
Likely homosexual households (%)
Likely homosexual households (% change since 2000)
Likely homosexual households - Lesbian couples (%)
Likely homosexual households - Lesbian couples (% change since 2000)
Likely homosexual households - Gay men (%)
Likely homosexual households - Gay men (% change since 2000)
Cost of living index
Median gross rent ($)
Median contract rent ($)
Median monthly housing costs ($)
Median house or condo value ($)
Median house or condo value ($ change since 2000)
Mean house or condo value by units in structure - 1, detached ($)
Mean house or condo value by units in structure - 1, attached ($)
Mean house or condo value by units in structure - 2 ($)
Mean house or condo value by units in structure by units in structure - 3 or 4 ($)
Mean house or condo value by units in structure - 5 or more ($)
Mean house or condo value by units in structure - Boat, RV, van, etc. ($)
Mean house or condo value by units in structure - Mobile home ($)
Median house or condo value ($) - White
Median house or condo value ($) - Black or African American
Median house or condo value ($) - Asian
Median house or condo value ($) - Hispanic or Latino
Median house or condo value ($) - American Indian and Alaska Native
Median house or condo value ($) - Multirace
Median house or condo value ($) - Other Race
Median resident age
Resident age diversity
Median resident age - Males
Median resident age - Females
Median resident age - White
Median resident age - Black or African American
Median resident age - Asian
Median resident age - Hispanic or Latino
Median resident age - American Indian and Alaska Native
Median resident age - Multirace
Median resident age - Other Race
Median resident age - Males - White
Median resident age - Males - Black or African American
Median resident age - Males - Asian
Median resident age - Males - Hispanic or Latino
Median resident age - Males - American Indian and Alaska Native
Median resident age - Males - Multirace
Median resident age - Males - Other Race
Median resident age - Females - White
Median resident age - Females - Black or African American
Median resident age - Females - Asian
Median resident age - Females - Hispanic or Latino
Median resident age - Females - American Indian and Alaska Native
Median resident age - Females - Multirace
Median resident age - Females - Other Race
Commute - mean travel time to work (minutes)
Travel time to work - Less than 5 minutes (%)
Travel time to work - Less than 5 minutes (% change since 2000)
Travel time to work - 5 to 9 minutes (%)
Travel time to work - 5 to 9 minutes (% change since 2000)
Travel time to work - 10 to 19 minutes (%)
Travel time to work - 10 to 19 minutes (% change since 2000)
Travel time to work - 20 to 29 minutes (%)
Travel time to work - 20 to 29 minutes (% change since 2000)
Travel time to work - 30 to 39 minutes (%)
Travel time to work - 30 to 39 minutes (% change since 2000)
Travel time to work - 40 to 59 minutes (%)
Travel time to work - 40 to 59 minutes (% change since 2000)
Travel time to work - 60 to 89 minutes (%)
Travel time to work - 60 to 89 minutes (% change since 2000)
Travel time to work - 90 or more minutes (%)
Travel time to work - 90 or more minutes (% change since 2000)
Marital status - Never married (%)
Marital status - Now married (%)
Marital status - Separated (%)
Marital status - Widowed (%)
Marital status - Divorced (%)
Median family income ($)
Median family income (% change since 2000)
Median non-family income ($)
Median non-family income (% change since 2000)
Median per capita income ($)
Median per capita income (% change since 2000)
Median family income ($) - White
Median family income ($) - Black or African American
Median family income ($) - Asian
Median family income ($) - Hispanic or Latino
Median family income ($) - American Indian and Alaska Native
Median family income ($) - Multirace
Median family income ($) - Other Race
Median year house/condo built
Median year apartment built
Year house built - Built 2005 or later (%)
Year house built - Built 2000 to 2004 (%)
Year house built - Built 1990 to 1999 (%)
Year house built - Built 1980 to 1989 (%)
Year house built - Built 1970 to 1979 (%)
Year house built - Built 1960 to 1969 (%)
Year house built - Built 1950 to 1959 (%)
Year house built - Built 1940 to 1949 (%)
Year house built - Built 1939 or earlier (%)
Average household size
Household density (households per square mile)
Average household size - White
Average household size - Black or African American
Average household size - Asian
Average household size - Hispanic or Latino
Average household size - American Indian and Alaska Native
Average household size - Multirace
Average household size - Other Race
Occupied housing units (%)
Vacant housing units (%)
Owner occupied housing units (%)
Renter occupied housing units (%)
Vacancy status - For rent (%)
Vacancy status - For sale only (%)
Vacancy status - Rented or sold, not occupied (%)
Vacancy status - For seasonal, recreational, or occasional use (%)
Vacancy status - For migrant workers (%)
Vacancy status - Other vacant (%)
Residents with income below the poverty level (%)
Residents with income below 50% of the poverty level (%)
Children below poverty level (%)
Poor families by family type - Married-couple family (%)
Poor families by family type - Male, no wife present (%)
Poor families by family type - Female, no husband present (%)
Poverty status for native-born residents (%)
Poverty status for foreign-born residents (%)
Poverty among high school graduates not in families (%)
Poverty among people who did not graduate high school not in families (%)
Residents with income below the poverty level (%) - White
Residents with income below the poverty level (%) - Black or African American
Residents with income below the poverty level (%) - Asian
Residents with income below the poverty level (%) - Hispanic or Latino
Residents with income below the poverty level (%) - American Indian and Alaska Native
Residents with income below the poverty level (%) - Multirace
Residents with income below the poverty level (%) - Other Race
Air pollution - Air Quality Index (AQI)
Air pollution - CO
Air pollution - NO2
Air pollution - SO2
Air pollution - Ozone
Air pollution - PM10
Air pollution - PM25
Air pollution - Pb
Crime - Murders per 100,000 population
Crime - Rapes per 100,000 population
Crime - Robberies per 100,000 population
Crime - Assaults per 100,000 population
Crime - Burglaries per 100,000 population
Crime - Thefts per 100,000 population
Crime - Auto thefts per 100,000 population
Crime - Arson per 100,000 population
Crime - City-data.com crime index
Crime - Violent crime index
Crime - Property crime index
Crime - Murders per 100,000 population (5 year average)
Crime - Rapes per 100,000 population (5 year average)
Crime - Robberies per 100,000 population (5 year average)
Crime - Assaults per 100,000 population (5 year average)
Crime - Burglaries per 100,000 population (5 year average)
Crime - Thefts per 100,000 population (5 year average)
Crime - Auto thefts per 100,000 population (5 year average)
Crime - Arson per 100,000 population (5 year average)
Crime - City-data.com crime index (5 year average)
Crime - Violent crime index (5 year average)
Crime - Property crime index (5 year average)
1996 Presidential Elections Results (%) - Democratic Party (Clinton)
1996 Presidential Elections Results (%) - Republican Party (Dole)
1996 Presidential Elections Results (%) - Other
2000 Presidential Elections Results (%) - Democratic Party (Gore)
2000 Presidential Elections Results (%) - Republican Party (Bush)
2000 Presidential Elections Results (%) - Other
2004 Presidential Elections Results (%) - Democratic Party (Kerry)
2004 Presidential Elections Results (%) - Republican Party (Bush)
2004 Presidential Elections Results (%) - Other
2008 Presidential Elections Results (%) - Democratic Party (Obama)
2008 Presidential Elections Results (%) - Republican Party (McCain)
2008 Presidential Elections Results (%) - Other
2012 Presidential Elections Results (%) - Democratic Party (Obama)
2012 Presidential Elections Results (%) - Republican Party (Romney)
2012 Presidential Elections Results (%) - Other
2016 Presidential Elections Results (%) - Democratic Party (Clinton)
2016 Presidential Elections Results (%) - Republican Party (Trump)
2016 Presidential Elections Results (%) - Other
2020 Presidential Elections Results (%) - Democratic Party (Biden)
2020 Presidential Elections Results (%) - Republican Party (Trump)
2020 Presidential Elections Results (%) - Other
Ancestries Reported - Arab (%)
Ancestries Reported - Czech (%)
Ancestries Reported - Danish (%)
Ancestries Reported - Dutch (%)
Ancestries Reported - English (%)
Ancestries Reported - French (%)
Ancestries Reported - French Canadian (%)
Ancestries Reported - German (%)
Ancestries Reported - Greek (%)
Ancestries Reported - Hungarian (%)
Ancestries Reported - Irish (%)
Ancestries Reported - Italian (%)
Ancestries Reported - Lithuanian (%)
Ancestries Reported - Norwegian (%)
Ancestries Reported - Polish (%)
Ancestries Reported - Portuguese (%)
Ancestries Reported - Russian (%)
Ancestries Reported - Scotch-Irish (%)
Ancestries Reported - Scottish (%)
Ancestries Reported - Slovak (%)
Ancestries Reported - Subsaharan African (%)
Ancestries Reported - Swedish (%)
Ancestries Reported - Swiss (%)
Ancestries Reported - Ukrainian (%)
Ancestries Reported - United States (%)
Ancestries Reported - Welsh (%)
Ancestries Reported - West Indian (%)
Ancestries Reported - Other (%)
Educational Attainment - No schooling completed (%)
Educational Attainment - Less than high school (%)
Educational Attainment - High school or equivalent (%)
Educational Attainment - Less than 1 year of college (%)
Educational Attainment - 1 or more years of college (%)
Educational Attainment - Associate degree (%)
Educational Attainment - Bachelor's degree (%)
Educational Attainment - Master's degree (%)
Educational Attainment - Professional school degree (%)
Educational Attainment - Doctorate degree (%)
School Enrollment - Nursery, preschool (%)
School Enrollment - Kindergarten (%)
School Enrollment - Grade 1 to 4 (%)
School Enrollment - Grade 5 to 8 (%)
School Enrollment - Grade 9 to 12 (%)
School Enrollment - College undergrad (%)
School Enrollment - Graduate or professional (%)
School Enrollment - Not enrolled in school (%)
School enrollment - Public schools (%)
School enrollment - Private schools (%)
School enrollment - Not enrolled (%)
Median number of rooms in houses and condos
Median number of rooms in apartments
Housing units lacking complete plumbing facilities (%)
Housing units lacking complete kitchen facilities (%)
Density of houses
Urban houses (%)
Rural houses (%)
Households with people 60 years and over (%)
Households with people 65 years and over (%)
Households with people 75 years and over (%)
Households with one or more nonrelatives (%)
Households with no nonrelatives (%)
Population in households (%)
Family households (%)
Nonfamily households (%)
Population in families (%)
Family households with own children (%)
Median number of bedrooms in owner occupied houses
Mean number of bedrooms in owner occupied houses
Median number of bedrooms in renter occupied houses
Mean number of bedrooms in renter occupied houses
Median number of vehichles in owner occupied houses
Mean number of vehichles in owner occupied houses
Median number of vehichles in renter occupied houses
Mean number of vehichles in renter occupied houses
Mortgage status - with mortgage (%)
Mortgage status - with second mortgage (%)
Mortgage status - with home equity loan (%)
Mortgage status - with both second mortgage and home equity loan (%)
Mortgage status - without a mortgage (%)
Average family size
Average family size - White
Average family size - Black or African American
Average family size - Asian
Average family size - Hispanic or Latino
Average family size - American Indian and Alaska Native
Average family size - Multirace
Average family size - Other Race
Geographical mobility - Same house 1 year ago (%)
Geographical mobility - Moved within same county (%)
Geographical mobility - Moved from different county within same state (%)
Geographical mobility - Moved from different state (%)
Geographical mobility - Moved from abroad (%)
Place of birth - Born in state of residence (%)
Place of birth - Born in other state (%)
Place of birth - Native, outside of US (%)
Place of birth - Foreign born (%)
Housing units in structures - 1, detached (%)
Housing units in structures - 1, attached (%)
Housing units in structures - 2 (%)
Housing units in structures - 3 or 4 (%)
Housing units in structures - 5 to 9 (%)
Housing units in structures - 10 to 19 (%)
Housing units in structures - 20 to 49 (%)
Housing units in structures - 50 or more (%)
Housing units in structures - Mobile home (%)
Housing units in structures - Boat, RV, van, etc. (%)
House/condo owner moved in on average (years ago)
Renter moved in on average (years ago)
Year householder moved into unit - Moved in 1999 to March 2000 (%)
Year householder moved into unit - Moved in 1995 to 1998 (%)
Year householder moved into unit - Moved in 1990 to 1994 (%)
Year householder moved into unit - Moved in 1980 to 1989 (%)
Year householder moved into unit - Moved in 1970 to 1979 (%)
Year householder moved into unit - Moved in 1969 or earlier (%)
Means of transportation to work - Drove car alone (%)
Means of transportation to work - Carpooled (%)
Means of transportation to work - Public transportation (%)
Means of transportation to work - Bus or trolley bus (%)
Means of transportation to work - Streetcar or trolley car (%)
Means of transportation to work - Subway or elevated (%)
Means of transportation to work - Railroad (%)
Means of transportation to work - Ferryboat (%)
Means of transportation to work - Taxicab (%)
Means of transportation to work - Motorcycle (%)
Means of transportation to work - Bicycle (%)
Means of transportation to work - Walked (%)
Means of transportation to work - Other means (%)
Working at home (%)
Industry diversity
Most Common Industries - Agriculture, forestry, fishing and hunting, and mining (%)
Most Common Industries - Agriculture, forestry, fishing and hunting (%)
Most Common Industries - Mining, quarrying, and oil and gas extraction (%)
Most Common Industries - Construction (%)
Most Common Industries - Manufacturing (%)
Most Common Industries - Wholesale trade (%)
Most Common Industries - Retail trade (%)
Most Common Industries - Transportation and warehousing, and utilities (%)
Most Common Industries - Transportation and warehousing (%)
Most Common Industries - Utilities (%)
Most Common Industries - Information (%)
Most Common Industries - Finance and insurance, and real estate and rental and leasing (%)
Most Common Industries - Finance and insurance (%)
Most Common Industries - Real estate and rental and leasing (%)
Most Common Industries - Professional, scientific, and management, and administrative and waste management services (%)
Most Common Industries - Professional, scientific, and technical services (%)
Most Common Industries - Management of companies and enterprises (%)
Most Common Industries - Administrative and support and waste management services (%)
Most Common Industries - Educational services, and health care and social assistance (%)
Most Common Industries - Educational services (%)
Most Common Industries - Health care and social assistance (%)
Most Common Industries - Arts, entertainment, and recreation, and accommodation and food services (%)
Most Common Industries - Arts, entertainment, and recreation (%)
Most Common Industries - Accommodation and food services (%)
Most Common Industries - Other services, except public administration (%)
Most Common Industries - Public administration (%)
Occupation diversity
Most Common Occupations - Management, business, science, and arts occupations (%)
Most Common Occupations - Management, business, and financial occupations (%)
Most Common Occupations - Management occupations (%)
Most Common Occupations - Business and financial operations occupations (%)
Most Common Occupations - Computer, engineering, and science occupations (%)
Most Common Occupations - Computer and mathematical occupations (%)
Most Common Occupations - Architecture and engineering occupations (%)
Most Common Occupations - Life, physical, and social science occupations (%)
Most Common Occupations - Education, legal, community service, arts, and media occupations (%)
Most Common Occupations - Community and social service occupations (%)
Most Common Occupations - Legal occupations (%)
Most Common Occupations - Education, training, and library occupations (%)
Most Common Occupations - Arts, design, entertainment, sports, and media occupations (%)
Most Common Occupations - Healthcare practitioners and technical occupations (%)
Most Common Occupations - Health diagnosing and treating practitioners and other technical occupations (%)
Most Common Occupations - Health technologists and technicians (%)
Most Common Occupations - Service occupations (%)
Most Common Occupations - Healthcare support occupations (%)
Most Common Occupations - Protective service occupations (%)
Most Common Occupations - Fire fighting and prevention, and other protective service workers including supervisors (%)
Most Common Occupations - Law enforcement workers including supervisors (%)
Most Common Occupations - Food preparation and serving related occupations (%)
Most Common Occupations - Building and grounds cleaning and maintenance occupations (%)
Most Common Occupations - Personal care and service occupations (%)
Most Common Occupations - Sales and office occupations (%)
Most Common Occupations - Sales and related occupations (%)
Most Common Occupations - Office and administrative support occupations (%)
Most Common Occupations - Natural resources, construction, and maintenance occupations (%)
Most Common Occupations - Farming, fishing, and forestry occupations (%)
Most Common Occupations - Construction and extraction occupations (%)
Most Common Occupations - Installation, maintenance, and repair occupations (%)
Most Common Occupations - Production, transportation, and material moving occupations (%)
Most Common Occupations - Production occupations (%)
Most Common Occupations - Transportation occupations (%)
Most Common Occupations - Material moving occupations (%)
People in Group quarters - Institutionalized population (%)
People in Group quarters - Correctional institutions (%)
People in Group quarters - Federal prisons and detention centers (%)
People in Group quarters - Halfway houses (%)
People in Group quarters - Local jails and other confinement facilities (including police lockups) (%)
People in Group quarters - Military disciplinary barracks (%)
People in Group quarters - State prisons (%)
People in Group quarters - Other types of correctional institutions (%)
People in Group quarters - Nursing homes (%)
People in Group quarters - Hospitals/wards, hospices, and schools for the handicapped (%)
People in Group quarters - Hospitals/wards and hospices for chronically ill (%)
People in Group quarters - Hospices or homes for chronically ill (%)
People in Group quarters - Military hospitals or wards for chronically ill (%)
People in Group quarters - Other hospitals or wards for chronically ill (%)
People in Group quarters - Hospitals or wards for drug/alcohol abuse (%)
People in Group quarters - Mental (Psychiatric) hospitals or wards (%)
People in Group quarters - Schools, hospitals, or wards for the mentally retarded (%)
People in Group quarters - Schools, hospitals, or wards for the physically handicapped (%)
People in Group quarters - Institutions for the deaf (%)
People in Group quarters - Institutions for the blind (%)
People in Group quarters - Orthopedic wards and institutions for the physically handicapped (%)
People in Group quarters - Wards in general hospitals for patients who have no usual home elsewhere (%)
People in Group quarters - Wards in military hospitals for patients who have no usual home elsewhere (%)
People in Group quarters - Juvenile institutions (%)
People in Group quarters - Long-term care (%)
People in Group quarters - Homes for abused, dependent, and neglected children (%)
People in Group quarters - Residential treatment centers for emotionally disturbed children (%)
People in Group quarters - Training schools for juvenile delinquents (%)
People in Group quarters - Short-term care, detention or diagnostic centers for delinquent children (%)
People in Group quarters - Type of juvenile institution unknown (%)
People in Group quarters - Noninstitutionalized population (%)
People in Group quarters - College dormitories (includes college quarters off campus) (%)
People in Group quarters - Military quarters (%)
People in Group quarters - On base (%)
People in Group quarters - Barracks, unaccompanied personnel housing (UPH), (Enlisted/Officer), ;and similar group living quarters for military personnel (%)
People in Group quarters - Transient quarters for temporary residents (%)
People in Group quarters - Military ships (%)
People in Group quarters - Group homes (%)
People in Group quarters - Homes or halfway houses for drug/alcohol abuse (%)
People in Group quarters - Homes for the mentally ill (%)
People in Group quarters - Homes for the mentally retarded (%)
People in Group quarters - Homes for the physically handicapped (%)
People in Group quarters - Other group homes (%)
People in Group quarters - Religious group quarters (%)
People in Group quarters - Dormitories (%)
People in Group quarters - Agriculture workers' dormitories on farms (%)
People in Group quarters - Job Corps and vocational training facilities (%)
People in Group quarters - Other workers' dormitories (%)
People in Group quarters - Crews of maritime vessels (%)
People in Group quarters - Other nonhousehold living situations (%)
People in Group quarters - Other noninstitutional group quarters (%)
Residents speaking English at home (%)
Residents speaking English at home - Born in the United States (%)
Residents speaking English at home - Native, born elsewhere (%)
Residents speaking English at home - Foreign born (%)
Residents speaking Spanish at home (%)
Residents speaking Spanish at home - Born in the United States (%)
Residents speaking Spanish at home - Native, born elsewhere (%)
Residents speaking Spanish at home - Foreign born (%)
Residents speaking other language at home (%)
Residents speaking other language at home - Born in the United States (%)
Residents speaking other language at home - Native, born elsewhere (%)
Residents speaking other language at home - Foreign born (%)
Class of Workers - Employee of private company (%)
Class of Workers - Self-employed in own incorporated business (%)
Class of Workers - Private not-for-profit wage and salary workers (%)
Class of Workers - Local government workers (%)
Class of Workers - State government workers (%)
Class of Workers - Federal government workers (%)
Class of Workers - Self-employed workers in own not incorporated business and Unpaid family workers (%)
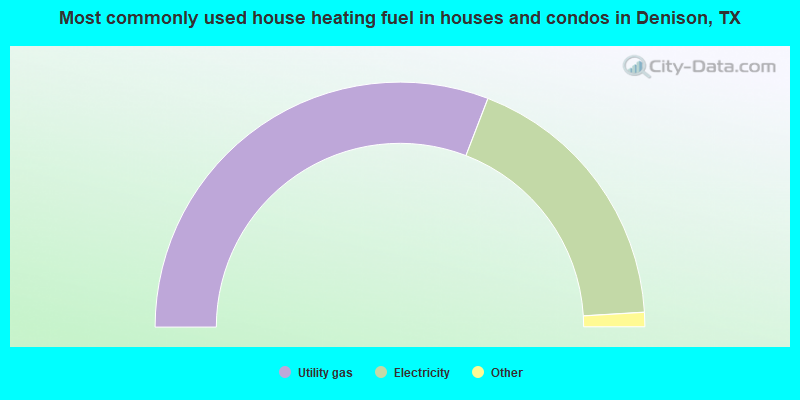
House heating fuel used in houses and condos - Utility gas (%)
House heating fuel used in houses and condos - Bottled, tank, or LP gas (%)
House heating fuel used in houses and condos - Electricity (%)
House heating fuel used in houses and condos - Fuel oil, kerosene, etc. (%)
House heating fuel used in houses and condos - Coal or coke (%)
House heating fuel used in houses and condos - Wood (%)
House heating fuel used in houses and condos - Solar energy (%)
House heating fuel used in houses and condos - Other fuel (%)
House heating fuel used in houses and condos - No fuel used (%)
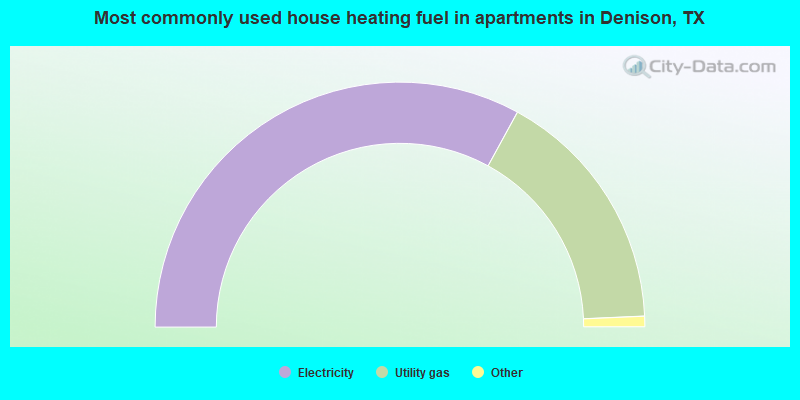
House heating fuel used in apartments - Utility gas (%)
House heating fuel used in apartments - Bottled, tank, or LP gas (%)
House heating fuel used in apartments - Electricity (%)
House heating fuel used in apartments - Fuel oil, kerosene, etc. (%)
House heating fuel used in apartments - Coal or coke (%)
House heating fuel used in apartments - Wood (%)
House heating fuel used in apartments - Solar energy (%)
House heating fuel used in apartments - Other fuel (%)
House heating fuel used in apartments - No fuel used (%)
Armed forces status - In Armed Forces (%)
Armed forces status - Civilian (%)
Armed forces status - Civilian - Veteran (%)
Armed forces status - Civilian - Nonveteran (%)
Fatal accidents locations in years 2005-2021
Fatal accidents locations in 2005
Fatal accidents locations in 2006
Fatal accidents locations in 2007
Fatal accidents locations in 2008
Fatal accidents locations in 2009
Fatal accidents locations in 2010
Fatal accidents locations in 2011
Fatal accidents locations in 2012
Fatal accidents locations in 2013
Fatal accidents locations in 2014
Fatal accidents locations in 2015
Fatal accidents locations in 2016
Fatal accidents locations in 2017
Fatal accidents locations in 2018
Fatal accidents locations in 2019
Fatal accidents locations in 2020
Fatal accidents locations in 2021
Alcohol use - People drinking some alcohol every month (%)
Alcohol use - People not drinking at all (%)
Alcohol use - Average days/month drinking alcohol
Alcohol use - Average drinks/week
Alcohol use - Average days/year people drink much
Audiometry - Average condition of hearing (%)
Audiometry - People that can hear a whisper from across a quiet room (%)
Audiometry - People that can hear normal voice from across a quiet room (%)
Audiometry - Ears ringing, roaring, buzzing (%)
Audiometry - Had a job exposure to loud noise (%)
Audiometry - Had off-work exposure to loud noise (%)
Blood Pressure & Cholesterol - Has high blood pressure (%)
Blood Pressure & Cholesterol - Checking blood pressure at home (%)
Blood Pressure & Cholesterol - Frequently checking blood cholesterol (%)
Blood Pressure & Cholesterol - Has high cholesterol level (%)
Consumer Behavior - Money monthly spent on food at supermarket/grocery store
Consumer Behavior - Money monthly spent on food at other stores
Consumer Behavior - Money monthly spent on eating out
Consumer Behavior - Money monthly spent on carryout/delivered foods
Consumer Behavior - Income spent on food at supermarket/grocery store (%)
Consumer Behavior - Income spent on food at other stores (%)
Consumer Behavior - Income spent on eating out (%)
Consumer Behavior - Income spent on carryout/delivered foods (%)
Current Health Status - General health condition (%)
Current Health Status - Blood donors (%)
Current Health Status - Has blood ever tested for HIV virus (%)
Current Health Status - Left-handed people (%)
Dermatology - People using sunscreen (%)
Diabetes - Diabetics (%)
Diabetes - Had a blood test for high blood sugar (%)
Diabetes - People taking insulin (%)
Diet Behavior & Nutrition - Diet health (%)
Diet Behavior & Nutrition - Milk product consumption (# of products/month)
Diet Behavior & Nutrition - Meals not home prepared (#/week)
Diet Behavior & Nutrition - Meals from fast food or pizza place (#/week)
Diet Behavior & Nutrition - Ready-to-eat foods (#/month)
Diet Behavior & Nutrition - Frozen meals/pizza (#/month)
Drug Use - People that ever used marijuana or hashish (%)
Drug Use - Ever used hard drugs (%)
Drug Use - Ever used any form of cocaine (%)
Drug Use - Ever used heroin (%)
Drug Use - Ever used methamphetamine (%)
Health Insurance - People covered by health insurance (%)
Kidney Conditions-Urology - Avg. # of times urinating at night
Medical Conditions - People with asthma (%)
Medical Conditions - People with anemia (%)
Medical Conditions - People with psoriasis (%)
Medical Conditions - People with overweight (%)
Medical Conditions - Elderly people having difficulties in thinking or remembering (%)
Medical Conditions - People who ever received blood transfusion (%)
Medical Conditions - People having trouble seeing even with glass/contacts (%)
Medical Conditions - People with arthritis (%)
Medical Conditions - People with gout (%)
Medical Conditions - People with congestive heart failure (%)
Medical Conditions - People with coronary heart disease (%)
Medical Conditions - People with angina pectoris (%)
Medical Conditions - People who ever had heart attack (%)
Medical Conditions - People who ever had stroke (%)
Medical Conditions - People with emphysema (%)
Medical Conditions - People with thyroid problem (%)
Medical Conditions - People with chronic bronchitis (%)
Medical Conditions - People with any liver condition (%)
Medical Conditions - People who ever had cancer or malignancy (%)
Mental Health - People who have little interest in doing things (%)
Mental Health - People feeling down, depressed, or hopeless (%)
Mental Health - People who have trouble sleeping or sleeping too much (%)
Mental Health - People feeling tired or having little energy (%)
Mental Health - People with poor appetite or overeating (%)
Mental Health - People feeling bad about themself (%)
Mental Health - People who have trouble concentrating on things (%)
Mental Health - People moving or speaking slowly or too fast (%)
Mental Health - People having thoughts they would be better off dead (%)
Oral Health - Average years since last visit a dentist
Oral Health - People embarrassed because of mouth (%)
Oral Health - People with gum disease (%)
Oral Health - General health of teeth and gums (%)
Oral Health - Average days a week using dental floss/device
Oral Health - Average days a week using mouthwash for dental problem
Oral Health - Average number of teeth
Pesticide Use - Households using pesticides to control insects (%)
Pesticide Use - Households using pesticides to kill weeds (%)
Physical Activity - People doing vigorous-intensity work activities (%)
Physical Activity - People doing moderate-intensity work activities (%)
Physical Activity - People walking or bicycling (%)
Physical Activity - People doing vigorous-intensity recreational activities (%)
Physical Activity - People doing moderate-intensity recreational activities (%)
Physical Activity - Average hours a day doing sedentary activities
Physical Activity - Average hours a day watching TV or videos
Physical Activity - Average hours a day using computer
Physical Functioning - People having limitations keeping them from working (%)
Physical Functioning - People limited in amount of work they can do (%)
Physical Functioning - People that need special equipment to walk (%)
Physical Functioning - People experiencing confusion/memory problems (%)
Physical Functioning - People requiring special healthcare equipment (%)
Prescription Medications - Average number of prescription medicines taking
Preventive Aspirin Use - Adults 40+ taking low-dose aspirin (%)
Reproductive Health - Vaginal deliveries (%)
Reproductive Health - Cesarean deliveries (%)
Reproductive Health - Deliveries resulted in a live birth (%)
Reproductive Health - Pregnancies resulted in a delivery (%)
Reproductive Health - Women breastfeeding newborns (%)
Reproductive Health - Women that had a hysterectomy (%)
Reproductive Health - Women that had both ovaries removed (%)
Reproductive Health - Women that have ever taken birth control pills (%)
Reproductive Health - Women taking birth control pills (%)
Reproductive Health - Women that have ever used Depo-Provera or injectables (%)
Reproductive Health - Women that have ever used female hormones (%)
Sexual Behavior - People 18+ that ever had sex (vaginal, anal, or oral) (%)
Sexual Behavior - Males 18+ that ever had vaginal sex with a woman (%)
Sexual Behavior - Males 18+ that ever performed oral sex on a woman (%)
Sexual Behavior - Males 18+ that ever had anal sex with a woman (%)
Sexual Behavior - Males 18+ that ever had any sex with a man (%)
Sexual Behavior - Females 18+ that ever had vaginal sex with a man (%)
Sexual Behavior - Females 18+ that ever performed oral sex on a man (%)
Sexual Behavior - Females 18+ that ever had anal sex with a man (%)
Sexual Behavior - Females 18+ that ever had any kind of sex with a woman (%)
Sexual Behavior - Average age people first had sex
Sexual Behavior - Average number of female sex partners in lifetime (males 18+)
Sexual Behavior - Average number of female vaginal sex partners in lifetime (males 18+)
Sexual Behavior - Average age people first performed oral sex on a woman (18+)
Sexual Behavior - Average number of woman performed oral sex on in lifetime (18+)
Sexual Behavior - Average number of male sex partners in lifetime (males 18+)
Sexual Behavior - Average number of male anal sex partners in lifetime (males 18+)
Sexual Behavior - Average age people first performed oral sex on a man (18+)
Sexual Behavior - Average number of male oral sex partners in lifetime (18+)
Sexual Behavior - People using protection when performing oral sex (%)
Sexual Behavior - Average number of times people have vaginal or anal sex a year
Sexual Behavior - People having sex without condom (%)
Sexual Behavior - Average number of male sex partners in lifetime (females 18+)
Sexual Behavior - Average number of male vaginal sex partners in lifetime (females 18+)
Sexual Behavior - Average number of female sex partners in lifetime (females 18+)
Sexual Behavior - Circumcised males 18+ (%)
Sleep Disorders - Average hours sleeping at night
Sleep Disorders - People that has trouble sleeping (%)
Smoking-Cigarette Use - People smoking cigarettes (%)
Taste & Smell - People 40+ having problems with smell (%)
Taste & Smell - People 40+ having problems with taste (%)
Taste & Smell - People 40+ that ever had wisdom teeth removed (%)
Taste & Smell - People 40+ that ever had tonsils teeth removed (%)
Taste & Smell - People 40+ that ever had a loss of consciousness because of a head injury (%)
Taste & Smell - People 40+ that ever had a broken nose or other serious injury to face or skull (%)
Taste & Smell - People 40+ that ever had two or more sinus infections (%)
Weight - Average height (inches)
Weight - Average weight (pounds)
Weight - Average BMI
Weight - People that are obese (%)
Weight - People that ever were obese (%)
Weight - People trying to lose weight (%)
Officers per 1,000 residents here:
1.91Texas average:
2.07
Latest news from Denison, TX collected exclusively by city-data.com from local newspapers, TV, and radio stations
Ancestries: American (11.3%), English (10.2%), Irish (7.7%), German (5.3%), European (3.2%), Italian (2.6%).
Current Local Time:
Land area: 22.6 square miles.
Population density: 1,165 people per square mile (low).
708 residents are foreign born (2.3% Latin America ).
This city:
2.7%Texas:
17.1%
Median real estate property taxes paid for housing units with mortgages in 2022: $2,655 (1.6%)Median real estate property taxes paid for housing units with no mortgage in 2022: $2,096 (1.2%)
Nearest city with pop. 50,000+: East Grayson, TX (8.1 miles
Nearest city with pop. 200,000+: Plano, TX
Nearest city with pop. 1,000,000+: Dallas, TX
Nearest cities:
Hendrix, OK (3.0 miles),
Latitude: 33.75 N, Longitude: 96.56 W
Nickname or alias (official or unofficial): Wine Root Stock Capital of the World
Daytime population change due to commuting: +484 (+1.9%)Workers who live and work in this city: 4,391 (40.0%)
Single-family new house construction building permits:
2022: 185 buildings , average cost: $256,2002021: 384 buildings , average cost: $191,3002020: 171 buildings , average cost: $93,3002019: 194 buildings , average cost: $169,4002018: 158 buildings , average cost: $202,6002017: 153 buildings , average cost: $152,5002016: 115 buildings , average cost: $173,2002015: 61 buildings , average cost: $132,0002014: 11 buildings , average cost: $137,7002013: 18 buildings , average cost: $143,9002012: 8 buildings , average cost: $131,2002011: 11 buildings , average cost: $164,8002010: 14 buildings , average cost: $217,2002009: 19 buildings , average cost: $88,7002008: 31 buildings , average cost: $133,4002007: 45 buildings , average cost: $125,2002006: 81 buildings , average cost: $104,1002005: 81 buildings , average cost: $104,1002004: 72 buildings , average cost: $104,1002003: 67 buildings , average cost: $81,4002002: 61 buildings , average cost: $70,6002001: 41 buildings , average cost: $83,9002000: 29 buildings , average cost: $105,3001999: 30 buildings , average cost: $105,3001998: 47 buildings , average cost: $97,4001997: 33 buildings , average cost: $120,100Unemployment in December 2023:
Population change in the 1990s: +1,053 (+4.8%).
Most common occupations in Denison, TX (%)
Both Males Females
Other production occupations, including supervisors (5.1%)
Other sales and related occupations, including supervisors (4.8%)
Other office and administrative support workers, including supervisors (3.9%)
Metal workers and plastic workers (3.6%)
Retail sales workers, except cashiers (3.5%)
Electrical equipment mechanics and other installation, maintenance, and repair workers, including supervisors (3.2%)
Building and grounds cleaning and maintenance occupations (2.9%)
Other production occupations, including supervisors (7.5%)
Electrical equipment mechanics and other installation, maintenance, and repair workers, including supervisors (6.0%)
Metal workers and plastic workers (5.5%)
Driver/sales workers and truck drivers (4.6%)
Other sales and related occupations, including supervisors (4.3%)
Building and grounds cleaning and maintenance occupations (4.1%)
Vehicle and mobile equipment mechanics, installers, and repairers (3.4%)
Other office and administrative support workers, including supervisors (6.9%)
Other sales and related occupations, including supervisors (5.4%)
Registered nurses (5.0%)
Information and record clerks, except customer service representatives (4.7%)
Secretaries and administrative assistants (4.6%)
Nursing, psychiatric, and home health aides (4.3%)
Cashiers (4.2%)
Air pollution and air quality trends(lower is better)
AQI Ozone
Tornado activity:
Denison-area historical tornado activity is above Texas state average. It is 142% greater than the overall U.S. average.
On 4/2/1957, a category F4 (max. wind speeds 207-260 mph) tornado 14.5 miles away from the Denison city center killed 3 people and injured 3 people and caused between $50,000 and $500,000 in damages.
On 4/2/1957, a category F4 tornado 18.1 miles away from the city center killed 2 people and injured 6 people and caused between $500,000 and $5,000,000 in damages.
Earthquake activity:
Denison-area historical earthquake activity is significantly above Texas state average. It is 582% greater than the overall U.S. average. On 11/6/2011 at 03:53:10, a magnitude 5.7 (5.7 MW, Depth: 3.2 mi, Class: Moderate, Intensity: VI - VII) earthquake occurred 123.8 miles away from the city center On 9/3/2016 at 12:02:44, a magnitude 5.8 (5.8 MW, Depth: 3.5 mi) earthquake occurred 186.2 miles away from Denison center On 11/7/2016 at 01:44:24, a magnitude 5.0 (5.0 MW, Depth: 2.8 mi) earthquake occurred 155.6 miles away from Denison center On 11/8/2011 at 02:46:57, a magnitude 4.8 (4.8 MW, Depth: 3.1 mi, Class: Light, Intensity: IV - V) earthquake occurred 123.9 miles away from Denison center On 11/5/2011 at 07:12:45, a magnitude 4.8 (4.8 MW, Depth: 1.9 mi) earthquake occurred 125.1 miles away from Denison center On 9/6/1997 at 23:38:00, a magnitude 4.5 (4.5 LG, 4.2 LG, Depth: 3.1 mi) earthquake occurred 63.4 miles away from Denison center Magnitude types: regional Lg-wave magnitude (LG), moment magnitude (MW) Natural disasters: The number of natural disasters in Grayson County (15) is near the US average (15).Major Disasters (Presidential) Declared: 7Emergencies Declared: 7Floods: 5, Storms: 5, Hurricanes: 4, Tornadoes: 4, Fires: 3, Wind: 1, Winter Storm: 1, Other: 2 (Note: some incidents may be assigned to more than one category). Hospitals in Denison: ALTERNATE LIVING FACILITY I (1101 S MIRICK AVE) ALTERNATE LIVNG FACILITY I I I (1100 WEST WALKER) EDWARDS STREET HOUSE (603 EDWARDS ST) HYDE PARK HOUSE (1507 HYDE PARK AVE) LYNN STREET HOUSE (108 S LYNN ST) MHMR SVCS OF TEXOMA ALTERNATE LIVING FACILITY I I (1217 DESVOIGNES RD) MKT RAILROAD EMPLOYEES HOSP (1029 W WASHINGTON) ROYAL CREST HOSPICE (1105 MEMORIAL DRIVE SUITE 120) TEXOMA MEDICAL CENTER (Proprietary, 5016 S US HIGHWAY 75) TEXOMA MEDICAL CTR RESTORATIVE CARE (1000 MEMORIAL DR 4TH FLOOR POBOX 890)
College/University in Denison: Grayson College Full-time enrollment: 2,496; Location: 6101 Grayson Drive; Public; Website: www.grayson.edu)
Other colleges/universities with over 2000 students near Denison:
Southeastern Oklahoma State University (about 21 miles; Durant, OK ; Full-time enrollment: 3,365)
North Central Texas College (about 37 miles; Gainesville, TX ; FT enrollment: 6,550)
Collin County Community College District (about 41 miles; McKinney, TX ; FT enrollment: 18,044)
Texas Woman's University (about 49 miles; Denton, TX ; FT enrollment: 11,837)
University of North Texas (about 51 miles; Denton, TX ; FT enrollment: 31,694)
Texas A & M University-Commerce (about 52 miles; Commerce, TX ; FT enrollment: 8,890)
The University of Texas at Dallas (about 54 miles; Richardson, TX ; FT enrollment: 16,777)
Public high schools in Denison: DENISON H S Students: 1,310, Location: 4200 N STATE HWY 91, Grades: 9-12)PERRIN LEARNING CTR Students: 62, Location: 81 VANDENBURG, Grades: 9-12)COOKE/FANNIN/GRAYSON CO JUVENILE POST AJUD FAC Students: 49, Location: 86 DYESS, Grades: 5-11)PATHWAYS H S Students: 16, Location: 318 W MORGAN ST, Grades: 9-12)TRI CO JUVENILE DETENT Students: 8, Location: 9501 DYESS, Grades: 5-11)Public elementary/middle schools in Denison: B MCDANIEL INT Students: 1,026, Location: 400 LILLIS LN, Grades: 5-6)TERRELL EL Students: 477, Location: 230 W MARTIN LUTHER KING ST, Grades: PK-4)HYDE PARK EL Students: 268, Location: 1701 HYDE PARK, Grades: PK-4)MAYES EL Students: 252, Location: 201 JENNIE LN, Grades: PK-4)HOUSTON EL Location: 1100 W MORGAN ST, Grades: PK-4)
HENRY SCOTT MIDDLE Location: 1901 S MIRICK AVE, Grades: 7-8)
LAMAR EL Location: 1000 S FIFTH AVE, Grades: PK-4)
Private elementary/middle school in Denison: ST LUKE'S SCHOOL Students: 64, Location: 427 W WOODARD ST, Grades: PK-5)
See full list of schools located in Denison Library in Denison: DENISON PUBLIC LIBRARY Operating income: $660,562; Location: 300 W GANDY ST; 81,512 books ; 1,973 audio materials ; 3,081 video materials ; 50 state licensed databases ; 150 print serial subscriptions )
Notable locations in Denison: (A) , Ernst Martin Kohl Building (B) , George Braun House (C) , Denison Fire Department West Side Station (D) , Denison Fire Department South Side Station (E) , Denison Fire Department Central Station (F) , Red River Railroad Museum (G) , Clifton House Hotel (H) . Display/hide their locations on the map
Churches in Denison include: (A) , Bible Baptist Church (B) , Bethel Community Baptist Church (C) , Belmont Baptist Church (D) , Antioch Baptist Church (E) , First Baptist Church (F) , Faith Fellowship Baptist Church (G) , Epting Memorial Baptist Church (H) , Emmanuel Baptist Church (I) . Display/hide their locations on the map
Cemeteries: (1) , Oakwood Cemetery (2) . Display/hide their locations on the map
Reservoirs: (A) , Loy Lake (B) , Randell Lake (C) . Display/hide their locations on the map
Creek: (A) . Display/hide its location on the map
Parks in Denison include: (1) , Waterloo Park (2) , Jones Park (3) , Forest Park (4) , Loy Park (5) , Forest Park (6) , Munson Park (7) . Display/hide their locations on the map
Tourist attractions: (1) , Eisenhower Birthplace Historic Site (Cultural Attractions- Events- & Facilities; 609 South Lamar Avenue) (2) , Chamber of Commerce (313 West Woodard Street) (3) , Citizen's Travel Agency (115 North Rusk Avenue) (4) . Display/hide their approximate locations on the map
Hotels: (1) , Budget Inn (1621 South Austin Avenue) (2) . Display/hide their approximate locations on the map
Birthplace of: Chesley Sullenberger - Commercial airline pilot, Dwight D. Eisenhower - (1890-1969), WW2 General, President, Jim Hightower - (born 1943), radio host, author, Michael Sampson - Writer, Pete Spratt - Martial artist, Aaron Hunt - 2005 NFL player (Denver Broncos, born : Jun 19, 1980), Booker Ervin - Saxophonist, Mike Haynes (cornerback) - Football player, Aaron Hunt (gridiron football) - Player of and football, John Hillerman - actor.
Grayson County has a predicted average indoor radon screening level less than 2 pCi/L (pico curies per liter) - Low Potential Drinking water stations with addresses in Denison and their reported violations in the past:
TEXOMA MARINA AND RESORT (Population served: 210, Groundwater):
Past health violations:
MCL, Monthly (TCR) - In AUG-2014, Contaminant: Coliform. Follow-up actions: St Violation/Reminder Notice (AUG-11-2014), St Public Notif requested (AUG-11-2014)
MCL, Monthly (TCR) - In MAY-2013, Contaminant: Coliform. Follow-up actions: St Public Notif requested (JUN-10-2013), St Violation/Reminder Notice (JUN-10-2013), St Public Notif received (AUG-29-2013), St Compliance achieved (SEP-01-2013)
MCL, Monthly (TCR) - In APR-2007, Contaminant: Coliform. Follow-up actions: St Compliance achieved (APR-30-2007), St Public Notif requested (MAY-02-2007), St Violation/Reminder Notice (MAY-02-2007), St Public Notif received (JUN-01-2007)
Past monitoring violations:
Monitoring, Repeat Major (TCR) - In MAY-2013, Contaminant: Coliform (TCR). Follow-up actions: St Public Notif requested (JUL-11-2013), St Violation/Reminder Notice (JUL-11-2013), St Compliance achieved (AUG-27-2013), St Public Notif received (AUG-28-2013)
Monitoring, Source Water (GWR) - In MAY-01-2013, Contaminant: E. COLI. Follow-up actions: St Public Notif requested (AUG-01-2013), St Violation/Reminder Notice (AUG-01-2013), St AO (w/penalty) issued (AUG-03-2013), St Public Notif received (AUG-28-2013)
Monitoring, Source Water (GWR) - In APR-01-2013, Contaminant: E. COLI. Follow-up actions: St Public Notif requested (JUN-26-2013), St Violation/Reminder Notice (JUN-26-2013), St AO (w/penalty) issued (AUG-03-2013), St Public Notif received (AUG-28-2013)
Monitoring, Repeat Major (TCR) - In DEC-2012, Contaminant: Coliform (TCR). Follow-up actions: St Compliance achieved (FEB-01-2013), St Public Notif requested (FEB-08-2013), St Violation/Reminder Notice (FEB-08-2013), St Public Notif received (MAR-26-2013)
Monitoring, Source Water (GWR) - In DEC-01-2012, Contaminant: E. COLI. Follow-up actions: St Public Notif requested (FEB-25-2013), St Violation/Reminder Notice (FEB-25-2013), St Public Notif received (MAR-26-2013), St AO (w/penalty) issued (AUG-03-2013)
14 routine major monitoring violations
One minor monitoring violation
11 regular monitoring violations
3 other older monitoring violations
Drinking water stations with addresses in Denison that have no violations reported:
GRANDPAPPY POINT (Population served: 1,800, Primary Water Source Type: Groundwater)
Average household size: This city:
2.5 peopleTexas:
2.8 people
Percentage of family households: This city:
65.3%Whole state:
69.9%
Percentage of households with unmarried partners: This city:
6.6%Whole state:
6.0%
Likely homosexual households (counted as self-reported same-sex unmarried-partner households)
Lesbian couples: 0.3% of all households Gay men: 0.2% of all households
People in group quarters in Denison in 2010:
271 people in nursing facilities/skilled-nursing facilities
73 people in group homes intended for adults
29 people in emergency and transitional shelters (with sleeping facilities) for people experiencing homelessness
People in group quarters in Denison in 2000:
300 people in nursing homes
95 people in college dormitories (includes college quarters off campus)
69 people in other noninstitutional group quarters
17 people in homes for the mentally retarded
Banks with branches in Denison (2011 data):
Bank of America, National Association: Denison Branch at 300 West Main Street, branch established on 1883/10/04; Denison Motor Branch at 200 West Chesnut, branch established on 1992/06/30. Info updated 2009/11/18: Bank assets: $1,451,969.3 mil, Deposits: $1,077,176.8 mil, headquarters in Charlotte, NC, positive income , 5782 total offices , Holding Company: Bank Of America Corporation
Landmark Bank, National Association: Denison Tmc Branch at 2911 F.M. 691, branch established on 2011/03/24; Denison Branch at 2820 West Fm 120, branch established on 1890/11/10. Info updated 2011/09/28: Bank assets: $1,675.9 mil, Deposits: $1,490.4 mil, headquarters in Columbia, MO, positive income , Commercial Lending Specialization, 38 total offices , Holding Company: Landrum Company
JPMorgan Chase Bank, National Association: Drive-In Branch at 312 West Woodard, branch established on 1989/07/20; Denison Branch at 231 West Main Street, branch established on 1925/05/12. Info updated 2011/11/10: Bank assets: $1,811,678.0 mil, Deposits: $1,190,738.0 mil, headquarters in Columbus, OH, positive income , International Specialization, 5577 total offices , Holding Company: Jpmorgan Chase & Co.
American Bank of Texas: West Main Street Branch at 927-931 West Main Street, branch established on 1963/10/07; F.M. Road Branch at 3326 F.M. Road 120, branch established on 1998/06/05. Info updated 2006/11/03: Bank assets: $1,140.3 mil, Deposits: $954.9 mil, headquarters in Sherman, TX, positive income , Commercial Lending Specialization, 19 total offices , Holding Company: North American Bancshares, Inc.
Woodforest National Bank: Denison Wal-Mart Branch at 401 North Us Highway 75, branch established on 2001/06/11. Info updated 2011/05/10: Bank assets: $3,488.9 mil, Deposits: $3,097.6 mil, headquarters in Houston, TX, positive income , Commercial Lending Specialization, 766 total offices , Holding Company: Woodforest Financial Group Employee Stock Ownership Plan (With 401(K) Provisions)
Independent Bank: Denison Branch at 331 West Main Street, branch established on 1987/07/14. Info updated 2010/10/06: Bank assets: $1,237.6 mil, Deposits: $1,035.0 mil, headquarters in Mckinney, TX, positive income , Commercial Lending Specialization, 27 total offices , Holding Company: Independent Bank Group, Inc.
For population 15 years and over in Denison:
Never married: 24.9%Now married: 49.8%Separated: 3.5%Widowed: 8.2%Divorced: 13.6% For population 25 years and over in Denison:
High school or higher: 90.2%Bachelor's degree or higher: 17.9%Graduate or professional degree: 5.8%Unemployed: 5.8%Mean travel time to work (commute): 17.7 minutes
Education Gini index (Inequality in education) Here:
9.7Texas average:
14.0
Religion statistics for Denison, TX (based on Grayson County data)
Religion Adherents Congregations Evangelical Protestant 50,271 174 Mainline Protestant 9,066 33 Catholic 5,952 4 Other 3,844 7 Black Protestant 2,380 14 Orthodox 120 1 None 49,244 -
Source: Clifford Grammich, Kirk Hadaway, Richard Houseal, Dale E.Jones, Alexei Krindatch, Richie Stanley and Richard H.Taylor. 2012. 2010 U.S.Religion Census: Religious Congregations & Membership Study. Association of Statisticians of American Religious Bodies. Jones, Dale E., et al. 2002. Congregations and Membership in the United States 2000. Nashville, TN: Glenmary Research Center. Graphs represent county-level data
Food Environment Statistics: Number of grocery stores : 17Grayson County :
1.44 / 10,000 pop.Texas :
1.47 / 10,000 pop.
Number of supercenters and club stores : 3Grayson County :
0.25 / 10,000 pop.Texas :
0.14 / 10,000 pop.
Number of convenience stores (no gas) : 14Here :
1.19 / 10,000 pop.Texas :
1.11 / 10,000 pop.
Number of convenience stores (with gas) : 69Grayson County :
5.84 / 10,000 pop.State :
3.95 / 10,000 pop.
Number of full-service restaurants : 74Grayson County :
6.27 / 10,000 pop.Texas :
6.13 / 10,000 pop.
Adult diabetes rate : Grayson County :
9.3%Texas :
8.9%
Adult obesity rate : This county :
25.4%Texas :
26.6%
Low-income preschool obesity rate : Grayson County :
15.1%State :
15.7%
Health and Nutrition:
Average overall health of teeth and gums : People feeling badly about themselves : This city:
20.7%Texas:
20.6%
People not drinking alcohol at all : This city:
11.8%Texas:
10.3%
Average hours sleeping at night : Overweight people : This city:
35.1%State:
33.1%
General health condition : Average condition of hearing : More about Health and Nutrition of Denison, TX Residents
Local government employment and payroll (March 2022)
Function
Full-time employees
Monthly full-time payroll
Average yearly full-time wage
Part-time employees
Monthly part-time payroll
Firefighters
52 $363,070 $83,785 0 $0 Police Protection - Officers
47 $381,225 $97,334 0 $0 Water Supply
34 $123,548 $43,605 0 $0 Financial Administration
24 $127,180 $63,590 7 $358 Parks and Recreation
18 $64,609 $43,073 32 $18,141 Other and Unallocable
17 $61,032 $43,081 0 $0 Police - Other
16 $68,893 $51,670 0 $0 Solid Waste Management
14 $50,287 $43,103 2 $2,037 Sewerage
12 $48,507 $48,507 1 $2,046 Local Libraries
11 $37,924 $41,372 9 $6,609 Streets and Highways
10 $30,067 $36,080 0 $0 Housing and Community Development (Local)
9 $40,679 $54,239 0 $0 Other Government Administration
6 $30,314 $60,628 0 $0 Natural Resources
1 $2,727 $32,724 1 $188 Fire - Other
1 $3,387 $40,644 0 $0
Totals for Government
272 $1,433,449 $63,240 52 $29,379
Denison government finances - Expenditure in 2017 (per resident):
Construction - Water Utilities: $1,620,000 ($61.53)
Sewerage: $1,526,000 ($57.96)Police Protection: $439,000 ($16.67)Regular Highways: $275,000 ($10.45)Parks and Recreation: $46,000 ($1.75)Current Operations - Local Fire Protection: $5,819,000 ($221.02)
Police Protection: $5,250,000 ($199.41)Water Utilities: $3,557,000 ($135.10)Solid Waste Management: $2,788,000 ($105.89)Sewerage: $2,416,000 ($91.77)General - Other: $1,745,000 ($66.28)Parks and Recreation: $1,664,000 ($63.20)Regular Highways: $1,451,000 ($55.11)Libraries: $718,000 ($27.27)Central Staff Services: $680,000 ($25.83)Financial Administration: $484,000 ($18.38)Protective Inspection and Regulation - Other: $483,000 ($18.35)Miscellaneous Commercial Activities - Other: $315,000 ($11.96)Health - Other: $293,000 ($11.13)Housing and Community Development: $184,000 ($6.99)Judicial and Legal Services: $183,000 ($6.95)General Public Buildings: $181,000 ($6.87)General - Interest on Debt: $258,000 ($9.80)
Other Capital Outlay - Local Fire Protection: $463,000 ($17.59)
Central Staff Services: $423,000 ($16.07)Regular Highways: $123,000 ($4.67)Sewerage: $94,000 ($3.57)Police Protection: $21,000 ($0.80)Parks and Recreation: $19,000 ($0.72)Total Salaries and Wages: $18,152,000 ($689.46)
Water Utilities - Interest on Debt: $681,000 ($25.87)
Denison government finances - Revenue in 2017 (per resident):
Charges - Solid Waste Management: $5,004,000 ($190.06)
Sewerage: $3,917,000 ($148.78)Other: $1,747,000 ($66.36)Parks and Recreation: $380,000 ($14.43)Federal Intergovernmental - Housing and Community Development: $166,000 ($6.31)
Local Intergovernmental - Other: $100,000 ($3.80)
Miscellaneous - Rents: $463,000 ($17.59)
Fines and Forfeits: $459,000 ($17.43)General Revenue - Other: $312,000 ($11.85)Interest Earnings: $180,000 ($6.84)Revenue - Water Utilities: $6,583,000 ($250.04)
State Intergovernmental - General Local Government Support: $43,000 ($1.63)
Tax - Property: $7,604,000 ($288.82)
General Sales and Gross Receipts: $5,084,000 ($193.10)Public Utilities Sales: $1,566,000 ($59.48)Other Selective Sales: $410,000 ($15.57)Other License: $233,000 ($8.85)Occupation and Business License - Other: $30,000 ($1.14)Alcoholic Beverage License: $9,000 ($0.34)
Denison government finances - Debt in 2017 (per resident):
Long Term Debt - Outstanding Unspecified Public Purpose: $52,980,000 ($2012.31)
Beginning Outstanding - Unspecified Public Purpose: $46,122,000 ($1751.82)Issue, Unspecified Public Purpose: $10,630,000 ($403.75)Retired Unspecified Public Purpose: $3,771,000 ($143.23)
Denison government finances - Cash and Securities in 2017 (per resident):
Bond Funds - Cash and Securities: $10,761,000 ($408.73)
Other Funds - Cash and Securities: $15,012,000 ($570.19)
Sinking Funds - Cash and Securities: $615,000 ($23.36)
Businesses in Denison, TX
Name Count Name Count
AT&T 1 Jack In The Box 1 Albertsons 1 KFC 1 Arby's 1 Kroger 1 AutoZone 1 Lane Furniture 3 Best Western 1 Little Caesars Pizza 1 Burger King 1 McDonald's 1 CVS 1 Motel 6 1 Chevrolet 1 Nissan 1 Church's Chicken 1 Pizza Hut 2 Circle K 1 RadioShack 1 Domino's Pizza 1 SONIC Drive-In 2 FedEx 2 T-Mobile 1 Goodwill 1 Taco Bell 1 H&R Block 2 Toyota 1 Holiday Inn 1 U-Haul 3 Honda 1 UPS 3 IHOP 1 Walmart 1
Strongest AM radio stations in Denison:
KYNG (950 AM; 10 kW; DENISON-SHERMAN, TX; Owner: KRBE LICO, INC.)
KTBK (1700 AM; 10 kW; SHERMAN, TX; Owner: KRBE LICO, INC.)
KJIM (1500 AM; daytime; 1 kW; SHERMAN, TX)
KRLD (1080 AM; 50 kW; DALLAS, TX; Owner: TEXAS INFINITY BROADCASTING L.P.)
KFXR (1190 AM; 50 kW; DALLAS, TX; Owner: CLEAR CHANNEL BROADCASTING LICENSES, INC.)
WBAP (820 AM; 50 kW; FORT WORTH, TX; Owner: WBAP-KSCS OPERATING, LTD.)
KZMP (1540 AM; 50 kW; UNIVERSITY PARK, TX; Owner: ENTRAVISION HOLDINGS, LLC)
KESS (1270 AM; 50 kW; FORT WORTH, TX; Owner: KESS-AM LICENSE CORP.)
KMKI (620 AM; 5 kW; PLANO, TX; Owner: ABC, INC)
KSKY (660 AM; 20 kW; BALCH SPRINGS, TX; Owner: BISON MEDIA, INC.)
KBIS (1150 AM; 25 kW; HIGHLAND PARK, TX; Owner: DALLAS AM RADIO PARTNERS, L.P.)
KAHZ (1360 AM; 50 kW; HURST, TX)
KAAM (770 AM; 10 kW; GARLAND, TX; Owner: DONTRON, INC.)
Strongest FM radio stations in Denison:
KTDK (104.1 FM; SANGER, TX; Owner: KRBE LICO, INC.)
K214CK (90.7 FM; SHERMAN, TX; Owner: BIBLE B/CNG NETWORK, INC.)
KMKT (93.1 FM; BELLS, TX; Owner: NM LICENSING, LLC)
KLAK (97.5 FM; DURANT, OK; Owner: NM LICENSING, LLC)
KTCY (104.9 FM; PILOT POINT, TX; Owner: ENTRAVISION HOLDINGS, LLC)
KESN (103.3 FM; ALLEN, TX; Owner: WBAP-KSCS OPERATING, LTD.)
KSOC (94.5 FM; GAINESVILLE, TX; Owner: RADIO ONE LICENSES, LLC)
KTPW (89.7 FM; SANGER, TX; Owner: RESEARCH EDUCATIONAL FOUNDATION, INC)
KHYI (95.3 FM; HOWE, TX; Owner: METRO BROADCASTERS - TEXAS, INC.)
KLBC (106.3 FM; DURANT, OK; Owner: TEXOMA BROADCASTING, INC.)
KESS-FM (107.9 FM; LEWISVILLE, TX; Owner: KECS-FM LICENSE CORPORATION)
KFYZ-FM (98.3 FM; BONHAM, TX; Owner: NORTH TEXAS RADIO GROUP, L.P.)
KNOR (93.7 FM; HEALDTON, OK; Owner: AM & PM BROADCASTERS, LLC)
KMEO (96.7 FM; FLOWER MOUND, TX; Owner: ABC, INC.)
KKDL (106.7 FM; MUENSTER, TX; Owner: ENTRAVISION HOLDINGS, LLC)
KZMP-FM (101.7 FM; AZLE, TX; Owner: ENTRAVISION HOLDINGS, LLC)
KMAD-FM (102.5 FM; WHITESBORO, TX; Owner: NM LICENSING, LLC)
KAZC (88.3 FM; TISHOMINGO, OK; Owner: SOUTH CENTRAL OKLAHOMA CHRISTIAN BROADCASTING, INC.)
KSSU (91.9 FM; DURANT, OK; Owner: SOUTHEASTERN OKLAHOMA STATE UNIVERSITY)
K228CN (93.5 FM; SHERMAN, TX; Owner: J & J BROADCASTING)
TV broadcast stations around Denison:
KXII (Channel 12; SHERMAN, TX; Owner: KXII LICENSEE CORP.)
KTEN (Channel 10; ADA, OK; Owner: CHANNEL 49 ACQUISITION CORPORATION)
KTAQ (Channel 47; GREENVILLE, TX; Owner: MIKE SIMONS)
National Bridge Inventory (NBI) Statistics 107 Number of bridges2,064ft / 629m Total length $6,805,000 Total costs912,302 Total average daily traffic135,697 Total average daily truck traffic
New bridges - historical statistics
9 1930-1939 4 1950-1959 3 1960-1969 2 1970-1979 44 1980-1989 31 1990-1999 5 2000-2009 9 2010-2019
See full National Bridge Inventory statistics for Denison, TX
Home Mortgage Disclosure Act Aggregated Statistics For Year 2009(Based on 3 full and 3 partial tracts) A) FHA, FSA/RHS & VA B) Conventional C) Refinancings D) Home Improvement Loans F) Non-occupant Loans on G) Loans On Manufactured Number Average Value Number Average Value Number Average Value Number Average Value Number Average Value Number Average Value
LOANS ORIGINATED 77 $82,702 70 $75,258 94 $104,822 20 $33,980 45 $41,281 5 $62,868 APPLICATIONS APPROVED, NOT ACCEPTED 1 $87,290 6 $150,067 14 $94,618 3 $15,090 1 $20,000 1 $63,690 APPLICATIONS DENIED 9 $86,963 19 $56,217 51 $86,841 21 $39,789 12 $56,978 4 $67,420 APPLICATIONS WITHDRAWN 13 $84,428 4 $48,028 43 $100,033 4 $53,620 2 $74,195 0 $0 FILES CLOSED FOR INCOMPLETENESS 1 $89,000 4 $87,782 6 $81,382 1 $159,090 2 $48,760 1 $127,160
Aggregated Statistics For Year 2008(Based on 3 full and 3 partial tracts) A) FHA, FSA/RHS & VA B) Conventional C) Refinancings D) Home Improvement Loans E) Loans on Dwellings For 5+ Families F) Non-occupant Loans on G) Loans On Manufactured Number Average Value Number Average Value Number Average Value Number Average Value Number Average Value Number Average Value Number Average Value
LOANS ORIGINATED 95 $82,278 117 $74,358 89 $89,300 34 $31,545 2 $589,965 73 $46,357 1 $52,540 APPLICATIONS APPROVED, NOT ACCEPTED 2 $111,765 9 $93,119 14 $97,759 5 $42,480 0 $0 9 $80,492 1 $48,430 APPLICATIONS DENIED 13 $73,621 19 $51,865 95 $76,946 40 $30,302 1 $253,770 12 $50,028 5 $37,132 APPLICATIONS WITHDRAWN 22 $73,764 11 $101,135 39 $89,389 4 $35,150 0 $0 6 $45,263 0 $0 FILES CLOSED FOR INCOMPLETENESS 1 $133,000 4 $47,210 6 $87,707 0 $0 0 $0 0 $0 0 $0
Aggregated Statistics For Year 2007(Based on 3 full and 3 partial tracts) A) FHA, FSA/RHS & VA B) Conventional C) Refinancings D) Home Improvement Loans E) Loans on Dwellings For 5+ Families F) Non-occupant Loans on G) Loans On Manufactured Number Average Value Number Average Value Number Average Value Number Average Value Number Average Value Number Average Value Number Average Value
LOANS ORIGINATED 60 $76,864 191 $80,743 99 $72,008 40 $33,670 3 $487,920 76 $55,922 3 $88,033 APPLICATIONS APPROVED, NOT ACCEPTED 3 $54,143 27 $79,444 26 $95,140 5 $29,784 0 $0 9 $65,393 3 $47,360 APPLICATIONS DENIED 10 $72,503 46 $71,196 122 $71,405 61 $31,052 0 $0 28 $58,148 6 $43,775 APPLICATIONS WITHDRAWN 5 $54,100 16 $78,578 66 $84,551 8 $59,985 1 $674,310 9 $59,546 0 $0 FILES CLOSED FOR INCOMPLETENESS 0 $0 3 $61,953 10 $75,136 1 $20,290 0 $0 2 $47,780 0 $0
Aggregated Statistics For Year 2006(Based on 3 full and 3 partial tracts) A) FHA, FSA/RHS & VA B) Conventional C) Refinancings D) Home Improvement Loans E) Loans on Dwellings For 5+ Families F) Non-occupant Loans on G) Loans On Manufactured Number Average Value Number Average Value Number Average Value Number Average Value Number Average Value Number Average Value Number Average Value
LOANS ORIGINATED 58 $80,088 241 $70,681 144 $85,240 42 $30,465 1 $1,564,260 88 $53,514 5 $68,048 APPLICATIONS APPROVED, NOT ACCEPTED 1 $46,410 21 $57,688 21 $83,733 6 $46,258 1 $115,600 8 $44,278 5 $42,188 APPLICATIONS DENIED 3 $59,123 71 $72,880 122 $65,205 68 $32,353 0 $0 21 $55,408 9 $54,997 APPLICATIONS WITHDRAWN 8 $78,861 36 $92,012 106 $97,545 10 $59,324 0 $0 7 $117,777 3 $47,647 FILES CLOSED FOR INCOMPLETENESS 0 $0 2 $50,815 27 $85,630 0 $0 0 $0 3 $59,497 0 $0
Aggregated Statistics For Year 2005(Based on 3 full and 3 partial tracts) A) FHA, FSA/RHS & VA B) Conventional C) Refinancings D) Home Improvement Loans E) Loans on Dwellings For 5+ Families F) Non-occupant Loans on G) Loans On Manufactured Number Average Value Number Average Value Number Average Value Number Average Value Number Average Value Number Average Value Number Average Value
LOANS ORIGINATED 52 $74,882 225 $72,414 176 $81,412 38 $49,799 1 $55,100 69 $54,808 5 $46,072 APPLICATIONS APPROVED, NOT ACCEPTED 1 $128,870 23 $78,560 27 $70,846 10 $51,986 0 $0 8 $65,234 4 $49,422 APPLICATIONS DENIED 6 $58,377 88 $70,328 163 $63,491 62 $31,882 0 $0 34 $45,380 13 $51,399 APPLICATIONS WITHDRAWN 9 $58,070 28 $97,996 113 $90,766 18 $165,885 0 $0 11 $101,714 0 $0 FILES CLOSED FOR INCOMPLETENESS 1 $39,780 2 $63,270 48 $87,328 0 $0 0 $0 5 $85,858 0 $0
Aggregated Statistics For Year 2004(Based on 3 full and 3 partial tracts) A) FHA, FSA/RHS & VA B) Conventional C) Refinancings D) Home Improvement Loans E) Loans on Dwellings For 5+ Families F) Non-occupant Loans on G) Loans On Manufactured Number Average Value Number Average Value Number Average Value Number Average Value Number Average Value Number Average Value Number Average Value
LOANS ORIGINATED 43 $70,868 195 $70,171 198 $72,773 59 $35,253 2 $47,290 71 $46,392 3 $60,413 APPLICATIONS APPROVED, NOT ACCEPTED 4 $55,468 20 $64,784 36 $60,154 13 $22,702 0 $0 9 $44,569 8 $52,090 APPLICATIONS DENIED 7 $64,291 66 $54,740 207 $61,382 82 $33,214 1 $50,000 35 $49,809 29 $50,215 APPLICATIONS WITHDRAWN 3 $68,567 29 $84,128 110 $71,370 6 $23,867 0 $0 15 $58,341 1 $65,000 FILES CLOSED FOR INCOMPLETENESS 4 $52,360 7 $69,317 50 $94,498 3 $56,830 0 $0 1 $64,000 0 $0
Aggregated Statistics For Year 2003(Based on 3 full and 3 partial tracts) A) FHA, FSA/RHS & VA B) Conventional C) Refinancings D) Home Improvement Loans E) Loans on Dwellings For 5+ Families F) Non-occupant Loans on Number Average Value Number Average Value Number Average Value Number Average Value Number Average Value Number Average Value
LOANS ORIGINATED 44 $71,419 152 $63,664 342 $78,594 47 $28,977 1 $34,000 70 $85,417 APPLICATIONS APPROVED, NOT ACCEPTED 8 $87,806 12 $50,894 38 $60,482 11 $23,735 0 $0 7 $44,739 APPLICATIONS DENIED 5 $49,874 43 $58,709 187 $63,641 34 $21,358 0 $0 18 $33,062 APPLICATIONS WITHDRAWN 11 $55,696 32 $67,068 99 $66,511 3 $10,483 0 $0 8 $48,726 FILES CLOSED FOR INCOMPLETENESS 0 $0 6 $67,455 15 $73,837 4 $66,785 0 $0 0 $0
Aggregated Statistics For Year 2002(Based on 3 full and 3 partial tracts) A) FHA, FSA/RHS & VA B) Conventional C) Refinancings D) Home Improvement Loans E) Loans on Dwellings For 5+ Families F) Non-occupant Loans on Number Average Value Number Average Value Number Average Value Number Average Value Number Average Value Number Average Value
LOANS ORIGINATED 59 $66,655 119 $70,408 202 $65,742 39 $32,673 3 $179,933 59 $40,836 APPLICATIONS APPROVED, NOT ACCEPTED 5 $73,948 25 $72,160 24 $69,213 9 $15,869 0 $0 4 $27,940 APPLICATIONS DENIED 11 $67,255 51 $44,859 122 $52,001 25 $16,624 0 $0 22 $36,140 APPLICATIONS WITHDRAWN 4 $61,958 18 $64,412 83 $66,120 4 $20,712 0 $0 2 $18,500 FILES CLOSED FOR INCOMPLETENESS 1 $102,110 4 $34,265 20 $71,345 0 $0 0 $0 0 $0
Aggregated Statistics For Year 2001(Based on 3 full and 3 partial tracts) A) FHA, FSA/RHS & VA B) Conventional C) Refinancings D) Home Improvement Loans E) Loans on Dwellings For 5+ Families F) Non-occupant Loans on Number Average Value Number Average Value Number Average Value Number Average Value Number Average Value Number Average Value
LOANS ORIGINATED 49 $62,506 148 $68,046 168 $70,596 31 $18,552 1 $40,000 57 $39,378 APPLICATIONS APPROVED, NOT ACCEPTED 3 $86,283 35 $40,365 34 $41,161 7 $20,310 0 $0 6 $32,445 APPLICATIONS DENIED 1 $61,870 69 $46,355 90 $47,381 34 $13,825 0 $0 17 $37,520 APPLICATIONS WITHDRAWN 12 $58,283 26 $82,313 64 $58,944 2 $26,950 0 $0 2 $51,340 FILES CLOSED FOR INCOMPLETENESS 0 $0 7 $70,741 8 $81,655 1 $14,450 0 $0 4 $63,070
Aggregated Statistics For Year 2000(Based on 3 full and 3 partial tracts) A) FHA, FSA/RHS & VA B) Conventional C) Refinancings D) Home Improvement Loans E) Loans on Dwellings For 5+ Families F) Non-occupant Loans on Number Average Value Number Average Value Number Average Value Number Average Value Number Average Value Number Average Value
LOANS ORIGINATED 59 $60,325 157 $54,989 90 $53,708 45 $21,378 1 $2,542,730 58 $48,024 APPLICATIONS APPROVED, NOT ACCEPTED 13 $51,505 34 $45,161 31 $40,898 19 $17,572 0 $0 8 $22,386 APPLICATIONS DENIED 13 $57,606 118 $47,788 46 $35,769 35 $12,352 0 $0 15 $31,524 APPLICATIONS WITHDRAWN 5 $62,546 21 $49,928 39 $48,038 7 $37,529 0 $0 7 $27,413 FILES CLOSED FOR INCOMPLETENESS 0 $0 4 $92,980 12 $55,580 0 $0 0 $0 2 $64,055
Aggregated Statistics For Year 1999(Based on 3 full and 3 partial tracts) A) FHA, FSA/RHS & VA B) Conventional C) Refinancings D) Home Improvement Loans F) Non-occupant Loans on Number Average Value Number Average Value Number Average Value Number Average Value Number Average Value
LOANS ORIGINATED 48 $56,751 141 $65,257 144 $57,599 51 $20,351 36 $36,932 APPLICATIONS APPROVED, NOT ACCEPTED 1 $18,000 49 $49,464 25 $55,510 12 $15,081 4 $28,885 APPLICATIONS DENIED 5 $64,486 136 $54,442 68 $42,081 44 $17,017 14 $45,270 APPLICATIONS WITHDRAWN 5 $72,464 32 $63,517 52 $42,341 5 $43,610 5 $24,432 FILES CLOSED FOR INCOMPLETENESS 0 $0 7 $51,127 26 $63,722 0 $0 1 $16,270
Detailed HMDA statistics for the following Tracts:
0004.00
, 0005.01 , 0005.02 , 0007.00 , 0008.00 , 0009.01
Private Mortgage Insurance Companies Aggregated Statistics For Year 2009(Based on 1 full and 3 partial tracts) A) Conventional B) Refinancings Number Average Value Number Average Value
LOANS ORIGINATED 8 $108,415 0 $0 APPLICATIONS APPROVED, NOT ACCEPTED 0 $0 0 $0 APPLICATIONS DENIED 0 $0 1 $175,320 APPLICATIONS WITHDRAWN 0 $0 0 $0 FILES CLOSED FOR INCOMPLETENESS 0 $0 0 $0
Aggregated Statistics For Year 2008(Based on 3 full and 3 partial tracts) A) Conventional B) Refinancings C) Non-occupant Loans on Number Average Value Number Average Value Number Average Value
LOANS ORIGINATED 30 $85,369 4 $125,285 8 $60,074 APPLICATIONS APPROVED, NOT ACCEPTED 8 $91,585 2 $137,965 1 $40,070 APPLICATIONS DENIED 0 $0 0 $0 0 $0 APPLICATIONS WITHDRAWN 0 $0 0 $0 0 $0 FILES CLOSED FOR INCOMPLETENESS 0 $0 0 $0 0 $0
Aggregated Statistics For Year 2007(Based on 3 full and 3 partial tracts) A) Conventional B) Refinancings C) Non-occupant Loans on Number Average Value Number Average Value Number Average Value
LOANS ORIGINATED 56 $85,389 6 $102,860 8 $69,899 APPLICATIONS APPROVED, NOT ACCEPTED 3 $113,403 3 $101,540 0 $0 APPLICATIONS DENIED 0 $0 0 $0 0 $0 APPLICATIONS WITHDRAWN 3 $90,767 0 $0 1 $65,500 FILES CLOSED FOR INCOMPLETENESS 0 $0 0 $0 0 $0
Aggregated Statistics For Year 2006(Based on 3 full and 3 partial tracts) A) Conventional B) Refinancings C) Non-occupant Loans on Number Average Value Number Average Value Number Average Value
LOANS ORIGINATED 37 $85,137 4 $225,508 7 $36,770 APPLICATIONS APPROVED, NOT ACCEPTED 6 $45,233 0 $0 3 $35,713 APPLICATIONS DENIED 1 $42,570 0 $0 1 $42,570 APPLICATIONS WITHDRAWN 1 $116,000 0 $0 0 $0 FILES CLOSED FOR INCOMPLETENESS 0 $0 0 $0 0 $0
Aggregated Statistics For Year 2005(Based on 3 full and 3 partial tracts) A) Conventional B) Refinancings C) Non-occupant Loans on Number Average Value Number Average Value Number Average Value
LOANS ORIGINATED 50 $78,110 8 $130,845 8 $49,328 APPLICATIONS APPROVED, NOT ACCEPTED 7 $55,970 3 $82,910 2 $68,050 APPLICATIONS DENIED 0 $0 0 $0 0 $0 APPLICATIONS WITHDRAWN 4 $73,905 0 $0 1 $37,570 FILES CLOSED FOR INCOMPLETENESS 1 $120,410 0 $0 0 $0
Aggregated Statistics For Year 2004(Based on 3 full and 3 partial tracts) A) Conventional B) Refinancings C) Non-occupant Loans on Number Average Value Number Average Value Number Average Value
LOANS ORIGINATED 64 $85,945 5 $127,058 9 $54,312 APPLICATIONS APPROVED, NOT ACCEPTED 5 $60,354 0 $0 1 $41,420 APPLICATIONS DENIED 0 $0 0 $0 0 $0 APPLICATIONS WITHDRAWN 4 $59,032 2 $167,615 0 $0 FILES CLOSED FOR INCOMPLETENESS 1 $53,000 0 $0 0 $0
Aggregated Statistics For Year 2003(Based on 3 full and 3 partial tracts) A) Conventional B) Refinancings C) Non-occupant Loans on Number Average Value Number Average Value Number Average Value
LOANS ORIGINATED 48 $74,684 34 $94,164 9 $55,673 APPLICATIONS APPROVED, NOT ACCEPTED 4 $63,800 0 $0 2 $39,155 APPLICATIONS DENIED 2 $50,090 0 $0 1 $26,180 APPLICATIONS WITHDRAWN 3 $55,823 3 $105,660 1 $24,870 FILES CLOSED FOR INCOMPLETENESS 0 $0 0 $0 0 $0
Aggregated Statistics For Year 2002(Based on 3 full and 3 partial tracts) A) Conventional B) Refinancings C) Non-occupant Loans on Number Average Value Number Average Value Number Average Value
LOANS ORIGINATED 38 $83,049 19 $112,481 9 $63,688 APPLICATIONS APPROVED, NOT ACCEPTED 4 $60,232 3 $117,933 0 $0 APPLICATIONS DENIED 0 $0 0 $0 0 $0 APPLICATIONS WITHDRAWN 0 $0 0 $0 0 $0 FILES CLOSED FOR INCOMPLETENESS 0 $0 0 $0 0 $0
Aggregated Statistics For Year 2001(Based on 3 full and 3 partial tracts) A) Conventional B) Refinancings C) Non-occupant Loans on Number Average Value Number Average Value Number Average Value
LOANS ORIGINATED 43 $85,695 15 $98,927 2 $65,940 APPLICATIONS APPROVED, NOT ACCEPTED 2 $161,335 2 $113,475 0 $0 APPLICATIONS DENIED 1 $36,000 0 $0 0 $0 APPLICATIONS WITHDRAWN 0 $0 0 $0 0 $0 FILES CLOSED FOR INCOMPLETENESS 3 $58,250 0 $0 0 $0
Aggregated Statistics For Year 2000(Based on 3 full and 3 partial tracts) A) Conventional B) Refinancings C) Non-occupant Loans on Number Average Value Number Average Value Number Average Value
LOANS ORIGINATED 41 $68,863 8 $81,596 3 $30,017 APPLICATIONS APPROVED, NOT ACCEPTED 3 $30,903 2 $128,800 2 $24,680 APPLICATIONS DENIED 1 $58,910 1 $234,080 0 $0 APPLICATIONS WITHDRAWN 0 $0 0 $0 0 $0 FILES CLOSED FOR INCOMPLETENESS 0 $0 0 $0 0 $0
Aggregated Statistics For Year 1999(Based on 3 full and 3 partial tracts) A) Conventional B) Refinancings C) Non-occupant Loans on Number Average Value Number Average Value Number Average Value
LOANS ORIGINATED 46 $80,791 11 $118,493 2 $46,035 APPLICATIONS APPROVED, NOT ACCEPTED 1 $205,850 2 $162,120 0 $0 APPLICATIONS DENIED 2 $28,915 0 $0 0 $0 APPLICATIONS WITHDRAWN 1 $77,940 1 $92,370 0 $0 FILES CLOSED FOR INCOMPLETENESS 3 $72,870 0 $0 0 $0
Detailed PMIC statistics for the following Tracts:
0004.00
, 0005.01 , 0005.02 , 0007.00 , 0008.00 , 0009.01 Fire-safe hotels and motels in Denison, Texas:
Comfort Inn & Suites, 801 Hwy 75 N, Denison, Texas 75020 Phone: (903) 464-0340, Fax: (903) 464-0438
Holiday Inn Express, 715 N Pt Lookout Dr, Denison, Texas 75020 Phone: (903) 463-2500, Fax: (903) 463-2501
Best Western Texoma Hotel & Suites, 810 N Us Hwy 75, Denison, Texas 75020 Phone: (909) 327-8883, Fax: (903) 327-8185
Hampton Inn & Suites, 3415 Ansley Rd, Denison, Texas 75020 Phone: (903) 464-9010, Fax: (903) 464-9035
Hilton Garden Inn Denison/Sherman/At Texoma Event Center, 5015 S US Hwy 75, Denison, Texas 75020 Phone: (903) 463-3331, Fax: (903) 463-3341
All 5 fire-safe hotels and motels in Denison, Texas
Most common first names in Denison, TX among deceased individuals Name Count Lived (average)
James 275 71.5 years Mary 265 78.3 years John 252 74.4 years William 240 75.0 years Robert 178 71.4 years Charles 142 69.6 years George 109 76.2 years Willie 93 77.5 years Helen 83 77.3 years Walter 80 75.1 years
Most common last names in Denison, TX among deceased individuals Last name Count Lived (average)
Smith 136 75.2 years Jones 117 78.5 years Williams 93 79.2 years Brown 85 75.2 years Johnson 76 76.0 years Davis 69 76.2 years Anderson 66 73.1 years Taylor 65 76.4 years Wilson 63 76.5 years Moore 63 77.1 years
Denison compared to Texas state average:
Median house value below state average. Unemployed percentage below state average. Hispanic race population percentage significantly below state average. Median age significantly above state average. Foreign-born population percentage significantly below state average. Length of stay since moving in significantly above state average. House age above state average. Number of college students below state average.
#20 on the list of "Top 101 cities with the largest percentage of people in dormitories (population 1,000+)"
#20 on the list of "Top 101 cities with the largest percentage of people in group homes (population 1,000+)"
#20 on the list of "Top 101 cities with the largest percentage of people in hospitals/wards, hospices, and schools for the handicapped (population 1,000+)"
#20 on the list of "Top 101 cities with the largest percentage of people in long-term care (population 1,000+)"
#20 on the list of "Top 101 cities with the largest percentage of people in military quarters (population 1,000+)"
#20 on the list of "Top 101 cities with the largest percentage of people in noninstitutionalized settings (population 1,000+)"
#20 on the list of "Top 101 cities with the largest percentage of people in on base quarters (population 1,000+)"
#20 on the list of "Top 101 cities with the largest percentage of people in schools, hospitals, or wards for the physically handicapped (population 1,000+)"
#27 on the list of "Top 101 cities with the largest percentage of people in wards in military hospitals for patients who have no usual home elsewhere (population 1,000+)"
#35 on the list of "Top 101 cities with the largest percentage of people in military disciplinary barracks (population 1,000+)"
#37 on the list of "Top 101 cities with the largest percentage of people in military hospitals or wards for chronically ill (population 1,000+)"
#42 on the list of "Top 101 cities with the most local government spending on current operations of parking facilities per resident (population 10,000+)"
#55 on the list of "Top 101 counties with highest percentage of residents voting for Romney (Republican) in the 2012 Presidential Election (pop. 50,000+)"
#92 on the list of "Top 101 counties with the lowest percentage of residents relocating from foreign countries between 2010 and 2011 (pop. 50,000+)"
Top Patent Applicants
Rex Warren Pirkle (4)
Michael U. Bencheck (4)
Rex W. Pirkle (3)
Clint A. Hayes (2)
David Hall (2)
Lynn S. James-Meyer (2)
Peggy R. Hall (2)
Russell R. Hein (2)
Bobby Glen Brown (2)
Kyle Garner Timm (1)
Total of 38 patent applications in 2008-2024.


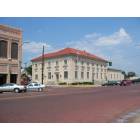
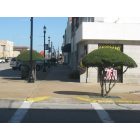

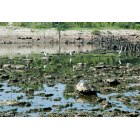
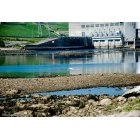
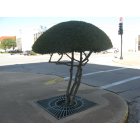
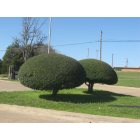
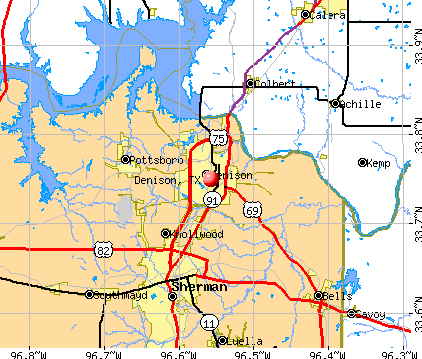


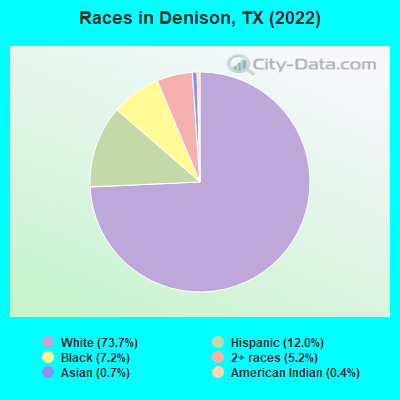
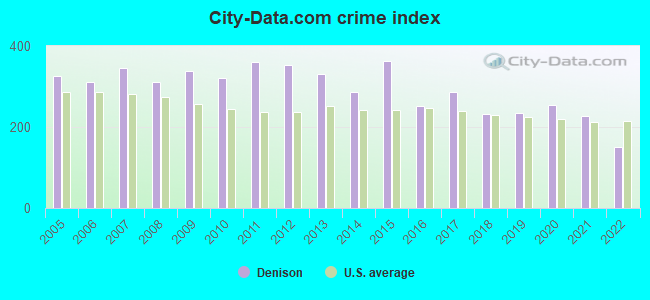
 Recent articles from our blog. Our writers, many of them Ph.D. graduates or candidates, create easy-to-read articles on a wide variety of topics.

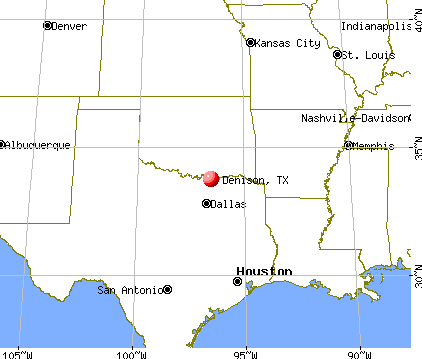
 , pop. 81,381).
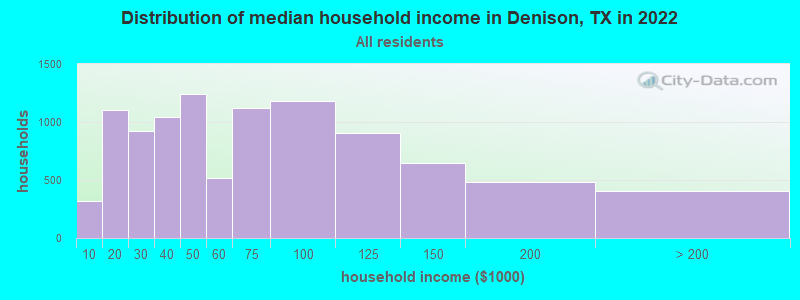
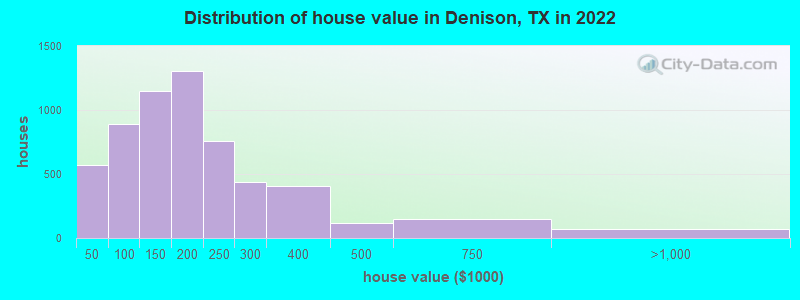
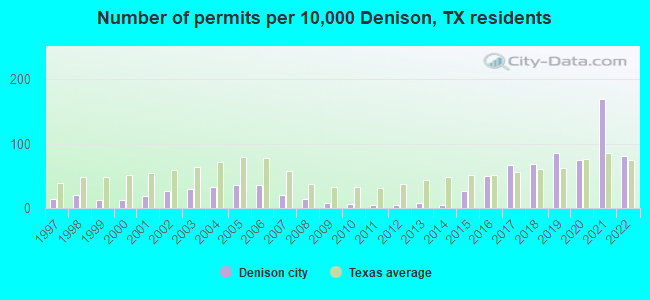
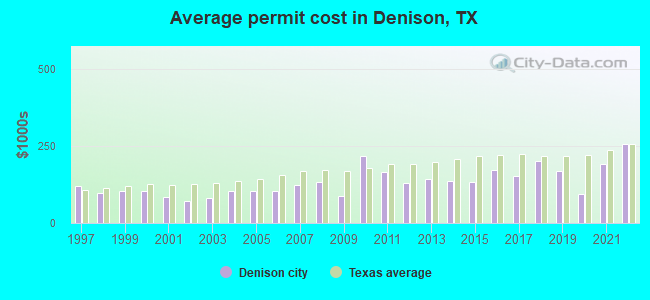
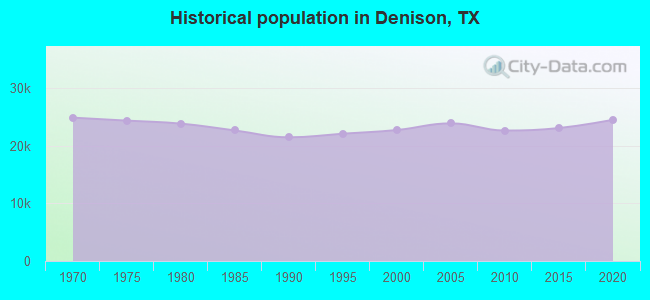
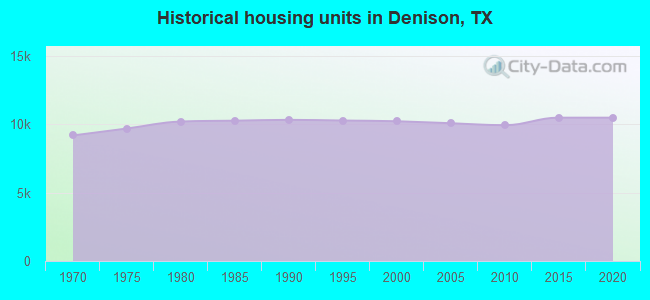
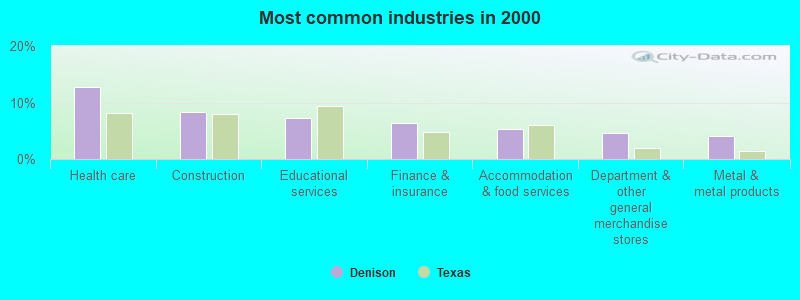
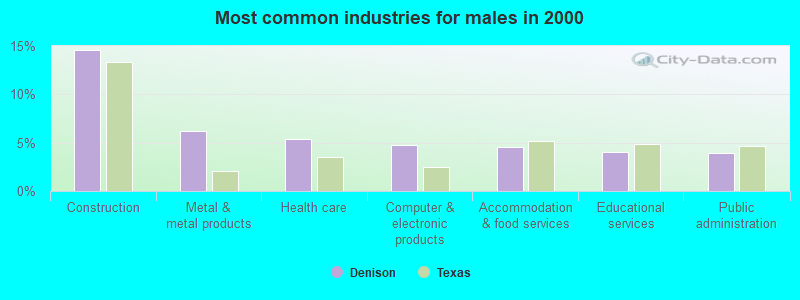
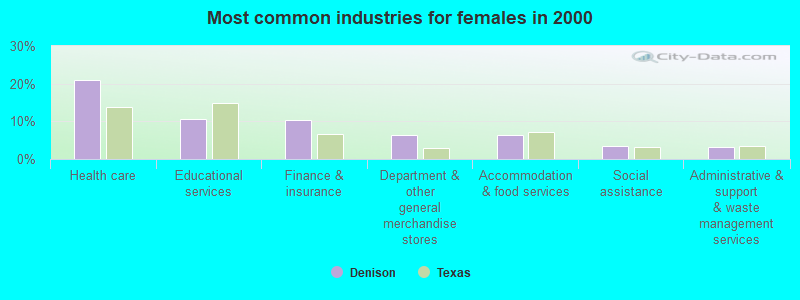
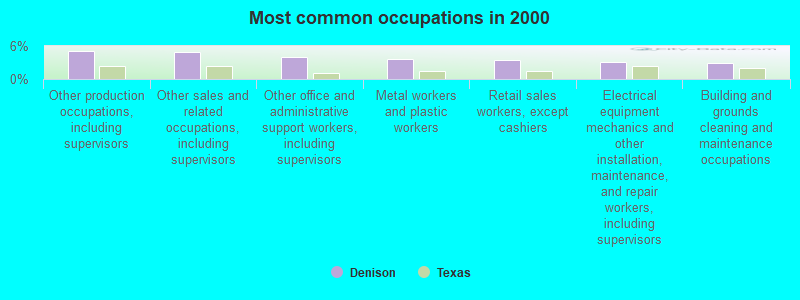
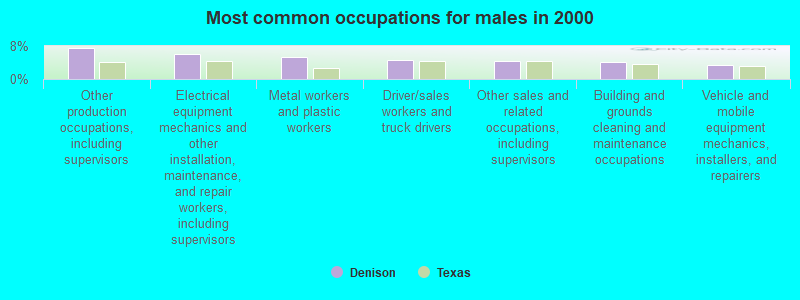
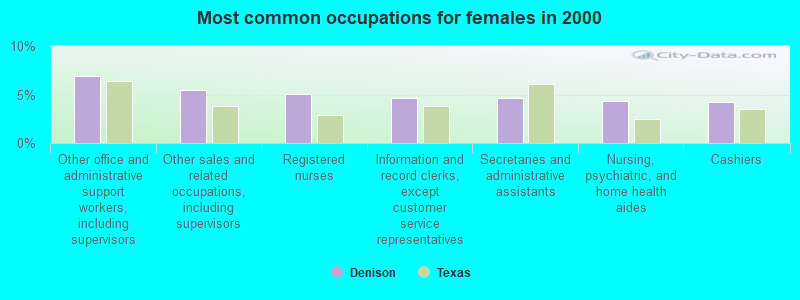
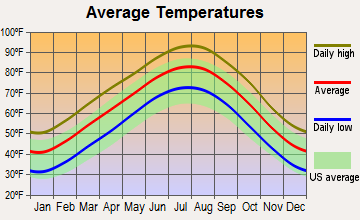
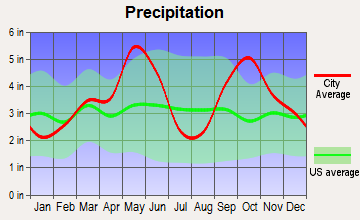
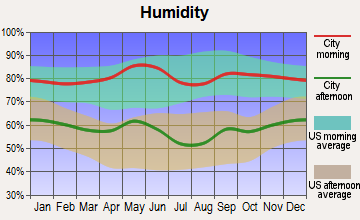
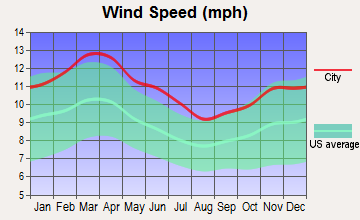
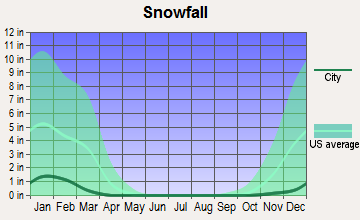
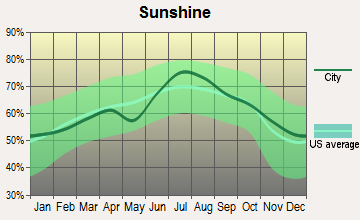
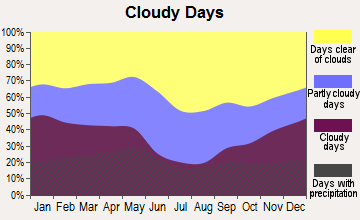
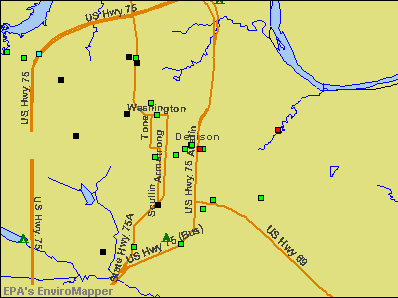

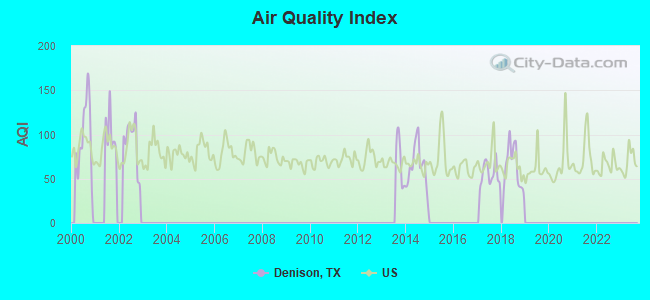
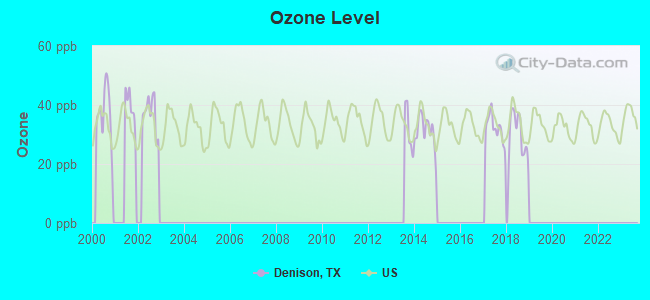

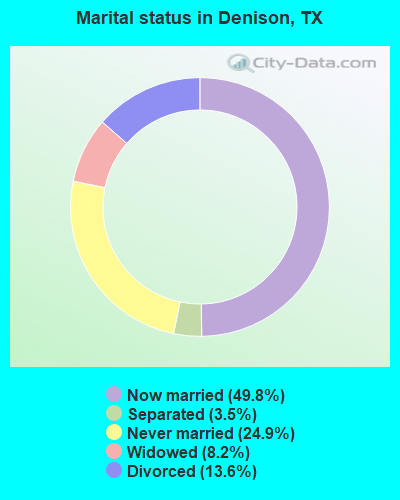
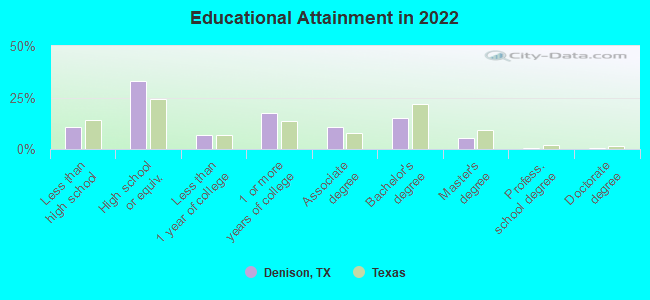
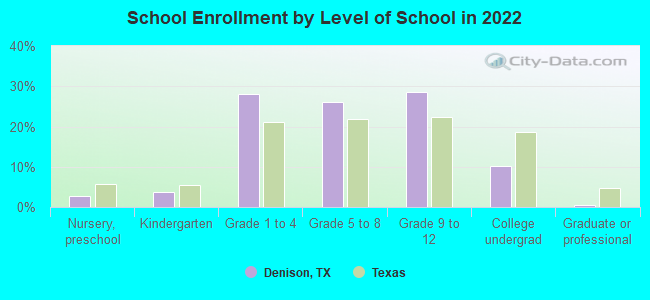
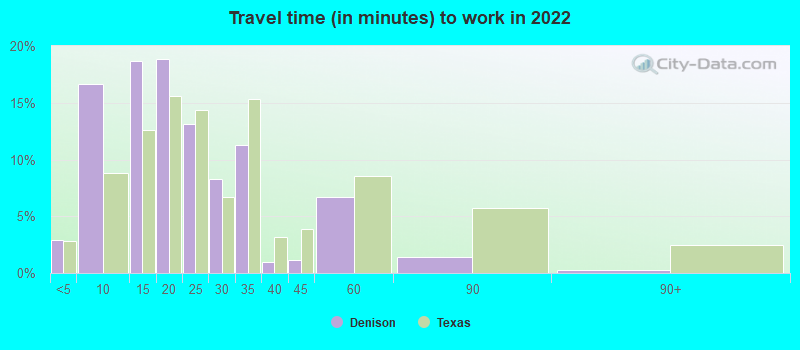
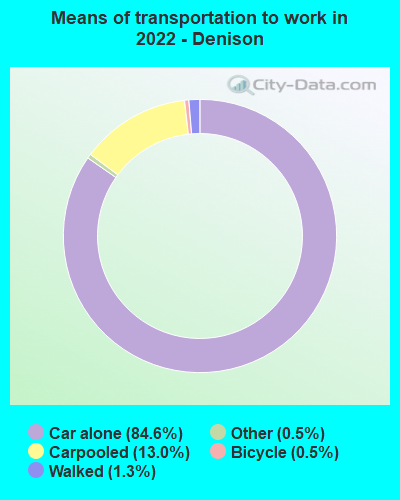
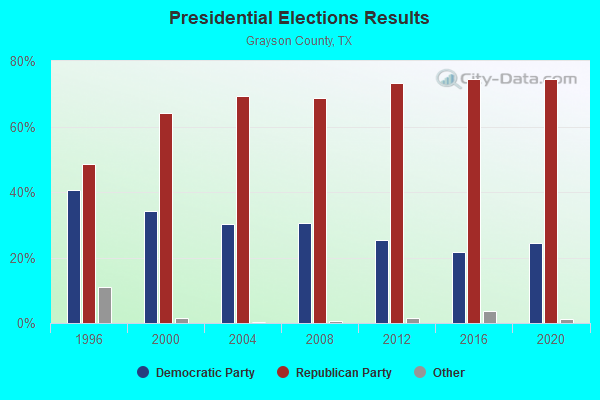
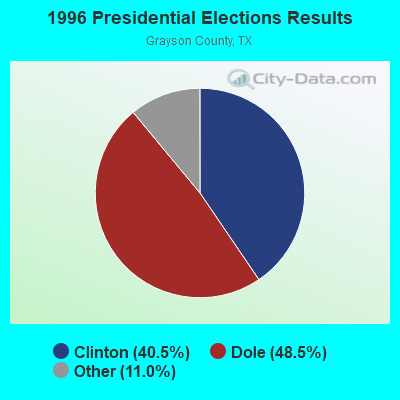
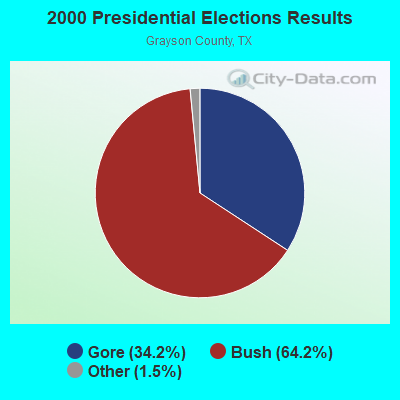
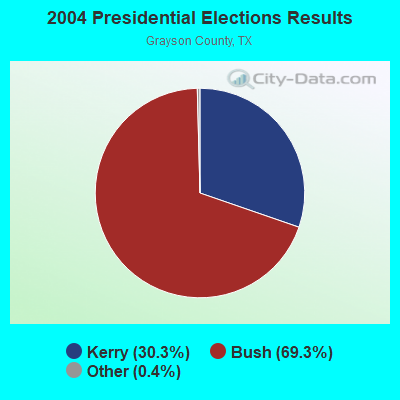
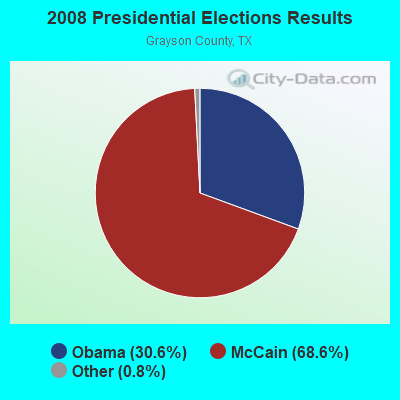
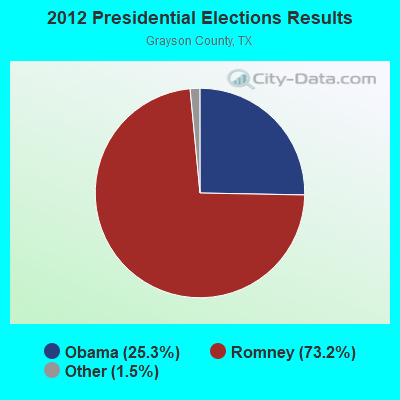
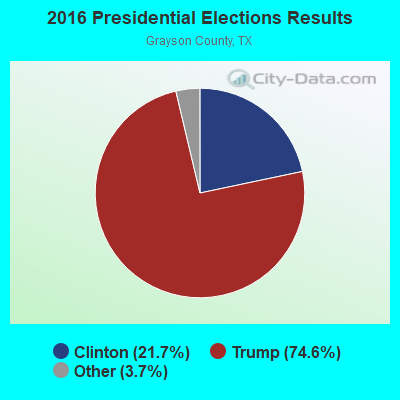
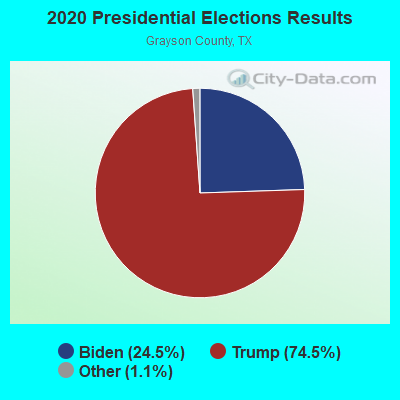
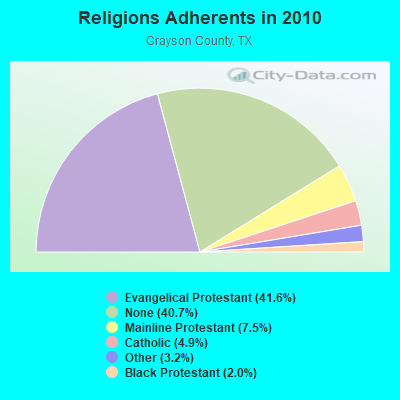
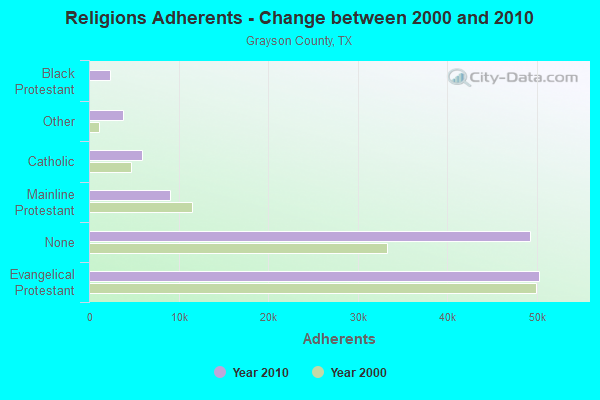
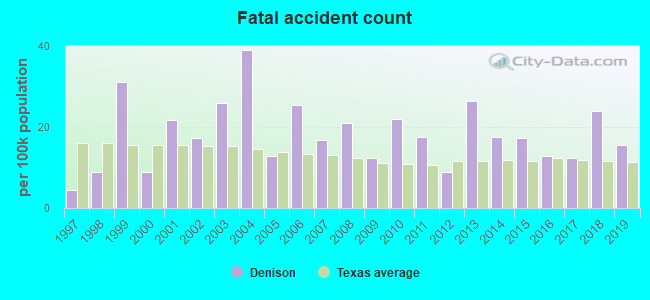
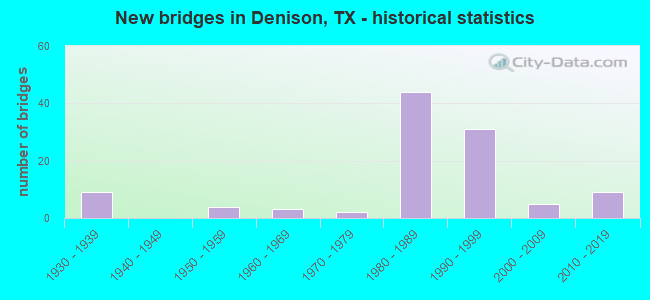
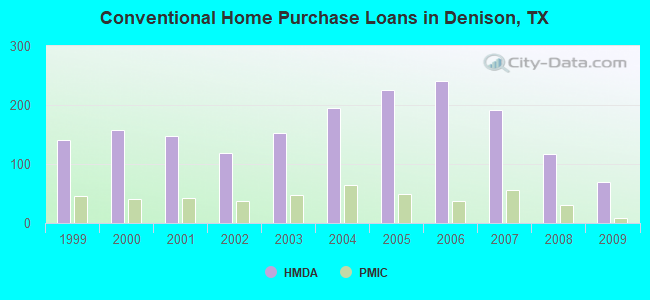
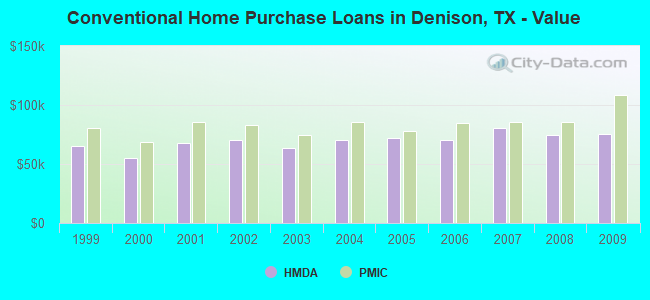
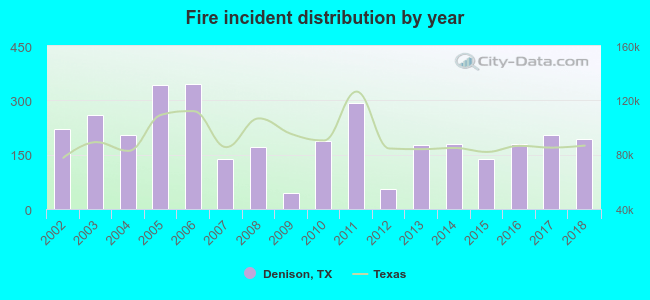 According to the data from the years 2002 - 2018 the average number of fires per year is 196. The highest number of fires - 345 took place in 2006, and the least - 43 in 2009. The data has a declining trend.
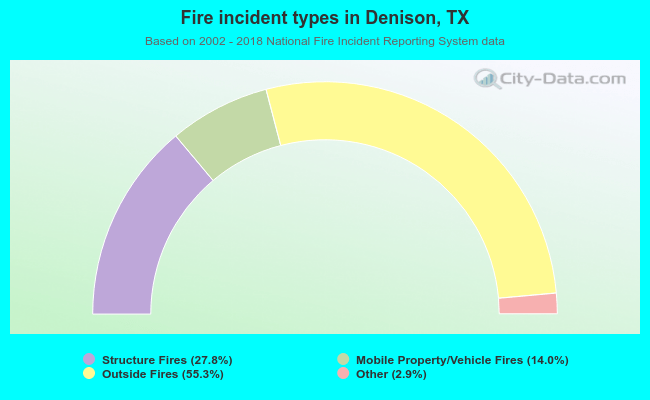 When looking into fire subcategories, the most reports belonged to: Outside Fires (55.3%), and Structure Fires (27.8%).