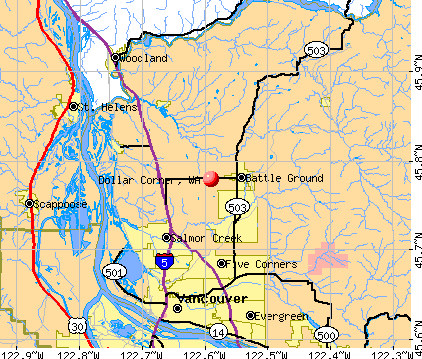
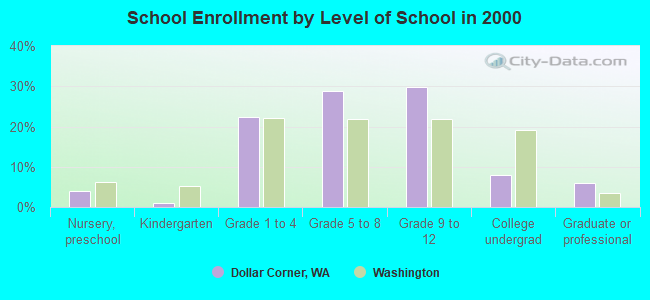
Dollar Corner, Washington
Submit your own pictures of this place and show them to the world
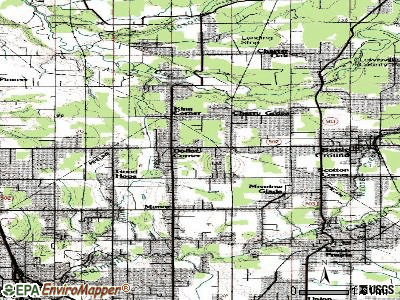
- OSM Map
- General Map
- Google Map
- MSN Map
Population change since 2000: +6.6%
| Males: 572 | |
| Females: 536 |
| Median resident age: | 41.4 years |
| Washington median age: | 32.2 years |
Zip codes: 98642.
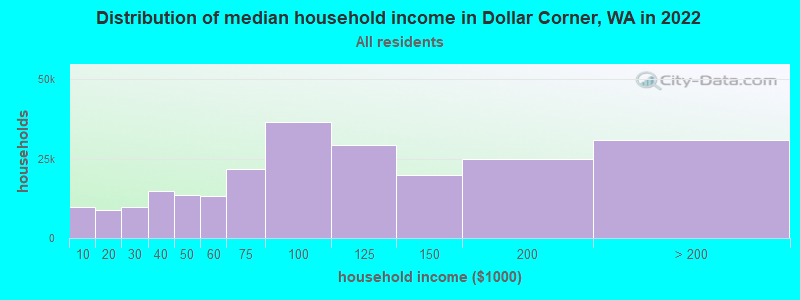
| Dollar Corner: | $107,279 |
| WA: | $91,306 |
Estimated per capita income in 2022: $45,994 (it was $21,025 in 2000)
Dollar Corner CDP income, earnings, and wages data
Estimated median house or condo value in 2022: $654,807 (it was $188,300 in 2000)
| Dollar Corner: | $654,807 |
| WA: | $569,500 |
Mean prices in 2022: all housing units: $600,868; detached houses: $640,286; townhouses or other attached units: $387,806; in 2-unit structures: $276,060; in 3-to-4-unit structures: $256,213; in 5-or-more-unit structures: $443,986; mobile homes: $253,186; occupied boats, rvs, vans, etc.: $34,609
Detailed information about poverty and poor residents in Dollar Corner, WA
Compare current foreclosures near Dollar Corner, WA:
| Photo | Address | Area | Beds / Baths | Price | Details |
|---|---|---|---|---|---|

|
#1
NE Wygant St
Portland, OR 97218
|
1,177 sq. feet
|
2 baths 2 beds |
$218,400
|
show details |

|
#2
North East Brazee St
Portland, OR 97220
|
1,578 sq. feet
|
2 baths 3 beds |
$350,000
|
show details |

|
#3
N Rosa Parks Way # 201
Portland, OR 97217
|
561 sq. feet
|
1 baths 2 beds |
show details | |

|
#4
NE 34th Ave Apt 4b
Vancouver, WA 98665
|
1,186 sq. feet
|
3 baths 2 beds |
show details | |

|
#5
Rossiter Ln
Vancouver, WA 98661
|
1,519 sq. feet
|
3 baths 2 beds |
show details | |

|
#6
W 15th Ave
La Center, WA 98629
|
1,688 sq. feet
|
2 baths 3 beds |
show details | |

|
#7
NE 22nd Ct
Vancouver, WA 98665
|
3,073 sq. feet
|
4 baths 5 beds |
show details | |

|
#8
NE 16th St
Vancouver, WA 98664
|
- sq. feet
|
2 baths 3 beds |
show details | |

|
#9
N Curtis Ave
Portland, OR 97217
|
1,643 sq. feet
|
2 baths 3 beds |
show details | |

|
#10
NE 27th Ave
Portland, OR 97211
|
1,190 sq. feet
|
1 baths 4 beds |
show details |
| Photo | Address | Area | Beds / Baths | Price | Details |
|---|---|---|---|---|---|

|
#11
NE 23rd Ave
Vancouver, WA 98663
|
1,280 sq. feet
|
1 baths 3 beds |
show details | |

|
#12
E 24th St
Vancouver, WA 98661
|
720 sq. feet
|
1 baths 2 beds |
show details | |

|
#13
Carlson Rd
Vancouver, WA 98661
|
1,032 sq. feet
|
1 baths 3 beds |
show details | |

|
#14
NE 162nd Ave
Portland, OR 97230
|
1,073 sq. feet
|
2 baths 3 beds |
show details | |

|
#15
NE 13th Ave
Vancouver, WA 98685
|
1,344 sq. feet
|
2 baths 3 beds |
show details | |

|
#16
NE 32nd St
Vancouver, WA 98682
|
1,094 sq. feet
|
2 baths 3 beds |
show details | |

|
#17
NE Klickitat St
Portland, OR 97230
|
1,693 sq. feet
|
1 baths 3 beds |
show details | |

|
#18
NE Mallory Ave
Portland, OR 97211
|
2,118 sq. feet
|
2 baths 5 beds |
show details | |

|
#19
NE 96th Ave
Vancouver, WA 98662
|
1,270 sq. feet
|
2 baths 3 beds |
show details | |

|
#20
NE 111th St
Vancouver, WA 98686
|
2,015 sq. feet
|
2 baths 4 beds |
show details |
| Photo | Address | Area | Beds / Baths | Price | Details |
|---|---|---|---|---|---|

|
#21
E Wilson St
Yacolt, WA 98675
|
1,520 sq. feet
|
2 baths 3 beds |
show details | |

|
#22
NE 85th Cir
Vancouver, WA 98662
|
1,635 sq. feet
|
1 baths 3 beds |
show details | |

|
#23
NE 97th St
Vancouver, WA 98682
|
1,432 sq. feet
|
1 baths 3 beds |
show details | |

|
#24
Cimerron St
Woodland, WA 98674
|
- sq. feet
|
2 baths 3 beds |
show details | |

|
#25
Fisher Ln
Saint Helens, OR 97051
|
2,350 sq. feet
|
3 baths 4 beds |
show details | |

|
#26
NE Sitka Dr
Camas, WA 98607
|
2,312 sq. feet
|
2 baths 4 beds |
show details | |

|
#27
Insel Rd
Woodland, WA 98674
|
1,056 sq. feet
|
2 baths 3 beds |
show details | |

|
#28
NE 109th St
Vancouver, WA 98686
|
1,432 sq. feet
|
2 baths 3 beds |
show details | |

|
#29
N 10th St
Saint Helens, OR 97051
|
1,223 sq. feet
|
2 baths 3 beds |
show details | |

|
#30
Norris Rd
Vancouver, WA 98661
|
1,116 sq. feet
|
1 baths 3 beds |
show details |
| Photo | Address | Area | Beds / Baths | Price | Details |
|---|---|---|---|---|---|

|
#31
NE 81st Ave
Portland, OR 97218
|
1,720 sq. feet
|
1 baths 2 beds |
show details | |

|
#32
NE 69th St
Vancouver, WA 98662
|
960 sq. feet
|
1 baths 3 beds |
show details | |

|
#33
O St
Vancouver, WA 98663
|
784 sq. feet
|
1 baths 1 beds |
show details | |

|
#34
NE Morrow Rd
Vancouver, WA 98682
|
1,808 sq. feet
|
2 baths 5 beds |
show details | |

|
#35
NE 135th Ave
Vancouver, WA 98682
|
2,036 sq. feet
|
2 baths 4 beds |
show details | |

|
#36
NW 10th St
Battle Ground, WA 98604
|
1,410 sq. feet
|
2 baths 3 beds |
show details | |

|
#37
NE 72nd Ave
Vancouver, WA 98686
|
2,347 sq. feet
|
1 baths 3 beds |
show details | |

|
#38
NE 85th Cir
Vancouver, WA 98665
|
2,155 sq. feet
|
3 baths 3 beds |
show details | |

|
#39
NE Holman St
Portland, OR 97218
|
1,272 sq. feet
|
2 baths 2 beds |
show details | |

|
#40
NE 77th Ave
Vancouver, WA 98664
|
1,094 sq. feet
|
2 baths 2 beds |
show details |
| Photo | Address | Area | Beds / Baths | Price | Details |
|---|---|---|---|---|---|

|
#41
NW 8th St
Battle Ground, WA 98604
|
2,466 sq. feet
|
3 baths 4 beds |
show details | |

|
#42
NE 162nd Pl
Vancouver, WA 98684
|
1,240 sq. feet
|
2 baths 3 beds |
show details | |

|
#43
3rd St
Woodland, WA 98674
|
1,920 sq. feet
|
2 baths 4 beds |
show details | |

|
#44
NE Liberty Ct
Portland, OR 97211
|
2,257 sq. feet
|
3 baths 3 beds |
show details | |

|
#45
NE Yacolt Mountain Rd
Yacolt, WA 98675
|
1,620 sq. feet
|
2 baths 2 beds |
show details | |

|
#46
NE 49th St
Vancouver, WA 98661
|
1,928 sq. feet
|
2 baths 3 beds |
show details | |

|
#47
NE Nicholson Loop
Vancouver, WA 98661
|
1,246 sq. feet
|
3 baths 3 beds |
show details | |

|
#48
NW Valley St
Camas, WA 98607
|
4,840 sq. feet
|
3 baths 4 beds |
show details | |

|
#49
C St
Vancouver, WA 98663
|
1,497 sq. feet
|
1 baths 3 beds |
show details | |

|
Check over 1 million property listings on Foreclosure.com!
|
browse all offers | |||

- 98488.8%White alone
- 645.8%Hispanic
- 201.8%Asian alone
- 201.8%Two or more races
- 90.8%American Indian alone
- 80.7%Native Hawaiian and Other
Pacific Islander alone - 20.2%Black alone
- 10.09%Other race alone
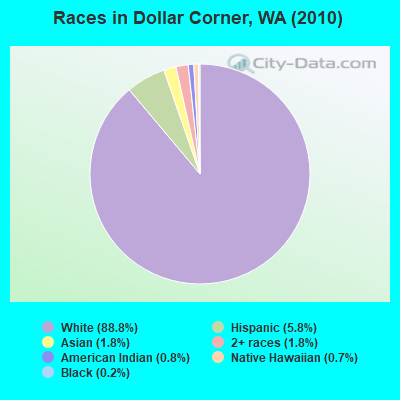
Races in Dollar Corner detailed stats: ancestries, foreign born residents, place of birth
 Recent articles from our blog. Our writers, many of them Ph.D. graduates or candidates, create easy-to-read articles on a wide variety of topics.

 | What is this neighborhood called? (4 replies) |
Ancestries: German (21.8%), English (16.6%), Irish (10.1%), United States (8.8%), Swedish (5.6%), French (3.1%).
Current Local Time: PST time zone
Elevation: 225 feet
Land area: 3.98 square miles.
Population density: 278 people per square mile (very low).
25 residents are foreign born (1.4% Europe, 1.0% Latin America).
| This place: | 2.4% |
| Washington: | 10.4% |
| Dollar Corner CDP: | 1.0% ($1,973) |
| Washington: | 1.2% ($1,915) |
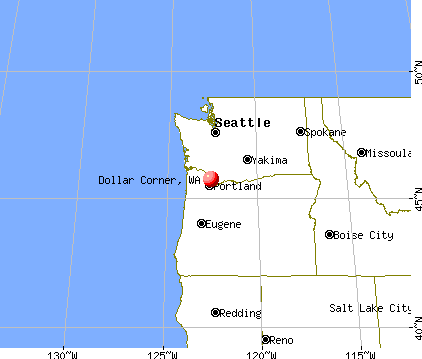
Nearest city with pop. 50,000+: Vancouver, WA  (10.1 miles , pop. 143,560).
Nearest city with pop. 200,000+: Portland, OR (17.9 miles , pop. 529,121).
Nearest city with pop. 1,000,000+: Los Angeles, CA (838.7 miles , pop. 3,694,820).
Nearest cities:
), ), ), ), ), ), )Latitude: 45.78 N, Longitude: 122.59 W
Area code commonly used in this area: 360
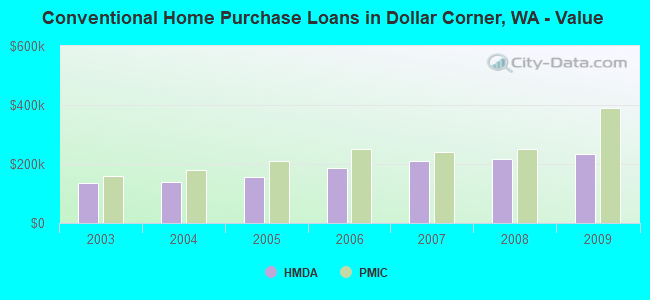
Property values in Dollar Corner, WA
| Here: | 4.8% |
| Washington: | 4.6% |
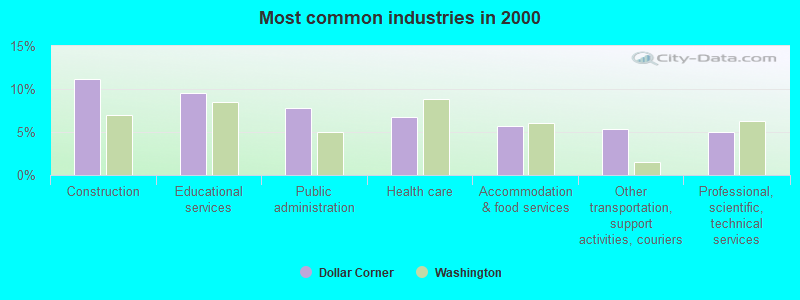
- Construction (11.1%)
- Educational services (9.5%)
- Public administration (7.7%)
- Health care (6.7%)
- Accommodation & food services (5.8%)
- Other transportation, support activities, couriers (5.4%)
- Professional, scientific, technical services (5.0%)
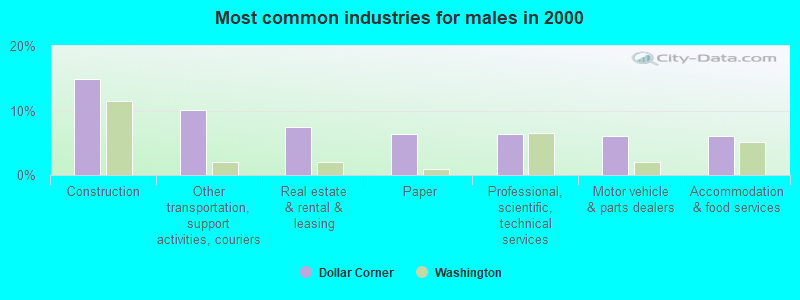
- Construction (14.9%)
- Other transportation, support activities, couriers (10.1%)
- Real estate & rental & leasing (7.5%)
- Paper (6.3%)
- Professional, scientific, technical services (6.3%)
- Motor vehicle & parts dealers (6.0%)
- Accommodation & food services (6.0%)
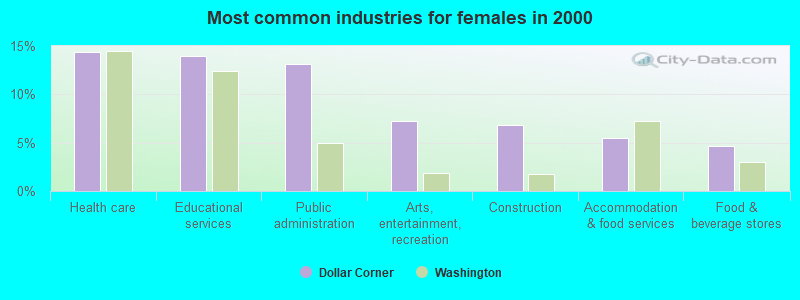
- Health care (14.4%)
- Educational services (14.0%)
- Public administration (13.1%)
- Arts, entertainment, recreation (7.2%)
- Construction (6.8%)
- Accommodation & food services (5.5%)
- Food & beverage stores (4.7%)
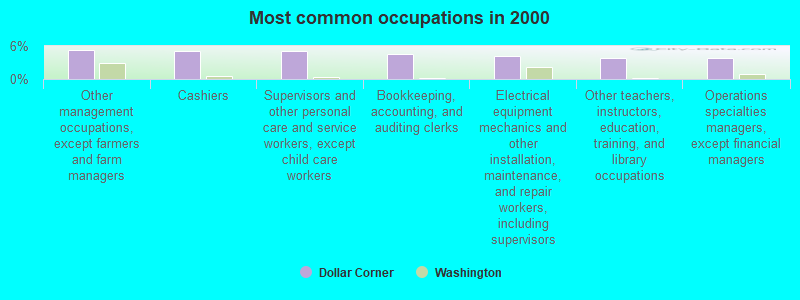
- Other management occupations, except farmers and farm managers (5.4%)
- Cashiers (5.2%)
- Supervisors and other personal care and service workers, except child care workers (5.2%)
- Bookkeeping, accounting, and auditing clerks (4.6%)
- Electrical equipment mechanics and other installation, maintenance, and repair workers, including supervisors (4.2%)
- Other teachers, instructors, education, training, and library occupations (3.8%)
- Operations specialties managers, except financial managers (3.8%)
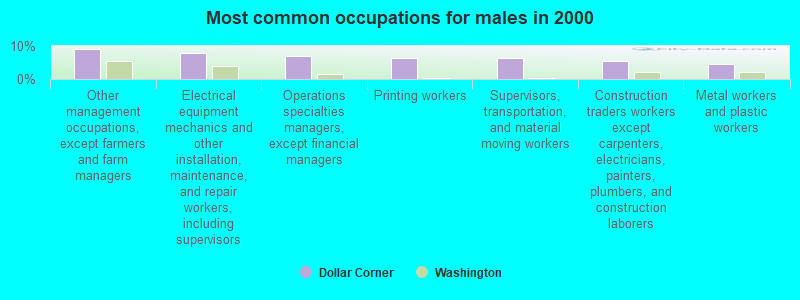
- Other management occupations, except farmers and farm managers (9.0%)
- Electrical equipment mechanics and other installation, maintenance, and repair workers, including supervisors (7.8%)
- Operations specialties managers, except financial managers (7.1%)
- Printing workers (6.3%)
- Supervisors, transportation, and material moving workers (6.3%)
- Construction traders workers except carpenters, electricians, painters, plumbers, and construction laborers (5.6%)
- Metal workers and plastic workers (4.5%)
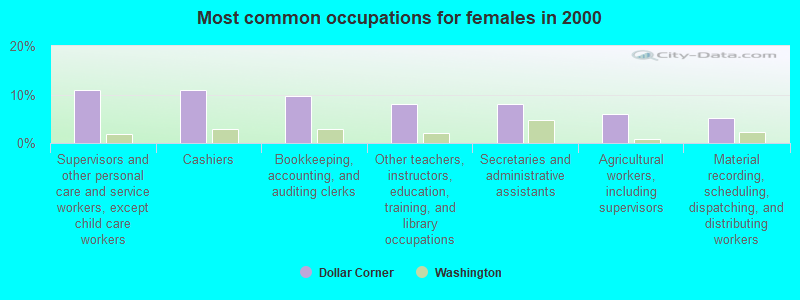
- Supervisors and other personal care and service workers, except child care workers (11.0%)
- Cashiers (11.0%)
- Bookkeeping, accounting, and auditing clerks (9.7%)
- Other teachers, instructors, education, training, and library occupations (8.1%)
- Secretaries and administrative assistants (8.1%)
- Agricultural workers, including supervisors (5.9%)
- Material recording, scheduling, dispatching, and distributing workers (5.1%)
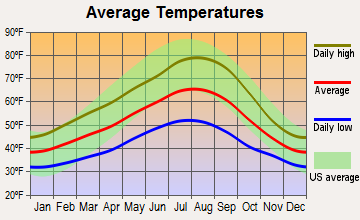
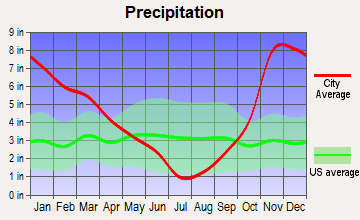
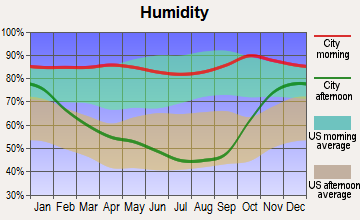
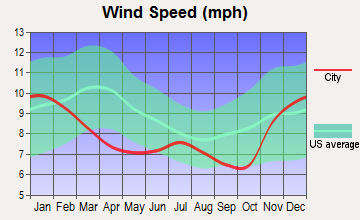
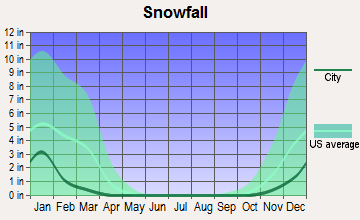
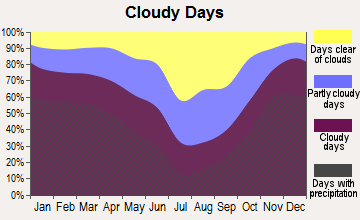
Average climate in Dollar Corner, Washington
Based on data reported by over 4,000 weather stations
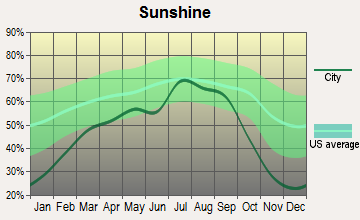
(lower is better)
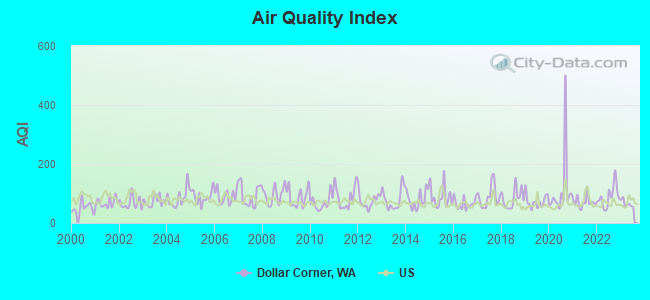
Air Quality Index (AQI) level in 2023 was 65.6. This is about average.
| City: | 65.6 |
| U.S.: | 72.6 |
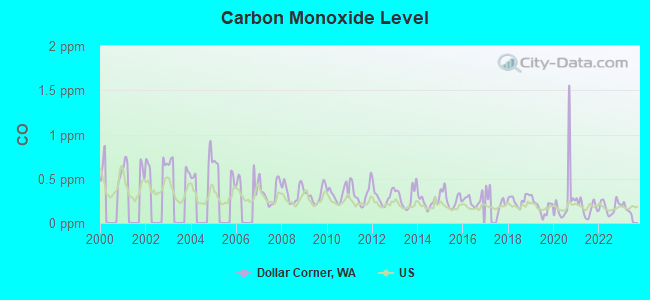
Carbon Monoxide (CO) [ppm] level in 2022 was 0.181. This is better than average. Closest monitor was 11.0 miles away from the city center.
| City: | 0.181 |
| U.S.: | 0.251 |
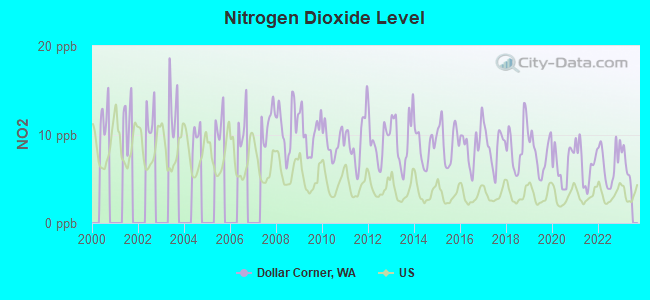
Nitrogen Dioxide (NO2) [ppb] level in 2022 was 6.68. This is worse than average. Closest monitor was 11.8 miles away from the city center.
| City: | 6.68 |
| U.S.: | 5.11 |
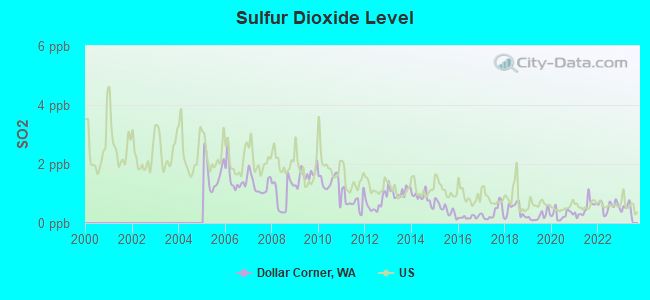
Sulfur Dioxide (SO2) [ppb] level in 2022 was 0.569. This is significantly better than average. Closest monitor was 11.0 miles away from the city center.
| City: | 0.569 |
| U.S.: | 1.515 |
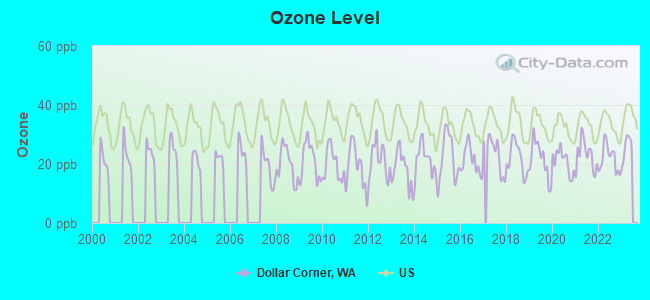
Ozone [ppb] level in 2022 was 21.8. This is significantly better than average. Closest monitor was 7.2 miles away from the city center.
| City: | 21.8 |
| U.S.: | 33.3 |
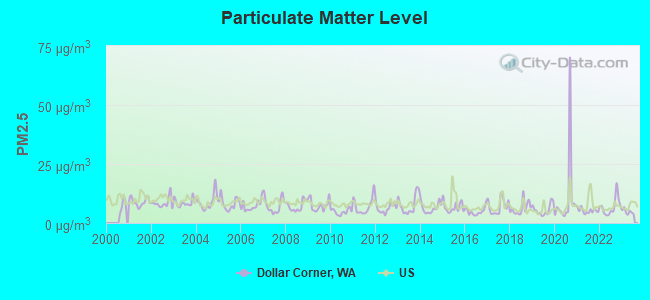
Particulate Matter (PM2.5) [µg/m3] level in 2023 was 4.77. This is significantly better than average. Closest monitor was 8.8 miles away from the city center.
| City: | 4.77 |
| U.S.: | 8.11 |
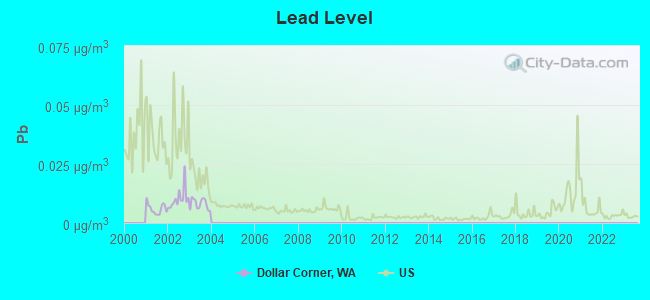
Lead (Pb) [µg/m3] level in 2003 was 0.00810. This is about average. Closest monitor was 8.8 miles away from the city center.
| City: | 0.00810 |
| U.S.: | 0.00931 |
Earthquake activity:
Dollar Corner-area historical earthquake activity is significantly above Washington state average. It is 1501% greater than the overall U.S. average.On 4/13/1949 at 19:55:42, a magnitude 7.0 (7.0 UK, Class: Major, Intensity: VIII - XII) earthquake occurred 101.8 miles away from the city center, causing $80,000,000 total damage
On 2/28/2001 at 18:54:32, a magnitude 6.8 (6.5 MB, 6.6 MS, 6.8 MW, Class: Strong, Intensity: VII - IX) earthquake occurred 90.7 miles away from the city center, causing $2,000,000,000 total damage and $305,000,000 insured losses
On 2/28/2001 at 18:54:32, a magnitude 6.8 (6.8 MD, Depth: 32.2 mi) earthquake occurred 95.0 miles away from Dollar Corner center
On 4/29/1965 at 15:28:43, a magnitude 6.6 (6.6 UK) earthquake occurred 107.1 miles away from Dollar Corner center, causing $28,000,000 total damage
On 1/31/1922 at 13:17:28, a magnitude 7.6 (7.6 UK) earthquake occurred 381.6 miles away from the city center
On 11/8/1980 at 10:27:34, a magnitude 7.2 (6.2 MB, 7.2 MS, 7.2 MW, 7.0 ML) earthquake occurred 334.1 miles away from the city center
Magnitude types: body-wave magnitude (MB), duration magnitude (MD), local magnitude (ML), surface-wave magnitude (MS), moment magnitude (MW)
Natural disasters:
The number of natural disasters in Clark County (13) is near the US average (15).Major Disasters (Presidential) Declared: 12
Emergencies Declared: 1
Causes of natural disasters: Floods: 7, Mudslides: 4, Storms: 4, Winter Storms: 4, Landslides: 3, Winds: 2, Earthquake: 1, Heavy Rain: 1, Hurricane: 1, Snow: 1, Tornado: 1, Volcanic Eruption: 1, Other: 1 (Note: some incidents may be assigned to more than one category).
Hospitals and medical centers near Dollar Corner:
- MEADOW GLADE MANOR (Nursing Home, about 3 miles away; BATTLE GROUND, WA)
- MANORCARE HEALTH SERVICES - SALMON CREEK (Nursing Home, about 5 miles away; VANCOUVER, WA)
- LEGACY SALMON CREEK MEDICAL CENTER Acute Care Hospitals (about 5 miles away; VANCOUVER, WA)
- PNRS SALMON CREEK (Dialysis Facility, about 8 miles away; VANCOUVER, WA)
- RIDGEFIELD CARE FACILITY (Nursing Home, about 8 miles away; RIDGEFIELD, WA)
- MOOREHAVEN CARE CENTER (Nursing Home, about 9 miles away; LA CENTER, WA)
- VANCOUVER DIALYSIS CENTER (Dialysis Facility, about 9 miles away; VANCOUVER, WA)
Amtrak stations near Dollar Corner:
- 12 miles: VANCOUVER (FOOT OF W. 11TH ST.) . Services: ticket office, fully wheelchair accessible, enclosed waiting area, public restrooms, public payphones, vending machines, free short-term parking, free long-term parking, call for taxi service.
- 18 miles: PORTLAND (800 NW 6TH AVE.) . Services: ticket office, fully wheelchair accessible, enclosed waiting area, public restrooms, public payphones, full-service food facilities, paid short-term parking, paid long-term parking, call for car rental service, taxi stand, intercity bus service, public transit connection.
Colleges/universities with over 2000 students nearest to Dollar Corner:
- Clark College (about 11 miles; Vancouver, WA; Full-time enrollment: 9,330)
- Concordia University-Portland (about 15 miles; Portland, OR; FT enrollment: 3,996)
- University of Portland (about 16 miles; Portland, OR; FT enrollment: 4,030)
- Portland State University (about 20 miles; Portland, OR; FT enrollment: 21,450)
- Mt Hood Community College (about 21 miles; Gresham, OR; FT enrollment: 11,847)
- Lewis & Clark College (about 24 miles; Portland, OR; FT enrollment: 2,864)
- Portland Community College (about 25 miles; Portland, OR; FT enrollment: 23,600)
Points of interest:
Notable location: Clark County Fire and Rescue Station 26 (A). Display/hide its location on the map
Church in Dollar Corner: Cherry Grove Friends Church (A). Display/hide its location on the map
| This place: | 2.9 people |
| Washington: | 2.5 people |
| This place: | 78.6% |
| Whole state: | 64.4% |
| This place: | 7.5% |
| Whole state: | 7.7% |
Likely homosexual households (counted as self-reported same-sex unmarried-partner households)
- Lesbian couples: 0.5% of all households
- Gay men: 0.0% of all households
| This place: | 5.5% |
| Whole state: | 10.6% |
| This place: | 1.3% |
| Whole state: | 4.6% |
For population 15 years and over in Dollar Corner:
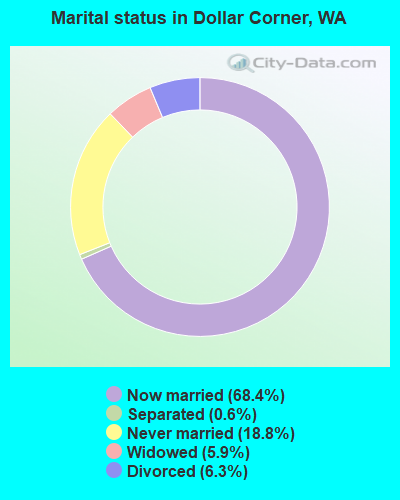
- Never married: 18.8%
- Now married: 68.4%
- Separated: 0.6%
- Widowed: 5.9%
- Divorced: 6.3%
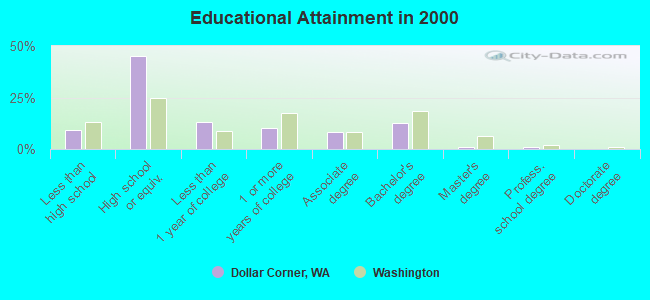
For population 25 years and over in Dollar Corner:
- High school or higher: 90.9%
- Bachelor's degree or higher: 14.4%
- Graduate or professional degree: 1.8%
- Unemployed: 6.5%
- Mean travel time to work (commute): 26.9 minutes
| Here: | 7.7 |
| Washington average: | 11.3 |
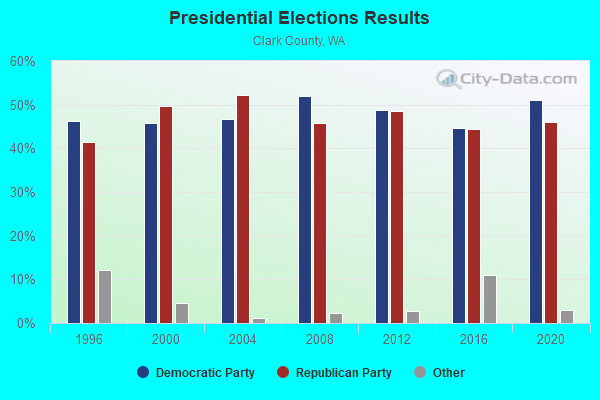
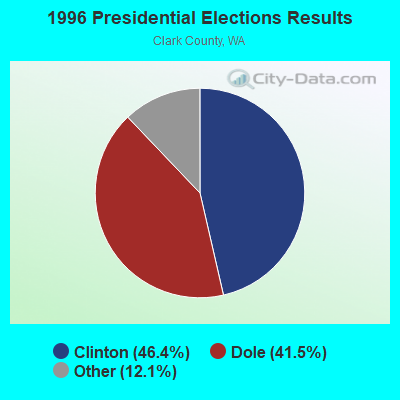
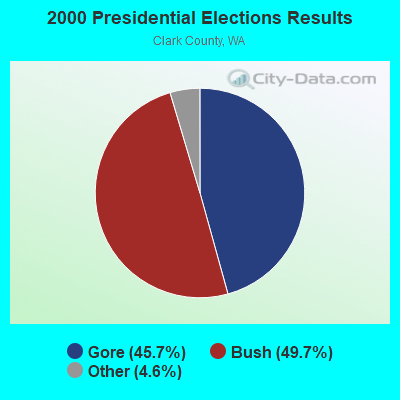
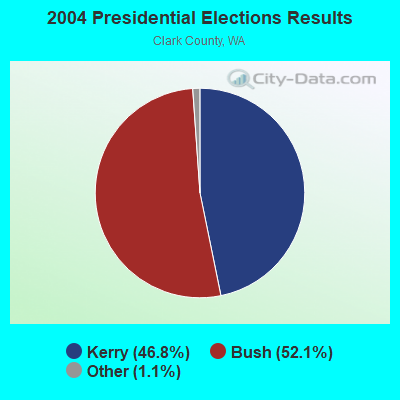
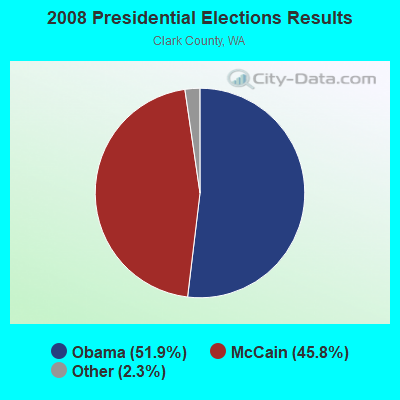
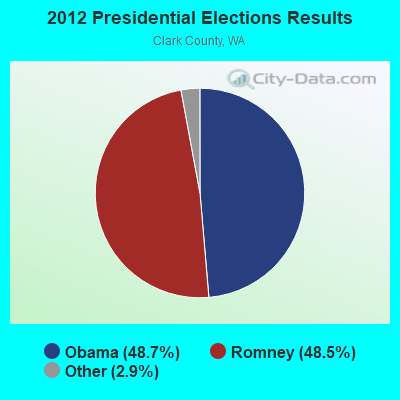
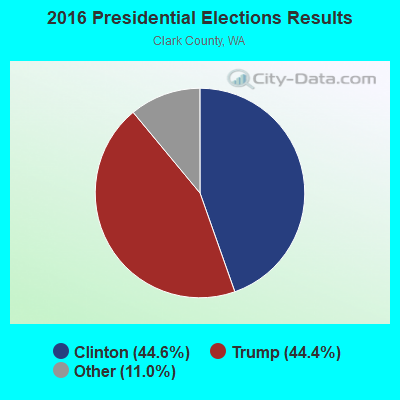
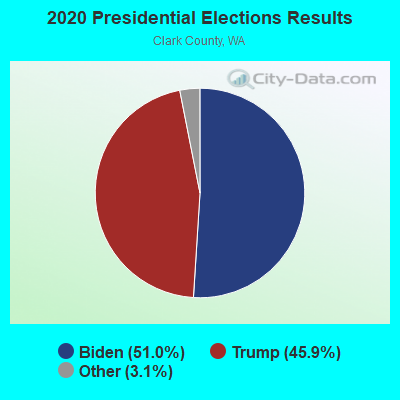
Graphs represent county-level data. Detailed 2008 Election Results
Religion statistics for Dollar Corner, WA (based on Clark County data)
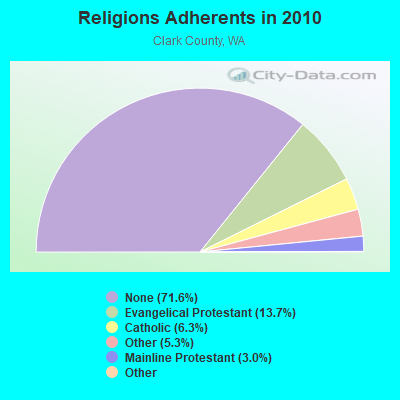
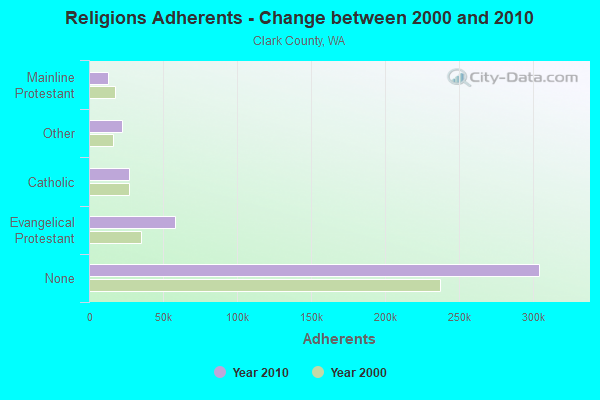
| Religion | Adherents | Congregations |
|---|---|---|
| Evangelical Protestant | 58,413 | 191 |
| Catholic | 26,886 | 9 |
| Other | 22,590 | 60 |
| Mainline Protestant | 12,633 | 37 |
| Black Protestant | 378 | 2 |
| Orthodox | 61 | 1 |
| None | 304,402 | - |
Food Environment Statistics:
| Here: | 1.10 / 10,000 pop. |
| Washington: | 2.06 / 10,000 pop. |
| Clark County: | 0.26 / 10,000 pop. |
| State: | 0.19 / 10,000 pop. |
| This county: | 0.94 / 10,000 pop. |
| Washington: | 1.18 / 10,000 pop. |
| Here: | 2.23 / 10,000 pop. |
| State: | 2.67 / 10,000 pop. |
| Here: | 5.74 / 10,000 pop. |
| Washington: | 8.26 / 10,000 pop. |
| Clark County: | 8.2% |
| State: | 7.7% |
| Clark County: | 27.6% |
| State: | 25.7% |
| Clark County: | 13.7% |
| Washington: | 13.9% |
7.99% of this county's 2021 resident taxpayers lived in other counties in 2020 ($91,627 average adjusted gross income)
| Here: | 7.99% |
| Washington average: | 7.53% |
0.03% of residents moved from foreign countries ($212 average AGI)
Clark County: 0.03% Washington average: 0.05%
Top counties from which taxpayers relocated into this county between 2020 and 2021:
| from Multnomah County, OR | |
| from Washington County, OR | |
| from Clackamas County, OR |
6.69% of this county's 2020 resident taxpayers moved to other counties in 2021 ($81,466 average adjusted gross income)
| Here: | 6.69% |
| Washington average: | 7.40% |
0.01% of residents moved to foreign countries ($99 average AGI)
Clark County: 0.01% Washington average: 0.04%
Top counties to which taxpayers relocated from this county between 2020 and 2021:
| to Multnomah County, OR | |
| to Cowlitz County, WA | |
| to Washington County, OR |
Strongest AM radio stations in Dollar Corner:
- KPAM (860 AM; 50 kW; TROUTDALE, OR; Owner: PAMPLIN BROADCASTING-OREGON, INC.)
- KKAD (1550 AM; 50 kW; VANCOUVER, WA; Owner: PAMPLIN BROADCASTING-WASHINGTON, INC)
- KOTK (1080 AM; 50 kW; PORTLAND, OR; Owner: FISHER BROADCASTING - PORTLAND RADIO, L.L.C.)
- KPOJ (620 AM; 50 kW; PORTLAND, OR; Owner: CITICASTERS LICENSES, L.P.)
- KXL (750 AM; 50 kW; PORTLAND, OR; Owner: ROSE CITY RADIO CORPORATION)
- KEX (1190 AM; 50 kW; PORTLAND, OR; Owner: CITICASTERS LICENSES, L.P.)
- KKSN (1520 AM; 50 kW; OREGON CITY, OR; Owner: ENTERCOM PORTLAND LICENSE, LLC)
- KKGT (1150 AM; 5 kW; PORTLAND, OR; Owner: WESTERN BROADCASTING COMPANY)
- KFXX (910 AM; 10 kW; VANCOUVER, WA; Owner: ENTERCOM PORTLAND LICENSE, LLC (DE))
- KUPL (970 AM; 5 kW; PORTLAND, OR; Owner: INFINITY RADIO OPERATIONS INC.)
- KDZR (1640 AM; 10 kW; LAKE OSWEGO, OR; Owner: ABC, INC.)
- KKSL (1290 AM; 10 kW; LAKE OSWEGO, OR; Owner: ABC, INC.)
- KBMS (1480 AM; 2 kW; VANCOUVER, WA; Owner: CHRISTOPHER H. BENNETT B/CING OF WA)
Strongest FM radio stations in Dollar Corner:
- K273AI (102.5 FM; ARIEL, WA; Owner: CALVARY CHAPEL OF TWIN FALLS, INC.)
- KRVO (105.9 FM; VANCOUVER, WA; Owner: CITICASTERS LICENSES, L.P.)
- KINK (101.9 FM; PORTLAND, OR; Owner: INFINITY RADIO OPERATIONS INC.)
- KKCW (103.3 FM; BEAVERTON, OR; Owner: CITICASTERS LICENSES, L.P.)
- KOPB-FM (91.5 FM; PORTLAND, OR; Owner: OREGON PUBLIC BROADCASTING)
- KPDQ-FM (93.7 FM; PORTLAND, OR; Owner: SALEM MEDIA OF OREGON, INC.)
- KKRZ (100.3 FM; PORTLAND, OR; Owner: CITICASTERS LICENSES, L.P.)
- KMHD (89.1 FM; GRESHAM, OR; Owner: MT. HOOD COMMUNITY COLLEGE DISTRICT)
- KVMX (107.5 FM; BANKS, OR; Owner: INFINITY RADIO OPERATIONS INC.)
- KUFO-FM (101.1 FM; PORTLAND, OR; Owner: INFINITY RADIO OPERATIONS INC.)
- KLTH (106.7 FM; LAKE OSWEGO, OR; Owner: INIFINITY RADIO OF PORTLAND INC.)
- KUPL-FM (98.7 FM; PORTLAND, OR; Owner: INFINITY RADIO OF PORTLAND INC.)
- KBVM (88.3 FM; PORTLAND, OR; Owner: CATHOLIC BROADCASTING NORTHWEST, INC)
- KBPS-FM (89.9 FM; PORTLAND, OR; Owner: SCHOOL DISTRICT #1, MULTNOMAH COUNTY, OR)
- KNRK (94.7 FM; CAMAS, WA; Owner: ENTERCOM PORTLAND LICENSE, LLC (DE))
- KFIS (104.1 FM; SCAPPOOSE, OR; Owner: CARON BROADCASTING, INC.)
- KBOO (90.7 FM; PORTLAND, OR; Owner: THE KBOO FOUNDATION)
- KWJJ-FM (99.5 FM; PORTLAND, OR; Owner: FISHER BROADCASTING - PORTLAND RADIO, L.L.C.)
- KGON (92.3 FM; PORTLAND, OR; Owner: ENTERCOM PORTLAND LICENSE, LLC (DE))
- KKSN-FM (97.1 FM; PORTLAND, OR; Owner: ENTERCOM PORTLAND LICENSE, LLC (DE))
TV broadcast stations around Dollar Corner:
- KATU (Channel 2; PORTLAND, OR; Owner: FISHER BROADCASTING - PORTLAND TV, L.L.C.)
- KPDX (Channel 49; VANCOUVER, WA; Owner: MEREDITH CORPORATION)
- KPTV (Channel 12; PORTLAND, OR; Owner: MEREDITH CORPORATION)
- K57IF (Channel 57; SALEM, OR; Owner: LaGRANDE BROADCASTING, INC.)
- KOIN (Channel 6; PORTLAND, OR; Owner: EMMIS TELEVISION LICENSE CORPORATION)
- KNMT (Channel 24; PORTLAND, OR; Owner: NATIONAL MINORITY T.V., INC.)
- KGW (Channel 8; PORTLAND, OR; Owner: KING BROADCASTING COMPANY)
- KOPB-TV (Channel 10; PORTLAND, OR; Owner: OREGON PUBLIC BROADCASTING)
- KPXG-LP (Channel 54; PORTLAND, OR; Owner: PAXSON COMMUNICATIONS LICENSE COMPANY, LLC)
- K14HN (Channel 14; VANCOUVER/CAMAS, WA; Owner: MEREDITH CORPORATION)
- KWBP-LP (Channel 4; PORTLAND, OR; Owner: TRIBUNE BROADCASTING HOLDINGS, INC.)
Dollar Corner fatal accident list:
Aug 20, 2005 00:39 AM, Sr-502, Ne 50th Ave, Lat: 45.779850, Lon: -122.620490, Vehicles: 2, Persons: 7, Fatalities: 2, Drunk persons involved: 1
Nov 1, 2005 04:33 PM, Ne 72nd Ave, Lat: 45.769440, Lon: -122.599750, Vehicles: 3, Persons: 3, Fatalities: 1
Nov 25, 2000 05:45 AM, Sr-502, Lat: 45.779864, Lon: -122.620481, Vehicles: 2, Persons: 2, Fatalities: 1
- National Bridge Inventory (NBI) Statistics
- 5Number of bridges
- 16ft / 4.9mTotal length
- $9,167,000Total costs
- 66,745Total average daily traffic
- 6,389Total average daily truck traffic
- 87,940Total future (year 2037) average daily traffic
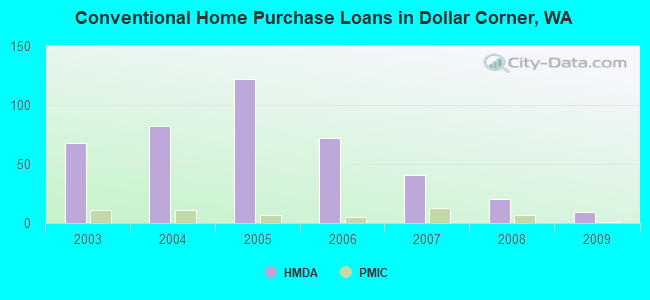
| Home Mortgage Disclosure Act Aggregated Statistics For Year 2009 (Based on 2 partial tracts) | ||||||||||||
| A) FHA, FSA/RHS & VA Home Purchase Loans | B) Conventional Home Purchase Loans | C) Refinancings | D) Home Improvement Loans | F) Non-occupant Loans on < 5 Family Dwellings (A B C & D) | G) Loans On Manufactured Home Dwelling (A B C & D) | |||||||
|---|---|---|---|---|---|---|---|---|---|---|---|---|
| Number | Average Value | Number | Average Value | Number | Average Value | Number | Average Value | Number | Average Value | Number | Average Value | |
| LOANS ORIGINATED | 15 | $208,298 | 9 | $232,692 | 82 | $214,499 | 2 | $61,535 | 3 | $159,860 | 2 | $179,245 |
| APPLICATIONS APPROVED, NOT ACCEPTED | 2 | $241,635 | 1 | $87,970 | 14 | $204,858 | 0 | $0 | 1 | $67,060 | 0 | $0 |
| APPLICATIONS DENIED | 4 | $226,580 | 2 | $313,575 | 27 | $223,635 | 1 | $13,300 | 3 | $212,997 | 2 | $163,590 |
| APPLICATIONS WITHDRAWN | 2 | $224,730 | 2 | $255,335 | 14 | $217,137 | 1 | $21,800 | 1 | $78,380 | 0 | $0 |
| FILES CLOSED FOR INCOMPLETENESS | 1 | $232,130 | 1 | $125,980 | 6 | $223,203 | 0 | $0 | 2 | $135,750 | 0 | $0 |
Detailed HMDA statistics for the following Tracts: 0404.03 , 0404.05
| Private Mortgage Insurance Companies Aggregated Statistics For Year 2009 (Based on 2 partial tracts) | ||||
| A) Conventional Home Purchase Loans | B) Refinancings | |||
|---|---|---|---|---|
| Number | Average Value | Number | Average Value | |
| LOANS ORIGINATED | 1 | $391,400 | 2 | $225,475 |
| APPLICATIONS APPROVED, NOT ACCEPTED | 1 | $161,540 | 1 | $251,410 |
| APPLICATIONS DENIED | 0 | $0 | 0 | $0 |
| APPLICATIONS WITHDRAWN | 0 | $0 | 0 | $0 |
| FILES CLOSED FOR INCOMPLETENESS | 0 | $0 | 0 | $0 |
Detailed PMIC statistics for the following Tracts: 0404.03 , 0404.05
Dollar Corner compared to Washington state average:
- Unemployed percentage below state average.
- Black race population percentage significantly below state average.
- Hispanic race population percentage below state average.
- Median age significantly above state average.
- Foreign-born population percentage significantly below state average.
- Renting percentage below state average.
- Length of stay since moving in significantly above state average.
- Number of rooms per house significantly below state average.
- House age significantly below state average.
- Percentage of population with a bachelor's degree or higher below state average.