Eagle Mountain, Texas
Submit your own pictures of this place and show them to the world
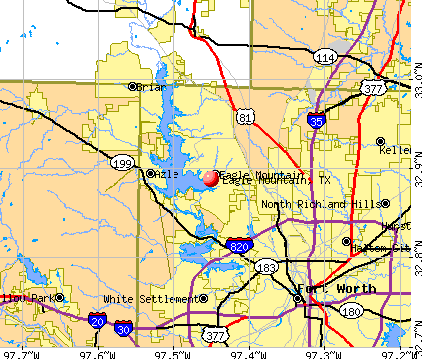
- OSM Map
- General Map
- Google Map
- MSN Map
| Males: 3,900 | |
| Females: 3,857 |
| Median resident age: | 41.8 years |
| Texas median age: | 32.3 years |
Zip codes: 76179.
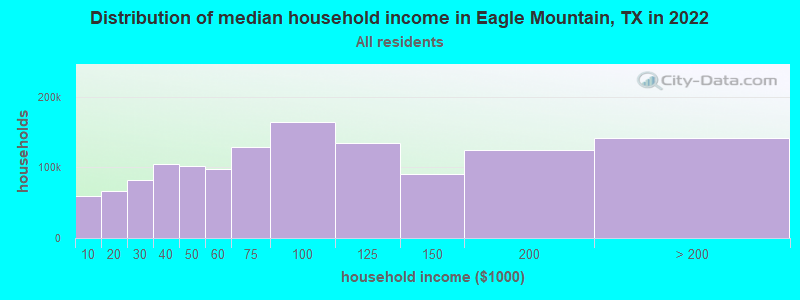
| Eagle Mountain: | $125,589 |
| TX: | $72,284 |
Estimated per capita income in 2022: $58,962 (it was $33,934 in 2000)
Eagle Mountain CDP income, earnings, and wages data
Estimated median house or condo value in 2022: $574,164 (it was $163,100 in 2000)
| Eagle Mountain: | $574,164 |
| TX: | $275,400 |
Mean prices in 2022: all housing units: $370,879; detached houses: $380,494; townhouses or other attached units: $313,178; in 2-unit structures: $229,231; in 3-to-4-unit structures: $150,158; in 5-or-more-unit structures: $297,953; mobile homes: $87,996; occupied boats, rvs, vans, etc.: $43,379
Eagle Mountain, TX residents, houses, and apartments details
Detailed information about poverty and poor residents in Eagle Mountain, TX


- 6,09892.4%White alone
- 2634.0%Hispanic
- 961.5%Two or more races
- 600.9%Black alone
- 460.7%Asian alone
- 340.5%American Indian alone
- 20.03%Native Hawaiian and Other
Pacific Islander alone
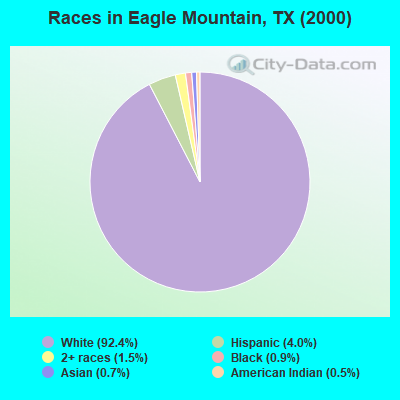
Races in Eagle Mountain detailed stats: ancestries, foreign born residents, place of birth
 Recent articles from our blog. Our writers, many of them Ph.D. graduates or candidates, create easy-to-read articles on a wide variety of topics.

 | Eagle Mountain Lake - Recreation (3 replies) |
| Best Fort Worth/Dallas suburbs for families (12 replies) |
| Keller, Northwest or Eagle Mountain ISD? (8 replies) |
| Tell me about Azle (13 replies) |
| Lake Granbury or Eagle Mountain Lake (14 replies) |
| considering a home in Eagle Mountain Lake area (1 reply) |
Latest news from Eagle Mountain, TX collected exclusively by city-data.com from local newspapers, TV, and radio stations
Ancestries: German (17.2%), English (14.0%), United States (11.9%), Irish (9.4%), Scottish (4.2%), French (3.3%).
Current Local Time: CST time zone
Land area: 22.3 square miles.
Population density: 347 people per square mile (very low).
188 residents are foreign born (0.7% Europe, 0.7% Asia, 0.6% Latin America, 0.6% North America).
| This place: | 2.8% |
| Texas: | 13.9% |
| Eagle Mountain CDP: | 1.8% ($2,856) |
| Texas: | 1.8% ($1,393) |
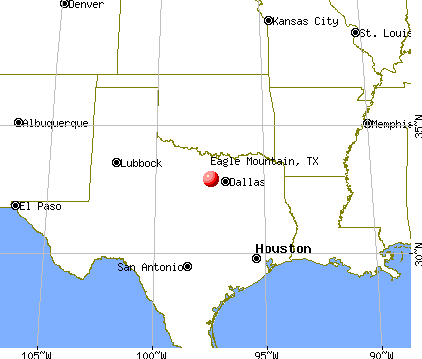
Nearest city with pop. 50,000+: Fort Worth, TX  (12.3 miles , pop. 534,694).
Nearest city with pop. 1,000,000+: Dallas, TX (39.0 miles , pop. 1,188,580).
Nearest cities:
), )Latitude: 32.89 N, Longitude: 97.45 W
Daytime population change due to commuting: -2,614 (-39.6%)
Workers who live and work in this place: 378 (10.7%)
Area code commonly used in this area: 817
Property values in Eagle Mountain, TX
| Here: | 3.3% |
| Texas: | 3.5% |
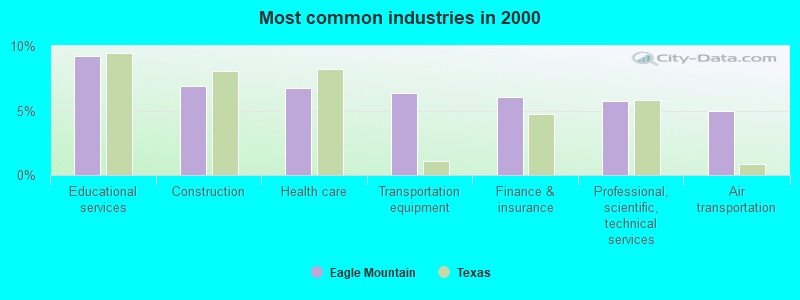
- Educational services (9.2%)
- Construction (6.9%)
- Health care (6.8%)
- Transportation equipment (6.4%)
- Finance & insurance (6.0%)
- Professional, scientific, technical services (5.7%)
- Air transportation (4.9%)
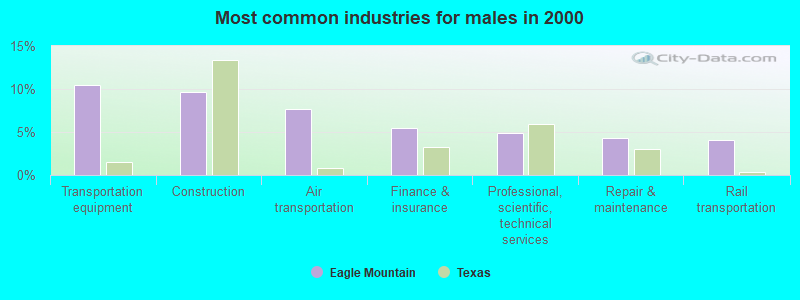
- Transportation equipment (10.5%)
- Construction (9.6%)
- Air transportation (7.7%)
- Finance & insurance (5.4%)
- Professional, scientific, technical services (4.9%)
- Repair & maintenance (4.3%)
- Rail transportation (4.1%)
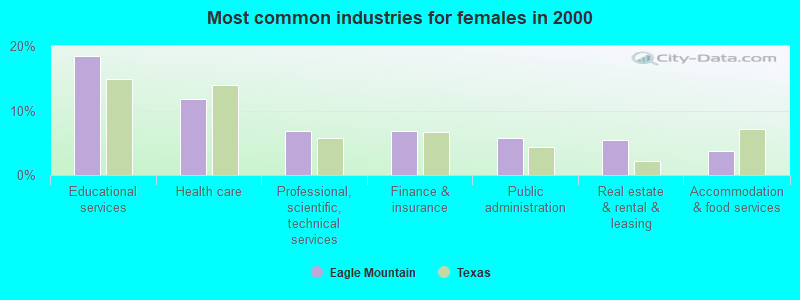
- Educational services (18.5%)
- Health care (11.7%)
- Professional, scientific, technical services (6.8%)
- Finance & insurance (6.8%)
- Public administration (5.7%)
- Real estate & rental & leasing (5.3%)
- Accommodation & food services (3.7%)
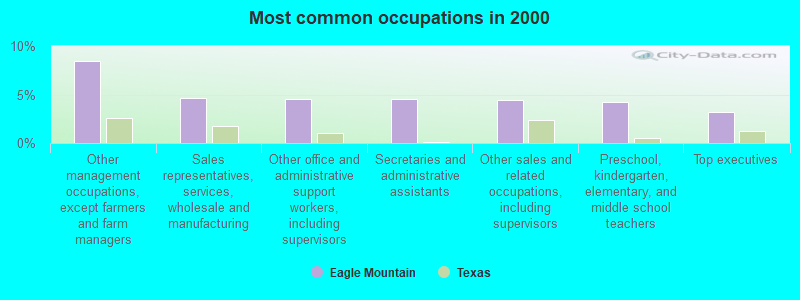
- Other management occupations, except farmers and farm managers (8.4%)
- Sales representatives, services, wholesale and manufacturing (4.6%)
- Other office and administrative support workers, including supervisors (4.6%)
- Secretaries and administrative assistants (4.5%)
- Other sales and related occupations, including supervisors (4.5%)
- Preschool, kindergarten, elementary, and middle school teachers (4.2%)
- Top executives (3.2%)
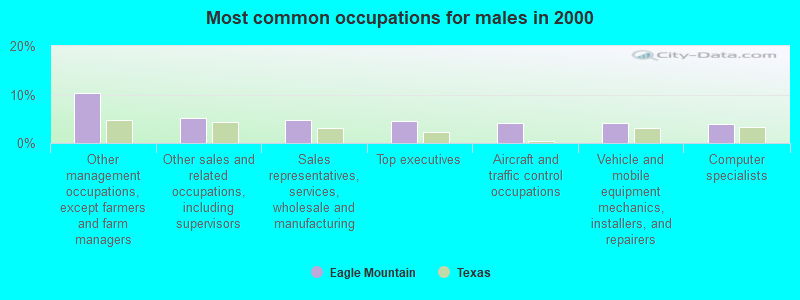
- Other management occupations, except farmers and farm managers (10.2%)
- Other sales and related occupations, including supervisors (5.1%)
- Sales representatives, services, wholesale and manufacturing (4.8%)
- Top executives (4.5%)
- Aircraft and traffic control occupations (4.2%)
- Vehicle and mobile equipment mechanics, installers, and repairers (4.1%)
- Computer specialists (4.0%)
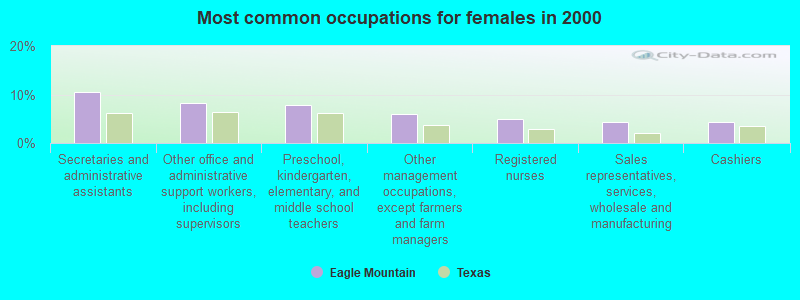
- Secretaries and administrative assistants (10.5%)
- Other office and administrative support workers, including supervisors (8.2%)
- Preschool, kindergarten, elementary, and middle school teachers (7.8%)
- Other management occupations, except farmers and farm managers (6.0%)
- Registered nurses (5.0%)
- Sales representatives, services, wholesale and manufacturing (4.4%)
- Cashiers (4.4%)
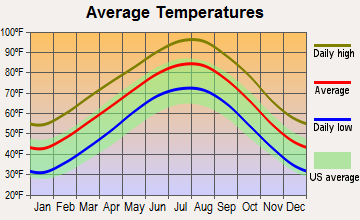
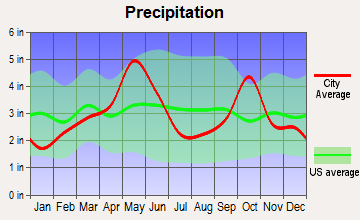
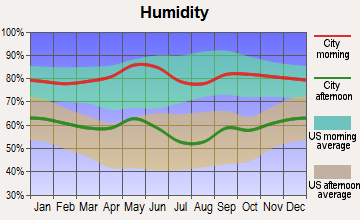
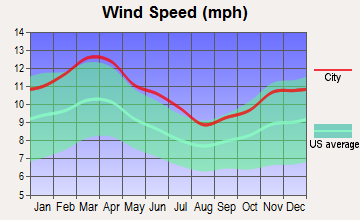
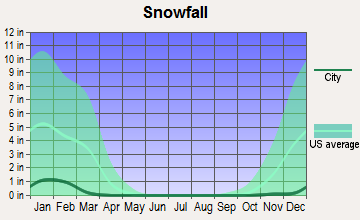
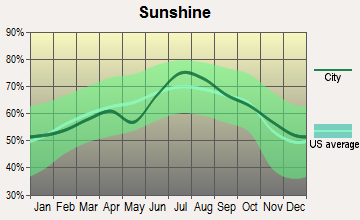
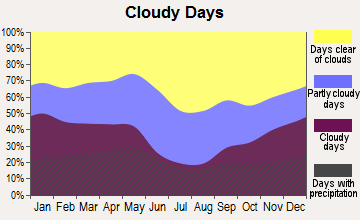
Average climate in Eagle Mountain, Texas
Based on data reported by over 4,000 weather stations
(lower is better)
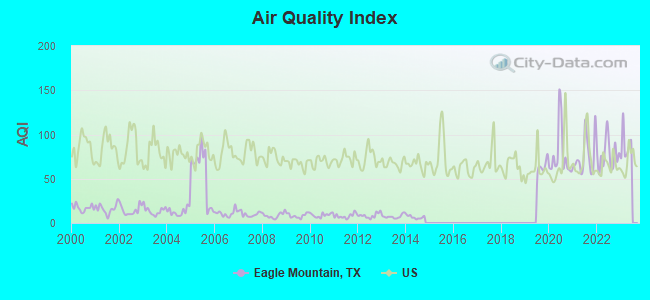
Air Quality Index (AQI) level in 2022 was 76.9. This is about average.
| City: | 76.9 |
| U.S.: | 72.6 |
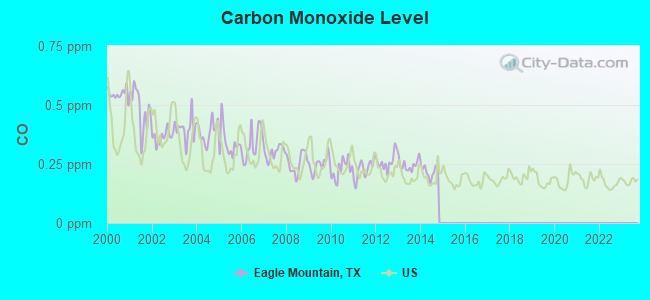
Carbon Monoxide (CO) [ppm] level in 2014 was 0.219. This is about average. Closest monitor was 7.9 miles away from the city center.
| City: | 0.219 |
| U.S.: | 0.251 |
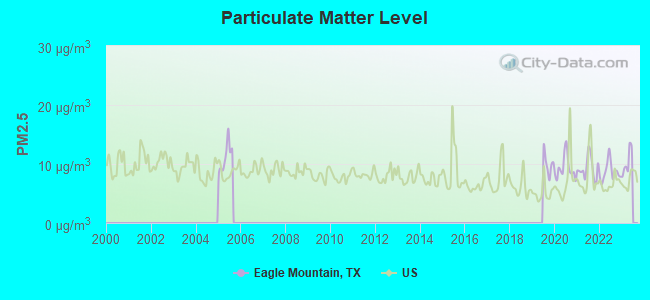
Particulate Matter (PM2.5) [µg/m3] level in 2022 was 8.72. This is about average. Closest monitor was 7.9 miles away from the city center.
| City: | 8.72 |
| U.S.: | 8.11 |
Tornado activity:
Eagle Mountain-area historical tornado activity is above Texas state average. It is 143% greater than the overall U.S. average.
On 4/25/1990, a category F4 (max. wind speeds 207-260 mph) tornado 17.4 miles away from the Eagle Mountain place center caused between $500,000 and $5,000,000 in damages.
On 5/4/1960, a category F3 (max. wind speeds 158-206 mph) tornado 6.2 miles away from the place center injured 12 people and caused between $50,000 and $500,000 in damages.
Earthquake activity:
Eagle Mountain-area historical earthquake activity is significantly above Texas state average. It is 481% greater than the overall U.S. average.On 11/6/2011 at 03:53:10, a magnitude 5.7 (5.7 MW, Depth: 3.2 mi, Class: Moderate, Intensity: VI - VII) earthquake occurred 187.1 miles away from the city center
On 9/3/2016 at 12:02:44, a magnitude 5.8 (5.8 MW, Depth: 3.5 mi) earthquake occurred 246.5 miles away from the city center
On 6/16/1978 at 11:46:54, a magnitude 5.3 (4.4 MB, 4.6 UK, 5.3 ML) earthquake occurred 192.6 miles away from Eagle Mountain center
On 11/7/2016 at 01:44:24, a magnitude 5.0 (5.0 MW, Depth: 2.8 mi) earthquake occurred 217.8 miles away from the city center
On 11/8/2011 at 02:46:57, a magnitude 4.8 (4.8 MW, Depth: 3.1 mi, Class: Light, Intensity: IV - V) earthquake occurred 186.7 miles away from the city center
On 11/5/2011 at 07:12:45, a magnitude 4.8 (4.8 MW, Depth: 1.9 mi) earthquake occurred 188.3 miles away from the city center
Magnitude types: body-wave magnitude (MB), local magnitude (ML), moment magnitude (MW)
Natural disasters:
The number of natural disasters in Tarrant County (23) is greater than the US average (15).Major Disasters (Presidential) Declared: 10
Emergencies Declared: 10
Causes of natural disasters: Storms: 8, Floods: 7, Hurricanes: 7, Fires: 6, Tornadoes: 5, Wind: 1, Other: 2 (Note: some incidents may be assigned to more than one category).
Hospitals and medical centers near Eagle Mountain:
- LAMPLIGHTER COMMUNITY HOME (Hospital, about 5 miles away; AZLE, TX)
- LAKEVIEW COMMUNITY HOME (Hospital, about 5 miles away; AZLE, TX)
- CANTERBURY VILLA OF FORT WORTH (Nursing Home, about 5 miles away; FORT WORTH, TX)
- JAMES STREET COMMUNITY HOME (Hospital, about 5 miles away; AZLE, TX)
- AZLE MANOR INC (Nursing Home, about 5 miles away; AZLE, TX)
- TEXAS HEALTH HARRIS METHODIST HOSPITAL AZLE Acute Care Hospitals (about 5 miles away; AZLE, TX)
- HARRIS METHODIST NORTHWEST (Nursing Home, about 5 miles away; AZLE, TX)
Amtrak station near Eagle Mountain:
Colleges/universities with over 2000 students nearest to Eagle Mountain:
- Tarrant County College District (about 13 miles; Fort Worth, TX; Full-time enrollment: 33,775)
- Texas Christian University (about 14 miles; Fort Worth, TX; FT enrollment: 9,131)
- Weatherford College (about 23 miles; Weatherford, TX; FT enrollment: 4,080)
- The University of Texas at Arlington (about 23 miles; Arlington, TX; FT enrollment: 27,453)
- DeVry University-Texas (about 26 miles; Irving, TX; FT enrollment: 4,098)
- North Lake College (about 29 miles; Irving, TX; FT enrollment: 6,191)
- University of North Texas (about 29 miles; Denton, TX; FT enrollment: 31,694)
Points of interest:
Notable locations in Eagle Mountain: Eagle Mountain Volunteer Fire Department Station 1 (A), Fort Worth Fire Department Station 40 (B). Display/hide their locations on the map
Churches in Eagle Mountain include: Lakeview Baptist Church (A), Eagle Mountain Baptist Church (B), Lakeview Church (C). Display/hide their locations on the map
Creek: Dosier Creek (A). Display/hide its location on the map
Park in Eagle Mountain: Pioneer Stadium (1). Display/hide its location on the map
Beach: Twin Points Beach (A). Display/hide its location on the map
| This place: | 2.5 people |
| Texas: | 2.7 people |
| This place: | 77.2% |
| Whole state: | 71.5% |
| This place: | 2.4% |
| Whole state: | 4.4% |
Likely homosexual households (counted as self-reported same-sex unmarried-partner households)
- Lesbian couples: 0.0% of all households
- Gay men: 0.1% of all households
| This place: | 3.8% |
| Whole state: | 15.4% |
| This place: | 1.2% |
| Whole state: | 6.7% |
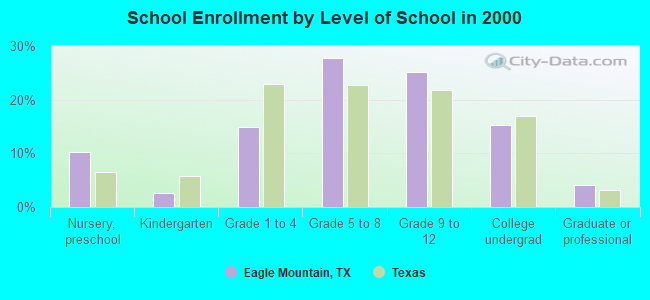
For population 15 years and over in Eagle Mountain:
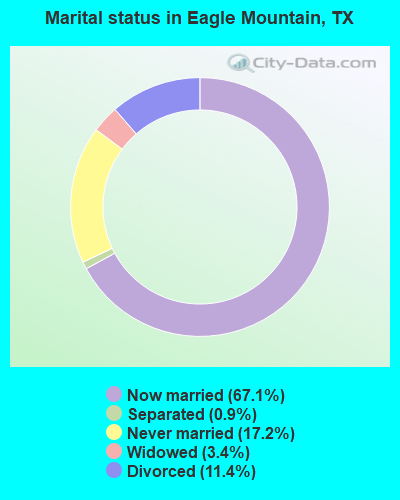
- Never married: 17.2%
- Now married: 67.1%
- Separated: 0.9%
- Widowed: 3.4%
- Divorced: 11.4%
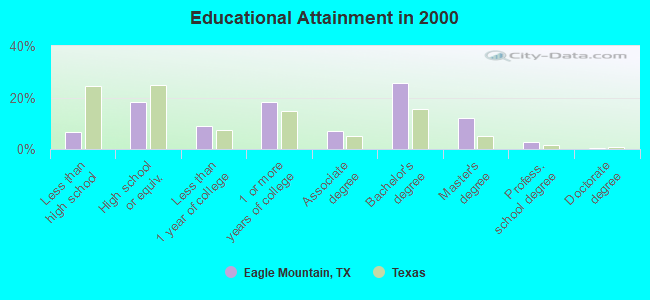
For population 25 years and over in Eagle Mountain:
- High school or higher: 93.4%
- Bachelor's degree or higher: 40.5%
- Graduate or professional degree: 14.9%
- Unemployed: 1.5%
- Mean travel time to work (commute): 30.5 minutes
| Here: | 9.2 |
| Texas average: | 15.6 |
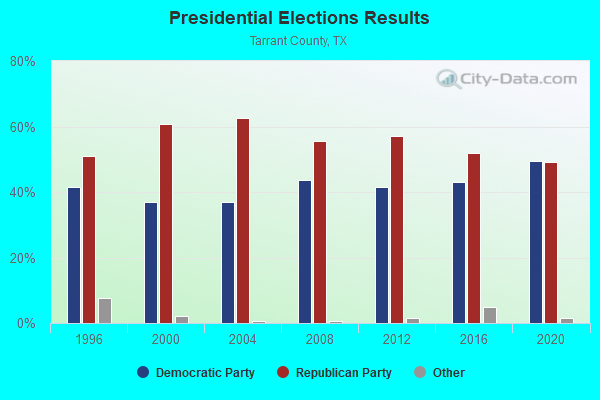
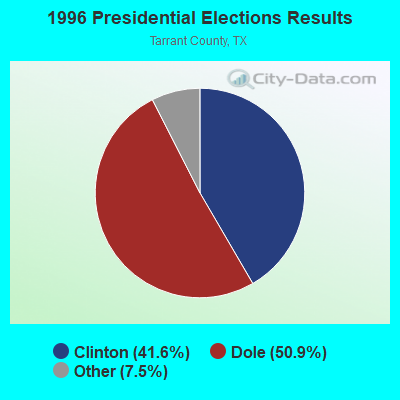
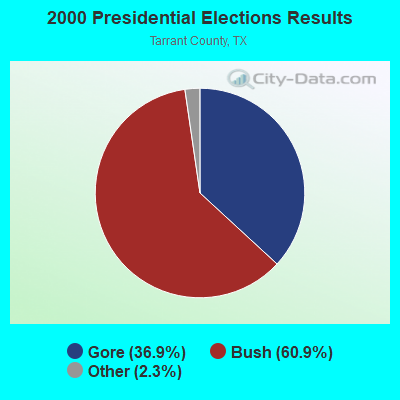
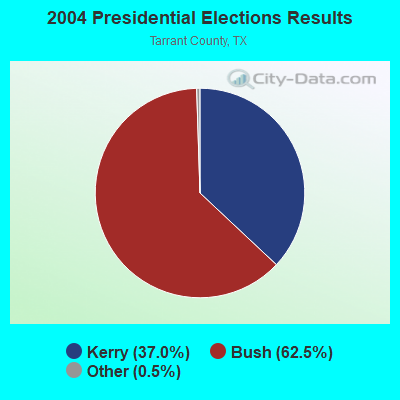
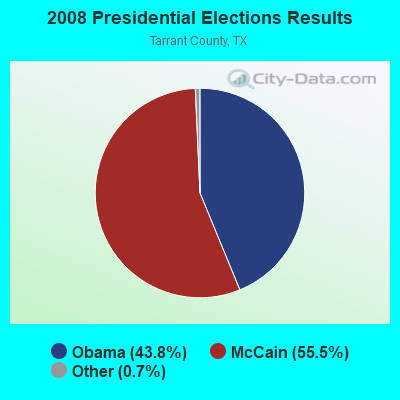
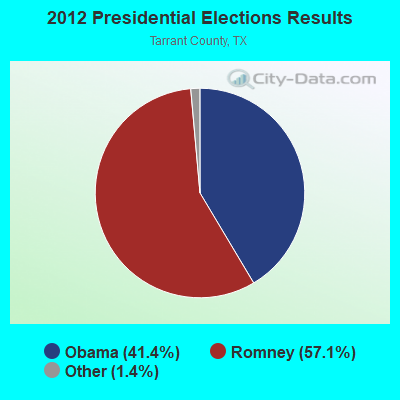
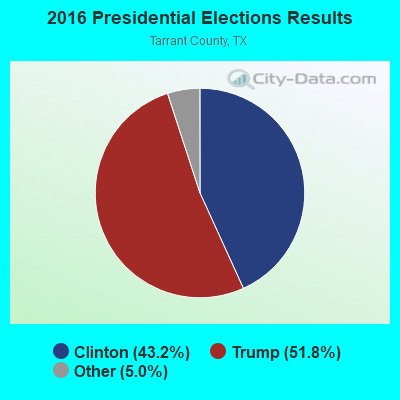
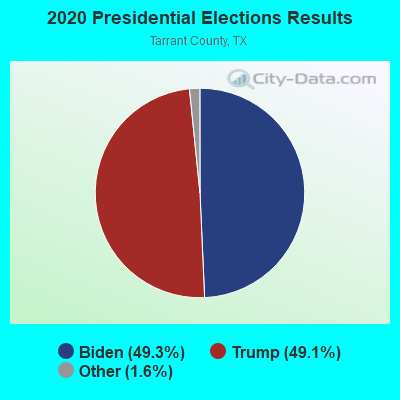
Graphs represent county-level data. Detailed 2008 Election Results
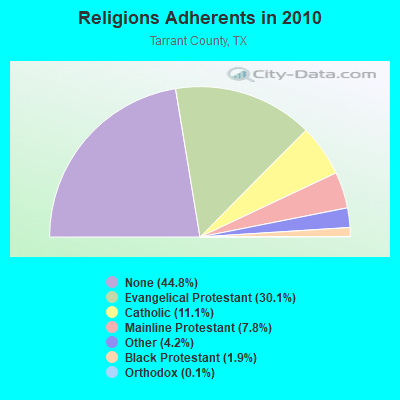
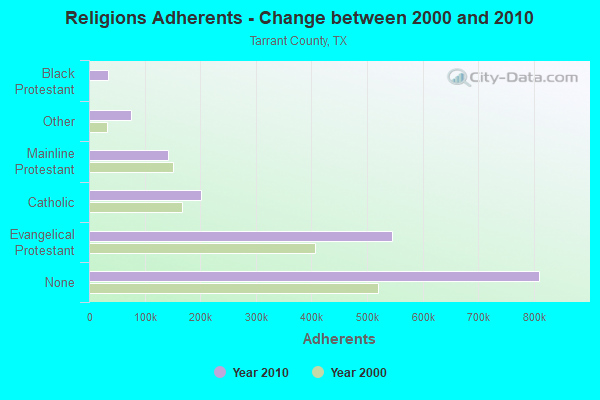
Religion statistics for Eagle Mountain, TX (based on Tarrant County data)
| Religion | Adherents | Congregations |
|---|---|---|
| Evangelical Protestant | 544,670 | 1,272 |
| Catholic | 200,645 | 33 |
| Mainline Protestant | 141,938 | 158 |
| Other | 75,335 | 122 |
| Black Protestant | 33,665 | 103 |
| Orthodox | 2,596 | 7 |
| None | 810,185 | - |
Food Environment Statistics:
| Here: | 1.24 / 10,000 pop. |
| Texas: | 1.47 / 10,000 pop. |
| Here: | 0.15 / 10,000 pop. |
| Texas: | 0.14 / 10,000 pop. |
| Tarrant County: | 1.14 / 10,000 pop. |
| Texas: | 1.11 / 10,000 pop. |
| Tarrant County: | 3.56 / 10,000 pop. |
| Texas: | 3.95 / 10,000 pop. |
| This county: | 5.68 / 10,000 pop. |
| State: | 6.13 / 10,000 pop. |
| Here: | 8.1% |
| State: | 8.9% |
| Tarrant County: | 26.1% |
| State: | 26.6% |
| Tarrant County: | 14.5% |
| Texas: | 15.7% |
7.43% of this county's 2021 resident taxpayers lived in other counties in 2020 ($70,478 average adjusted gross income)
| Here: | 7.43% |
| Texas average: | 8.12% |
0.03% of residents moved from foreign countries ($213 average AGI)
Tarrant County: 0.03% Texas average: 0.04%
Top counties from which taxpayers relocated into this county between 2020 and 2021:
| from Dallas County, TX | |
| from Denton County, TX | |
| from Johnson County, TX |
7.19% of this county's 2020 resident taxpayers moved to other counties in 2021 ($70,939 average adjusted gross income)
| Here: | 7.19% |
| Texas average: | 7.40% |
0.03% of residents moved to foreign countries ($199 average AGI)
Tarrant County: 0.03% Texas average: 0.03%
Top counties to which taxpayers relocated from this county between 2020 and 2021:
| to Dallas County, TX | |
| to Denton County, TX | |
| to Johnson County, TX |
Strongest AM radio stations in Eagle Mountain:
- KAHZ (1360 AM; 50 kW; HURST, TX)
- KESS (1270 AM; 50 kW; FORT WORTH, TX; Owner: KESS-AM LICENSE CORP.)
- WBAP (820 AM; 50 kW; FORT WORTH, TX; Owner: WBAP-KSCS OPERATING, LTD.)
- KHVN (970 AM; 10 kW; FORT WORTH, TX; Owner: MORTENSON BROADCASTING COMPANY)
- KZMP (1540 AM; 50 kW; UNIVERSITY PARK, TX; Owner: ENTRAVISION HOLDINGS, LLC)
- KBIS (1150 AM; 25 kW; HIGHLAND PARK, TX; Owner: DALLAS AM RADIO PARTNERS, L.P.)
- KRLD (1080 AM; 50 kW; DALLAS, TX; Owner: TEXAS INFINITY BROADCASTING L.P.)
- KNAX (1630 AM; 10 kW; FT. WORTH, TX; Owner: MORTENSON BROADCASTING COMPANY)
- KSKY (660 AM; 20 kW; BALCH SPRINGS, TX; Owner: BISON MEDIA, INC.)
- KFXR (1190 AM; 50 kW; DALLAS, TX; Owner: CLEAR CHANNEL BROADCASTING LICENSES, INC.)
- KLIF (570 AM; 5 kW; DALLAS, TX; Owner: KLIF LICO, INC.)
- KTNO (1440 AM; 12 kW; DENTON, TX; Owner: MORTENSON BROADCASTING COMPANY)
- KTCK (1310 AM; 9 kW; DALLAS, TX; Owner: KRBE LICO, INC.)
Strongest FM radio stations in Eagle Mountain:
- KPLX (99.5 FM; FORT WORTH, TX; Owner: KPLX LICO, INC.)
- KRNB (105.7 FM; DECATUR, TX; Owner: SERVICE BROADCASTING I, LTD.)
- KLLI (105.3 FM; DALLAS, TX; Owner: INFINITY BROADCASTING CORPORATION OF DALLAS)
- KMEO (96.7 FM; FLOWER MOUND, TX; Owner: ABC, INC.)
- KKDL (106.7 FM; MUENSTER, TX; Owner: ENTRAVISION HOLDINGS, LLC)
- KZMP-FM (101.7 FM; AZLE, TX; Owner: ENTRAVISION HOLDINGS, LLC)
- KDKR (91.3 FM; DECATUR, TX; Owner: CSN INTERNATIONAL)
- KHCK-FM (99.1 FM; DENTON, TX; Owner: KHCK-FM LICENSE CORP.)
- KKDA-FM (104.5 FM; DALLAS, TX; Owner: SERVICE BROADCASTING I, LTD.)
- KZPS (92.5 FM; DALLAS, TX; Owner: AMFM TEXAS LICENSES LIMITED PARTNERSHIP)
- KHKS (106.1 FM; DENTON, TX; Owner: AMFM TEXAS LICENSES LIMITED PARTNERSHIP)
- KRBV (100.3 FM; DALLAS, TX; Owner: INFINITY BROADCASTING CORP. OF FORT WORTH)
- KVIL-FM (103.7 FM; HIGHLAND PARK-DALLAS, TX; Owner: INFINITY BROADCASTING CORPORATION OF TEXAS)
- KLUV-FM (98.7 FM; DALLAS, TX; Owner: INFINITY BROADCASTING CORPORATION OF DALLAS)
- KOAI (107.5 FM; FORT WORTH, TX; Owner: INFINITY KOAI-FM, INC.)
- KNOR (93.7 FM; HEALDTON, OK; Owner: AM & PM BROADCASTERS, LLC)
- KDXX (107.1 FM; BENBROOK, TX; Owner: KCYT-FM LICENSE CORP.)
- KEGL (97.1 FM; FORT WORTH, TX; Owner: CITICASTERS LICENSES, L.P.)
- KBFB (97.9 FM; DALLAS, TX; Owner: RADIO ONE LICENSES, LLC)
- KSCS (96.3 FM; FORT WORTH, TX; Owner: WBAP-KSCS OPERATING, LTD.)
TV broadcast stations around Eagle Mountain:
- KUVN-CA (Channel 31; FORT WORTH, TX; Owner: KUVN LICENSE PARTNERSHIP, L.P.)
- KFWD (Channel 52; FORT WORTH, TX; Owner: HIC BROADCAST, INC.)
- KXAS-TV (Channel 5; FORT WORTH, TX; Owner: STATION VENTURE OPERATIONS, LP)
- KTVT (Channel 11; FORT WORTH, TX; Owner: CBS STATIONS GROUP OF TEXAS L.P.)
- KDTN (Channel 2; DENTON, TX; Owner: NORTH TEXAS PUBLIC BROADCASTING, INC.)
- KLDT (Channel 55; LAKE DALLAS, TX; Owner: JOHNSON BROADCASTING OF DALLAS, INC.)
- KSTR-TV (Channel 49; IRVING, TX; Owner: TELEFUTURA DALLAS LLC)
- KPXD (Channel 68; ARLINGTON, TX; Owner: PAXSON DALLAS LICENSE, INC.)
- KUVN (Channel 23; GARLAND, TX; Owner: KUVN LICENSE PARTNERSHIP, L.P.)
- KTXA (Channel 21; FORT WORTH, TX; Owner: VIACOM TELEVISION STATIONS GROUP OF DALLAS/FORT WORTH L.P.)
- KMPX (Channel 29; DECATUR, TX; Owner: WORD OF GOD FELLOWSHIP, INC.)
- WFAA-TV (Channel 8; DALLAS, TX; Owner: WFAA-TV, L.P.)
- KDFW (Channel 4; DALLAS, TX; Owner: KDFW LICENSE, INC.)
- KDTX-TV (Channel 58; DALLAS, TX; Owner: TRINITY BROADCASTING OF TEXAS, INC.)
- KXTX-TV (Channel 39; DALLAS, TX; Owner: TELEMUNDO OF TEXAS PARTNERSHIP, LP)
- KERA-TV (Channel 13; DALLAS, TX; Owner: NORTH TEXAS PUBLIC BROADCASTING, INC.)
- KDAF (Channel 33; DALLAS, TX; Owner: TRIBUNE TELEVISION COMPANY)
- KDFI (Channel 27; DALLAS, TX; Owner: NEW DMIC, INC.)
- K26HF (Channel 26; BRITTON, TX; Owner: MAKO COMMUNICATIONS, LLC)
- KHPK-LP (Channel 28; DE SOTO, TX; Owner: MAKO COMMUNICATIONS, LLC)
- K25FW (Channel 25; CORSICANA, TX; Owner: VENTANA TELEVISION, INC.)
- KATA-LP (Channel 60; MESQUITE, TX; Owner: JANE McGINNIS)
- KLEG-LP (Channel 44; DALLAS, TX; Owner: DILIP VISWANATH)
- KVFW-LP (Channel 65; FORT WORTH, TX; Owner: GERALD BENAVIDES)
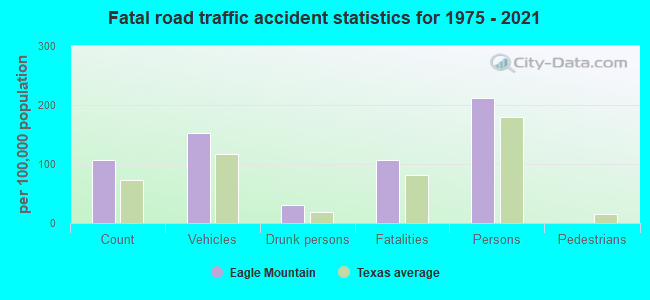
Eagle Mountain fatal accident list:
Feb 22, 2016 07:12 AM, Fm1220 Morris Dido Newark Rd, Lat: 32.919286, Lon: -97.469631, Vehicles: 1, Persons: 1, Fatalities: 1
Apr 15, 2016 05:31 PM, Fm1220 Morris Dido Newark Rd, West Bonds Ranch Rd, Lat: 32.915911, Lon: -97.468175, Vehicles: 2, Persons: 3, Fatalities: 1
May 5, 2015 06:28 PM, Cr-Boat Club Rd, Lat: 32.893869, Lon: -97.443950, Vehicles: 2, Persons: 3, Fatalities: 1
Aug 7, 2013 11:25 PM, Bonds Ranch Rd, Lat: 32.922717, Lon: -97.457581, Vehicles: 1, Persons: 1, Fatalities: 1, Drunk persons involved: 1
Sep 27, 2012 07:15 PM, Cr-Ten Mile Bridge, Lat: 32.856406, Lon: -97.464156, Vehicles: 2, Persons: 2, Fatalities: 1
Apr 14, 2008 09:20 PM, Tenmile, Lat: 32.849810, Lon: -97.448770, Vehicles: 1, Persons: 3, Fatalities: 1, Drunk persons involved: 1
- National Bridge Inventory (NBI) Statistics
- 1Number of bridges
- 30ft / 8.8mTotal length
- $15,000Total costs
- 4,940Total average daily traffic
- 247Total average daily truck traffic
- 6,120Total future (year 2030) average daily traffic
FCC Registered Microwave Towers:
1- LAGO VISTA, Bonds Ranch Road (Lat: 32.921611 Lon: -97.458694), Type: Upole, Structure height: 16.8 m, Overall height: 18.3 m, Call Sign: WQNP776,
Assigned Frequencies: 11345.0 MHz, 11345.0 MHz, 11345.0 MHz, 11345.0 MHz, Grant Date: 04/12/2011, Expiration Date: 04/12/2021, Cancellation Date: 06/12/2021, Certifier: B. Kent Blackwell, Registrant: Millenium Telcom, LLC Dba Onesource Communications, 4800 Keller Hicks Road, Keller, TX 76244, Phone: (817) 745-2013, Fax: (817) 745-3399
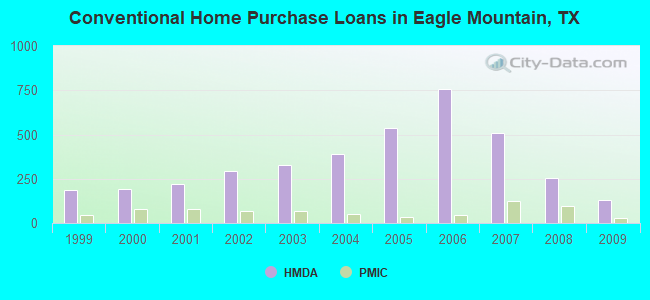
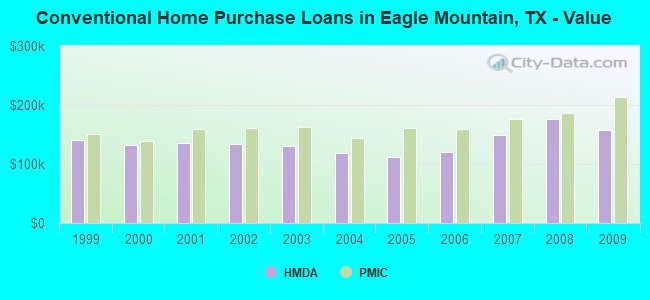
| Home Mortgage Disclosure Act Aggregated Statistics For Year 2009 (Based on 1 full and 3 partial tracts) | ||||||||||||
| A) FHA, FSA/RHS & VA Home Purchase Loans | B) Conventional Home Purchase Loans | C) Refinancings | D) Home Improvement Loans | F) Non-occupant Loans on < 5 Family Dwellings (A B C & D) | G) Loans On Manufactured Home Dwelling (A B C & D) | |||||||
|---|---|---|---|---|---|---|---|---|---|---|---|---|
| Number | Average Value | Number | Average Value | Number | Average Value | Number | Average Value | Number | Average Value | Number | Average Value | |
| LOANS ORIGINATED | 214 | $151,765 | 131 | $158,291 | 382 | $193,025 | 25 | $87,448 | 23 | $164,716 | 2 | $74,530 |
| APPLICATIONS APPROVED, NOT ACCEPTED | 11 | $149,677 | 13 | $279,005 | 35 | $186,170 | 3 | $33,173 | 5 | $493,732 | 0 | $0 |
| APPLICATIONS DENIED | 35 | $152,004 | 21 | $253,604 | 129 | $194,556 | 24 | $31,766 | 7 | $126,063 | 2 | $66,940 |
| APPLICATIONS WITHDRAWN | 29 | $149,824 | 16 | $213,382 | 106 | $177,372 | 4 | $67,378 | 5 | $222,262 | 0 | $0 |
| FILES CLOSED FOR INCOMPLETENESS | 5 | $156,704 | 5 | $169,484 | 20 | $180,374 | 2 | $57,090 | 2 | $100,940 | 0 | $0 |
Detailed HMDA statistics for the following Tracts: 1067.00 , 1140.01, 1141.01, 1141.02
| Private Mortgage Insurance Companies Aggregated Statistics For Year 2009 (Based on 1 full and 3 partial tracts) | ||||||
| A) Conventional Home Purchase Loans | B) Refinancings | C) Non-occupant Loans on < 5 Family Dwellings (A & B) | ||||
|---|---|---|---|---|---|---|
| Number | Average Value | Number | Average Value | Number | Average Value | |
| LOANS ORIGINATED | 27 | $212,809 | 19 | $186,414 | 0 | $0 |
| APPLICATIONS APPROVED, NOT ACCEPTED | 10 | $238,419 | 13 | $267,942 | 1 | $36,750 |
| APPLICATIONS DENIED | 3 | $179,867 | 4 | $258,152 | 0 | $0 |
| APPLICATIONS WITHDRAWN | 2 | $166,310 | 2 | $222,780 | 0 | $0 |
| FILES CLOSED FOR INCOMPLETENESS | 1 | $248,180 | 0 | $0 | 0 | $0 |
Detailed PMIC statistics for the following Tracts: 1067.00 , 1140.01, 1141.01, 1141.02
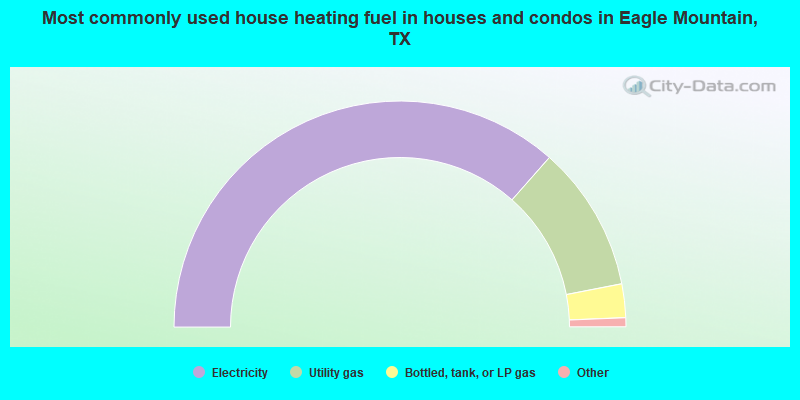
- 73.0%Electricity
- 20.9%Utility gas
- 4.8%Bottled, tank, or LP gas
- 0.5%Wood
- 0.4%Other fuel
- 0.4%Fuel oil, kerosene, etc.
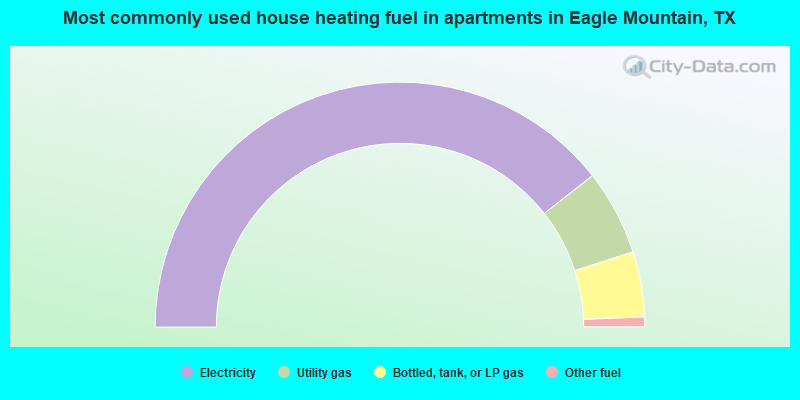
- 78.8%Electricity
- 11.3%Utility gas
- 8.6%Bottled, tank, or LP gas
- 1.3%Other fuel
Eagle Mountain compared to Texas state average:
- Median household income above state average.
- Median house value above state average.
- Unemployed percentage significantly below state average.
- Black race population percentage significantly below state average.
- Hispanic race population percentage significantly below state average.
- Median age significantly above state average.
- Foreign-born population percentage significantly below state average.
- Renting percentage significantly below state average.
- Length of stay since moving in significantly above state average.
- Number of rooms per house significantly below state average.
- House age significantly below state average.
- Percentage of population with a bachelor's degree or higher above state average.
Eagle Mountain on our top lists:
- #1 on the list of "Top 101 cities with largest percentage of females in industries: rail transportation (population 5,000+)"
- #1 on the list of "Top 101 cities with largest percentage of males in industries: air transportation (population 5,000+)"
- #2 on the list of "Top 101 cities with largest percentage of males in occupations: air transportation workers (population 5,000+)"
- #6 on the list of "Top 101 cities with largest percentage of females in occupations: rail and water transportation workers (population 5,000+)"
- #9 on the list of "Top 101 cities with largest percentage of males in industries: rail transportation (population 5,000+)"
- #11 on the list of "Top 101 cities with the smallest percentage of likely homosexual households (counted as self-reported same-sex unmarried-partner households) (population 5,000+)"
- #11 on the list of "Top 101 cities with largest percentage of females in industries: farm product raw materials merchant wholesalers (population 5,000+)"
- #11 on the list of "Top 101 cities with largest percentage of males in industries: petroleum and petroleum products merchant wholesalers (population 5,000+)"
- #14 on the list of "Top 101 cities with largest percentage of females in occupations: operations specialties managers except financial managers (population 5,000+)"
- #16 on the list of "Top 101 cities with largest percentage of males in industries: personal and laundry services (population 5,000+)"
- #17 on the list of "Top 101 cities with largest percentage of males in occupations: business operations specialists (population 5,000+)"
- #21 on the list of "Top 101 cities with largest percentage of females in occupations: religious workers (population 5,000+)"
- #24 on the list of "Top 101 cities with largest percentage of females in industries: paper (population 5,000+)"
- #27 on the list of "Top 101 cities with largest percentage of males in industries: radio, tv, and computer stores (population 5,000+)"
- #30 on the list of "Top 101 cities with largest percentage of males in industries: farm product raw materials merchant wholesalers (population 5,000+)"
- #32 on the list of "Top 101 cities with largest percentage of females in occupations: sales representatives, services, wholesale and manufacturing (population 5,000+)"
- #41 on the list of "Top 101 cities with largest percentage of males in industries: transportation equipment (population 5,000+)"
- #44 on the list of "Top 101 cities with largest percentage of females in industries: furniture and home furnishing merchant wholesalers (population 5,000+)"
- #45 on the list of "Top 101 cities with largest percentage of females in industries: sewing, needlework, and piece goods stores (population 5,000+)"
- #47 on the list of "Top 101 cities with largest percentage of females in industries: lumber and other construction materials merchant wholesalers (population 5,000+)"
- #4 on the list of "Top 101 counties with the most Evangelical Protestant adherents"
- #5 on the list of "Top 101 counties with the most Evangelical Protestant congregations"
- #7 on the list of "Top 101 counties with the most Mainline Protestant adherents"
- #13 on the list of "Top 101 counties with the most Black Protestant congregations"
- #28 on the list of "Top 101 counties with the most Black Protestant adherents"