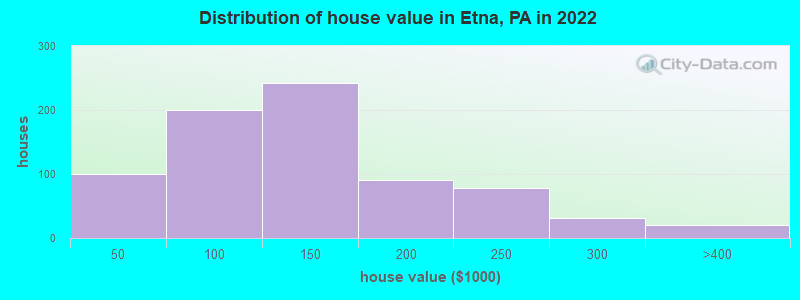
Estimated median house or condo value in 2022: $127,239 (it was $64,400 in 2000)
Etna:
$127,239
PA:
$245,500
Mean prices in 2022:all housing units: $266,371; detached houses: $267,242; townhouses or other attached units: $265,484; in 2-unit structures: $230,538; in 3-to-4-unit structures: $231,495; in 5-or-more-unit structures: $287,359; mobile homes: $84,841; occupied boats, rvs, vans, etc.: $316,945
Median gross rent in 2022: $847.
March 2022 cost of living index in Etna: 93.0 (less than average, U.S. average is 100)
Percentage of residents living in poverty in 2022: 15.3%
(15.1% for White Non-Hispanic residents, 20.5% for Hispanic or Latino residents, 63.0% for other race residents, 7.8% for two or more races residents)
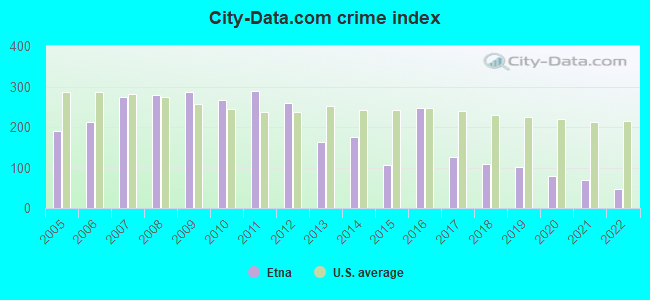
The City-Data.com crime index weighs serious crimes and violent crimes more heavily. Higher means more crime, U.S. average is 246.1. It adjusts for the number of visitors and daily workers commuting into cities.
Latest news from Etna, PA collected exclusively by city-data.com from local newspapers, TV, and radio stations
Ancestries: German (24.3%), Italian (18.5%), European (10.0%), American (7.9%), Irish (6.6%), Croatian (6.0%).
Current Local Time: EST time zone
Incorporated on 16/09/1868
Elevation: 743 feet
Land area: 0.75 square miles.
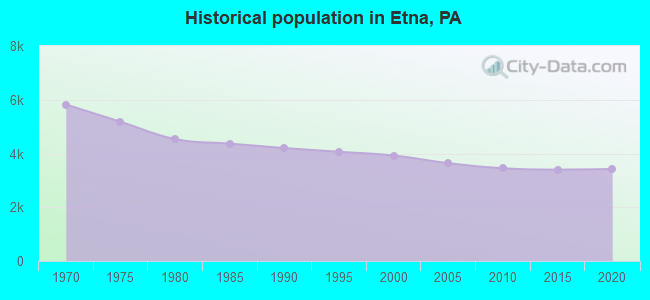
Population density: 4,483 people per square mile (average).
66 residents are foreign born
This borough:
2.0%
Pennsylvania:
7.3%
Median real estate property taxes paid for housing units with mortgages in 2022: $2,709 (2.0%) Median real estate property taxes paid for housing units with no mortgage in 2022: $1,099 (1.0%)
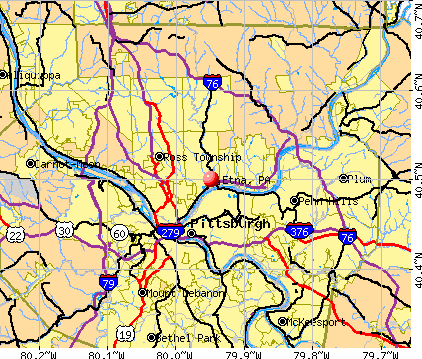
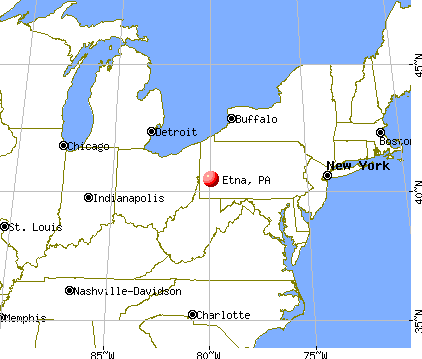
Nearest city with pop. 50,000+: Pittsburgh, PA (4.3 miles , pop. 334,563).
Nearest city with pop. 1,000,000+: Philadelphia, PA (255.9 miles , pop. 1,517,550).
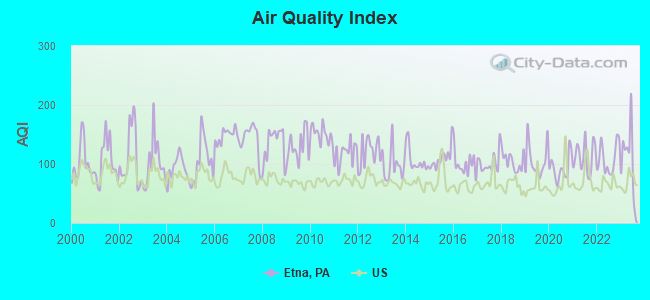
Air Quality Index (AQI) level in 2023 was 112. This is significantly worse than average.
City:
112
U.S.:
73
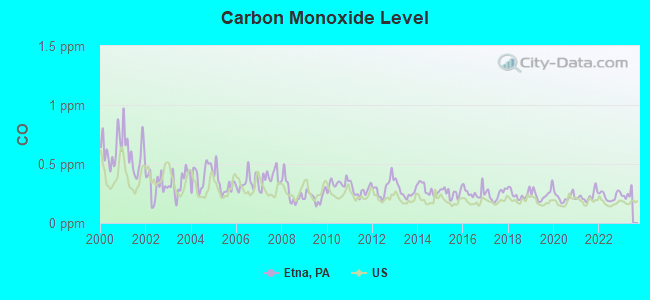
Carbon Monoxide (CO) [ppm] level in 2022 was 0.228. This is about average.Closest monitor was 2.5 miles away from the city center.
City:
0.228
U.S.:
0.251
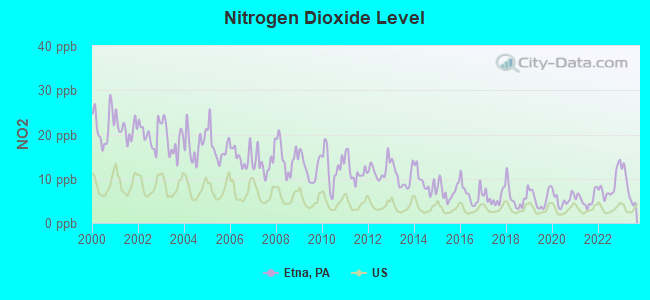
Nitrogen Dioxide (NO2) [ppb] level in 2023 was 8.08. This is significantly worse than average.Closest monitor was 2.4 miles away from the city center.
City:
8.08
U.S.:
5.11
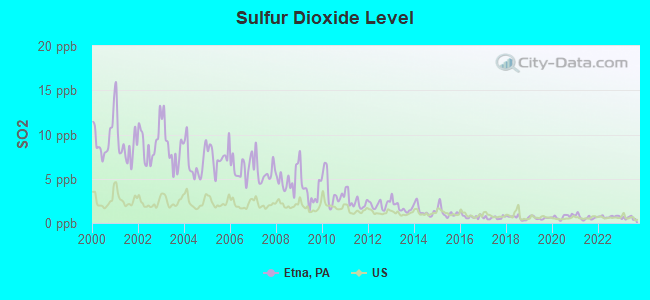
Sulfur Dioxide (SO2) [ppb] level in 2023 was 0.557. This is significantly better than average.Closest monitor was 2.5 miles away from the city center.
City:
0.557
U.S.:
1.515
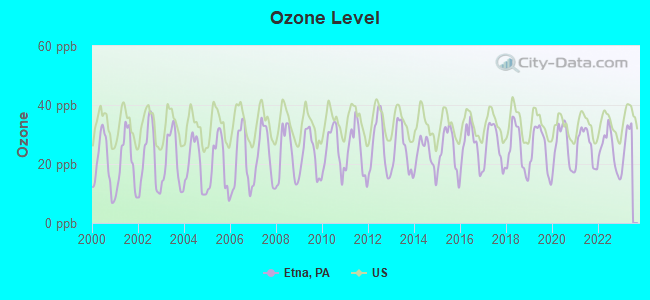
Ozone [ppb] level in 2022 was 24.8. This is better than average.Closest monitor was 2.5 miles away from the city center.
City:
24.8
U.S.:
33.3
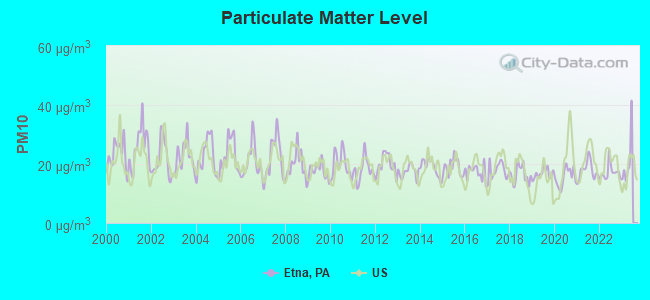
Particulate Matter (PM10) [µg/m3] level in 2022 was 17.1. This is about average.Closest monitor was 2.5 miles away from the city center.
City:
17.1
U.S.:
19.2
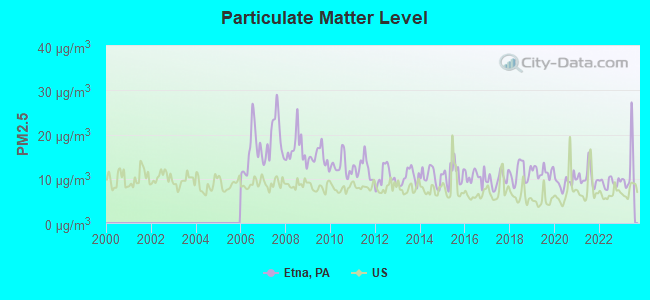
Particulate Matter (PM2.5) [µg/m3] level in 2023 was 12.2. This is significantly worse than average.Closest monitor was 2.5 miles away from the city center.
City:
12.2
U.S.:
8.1
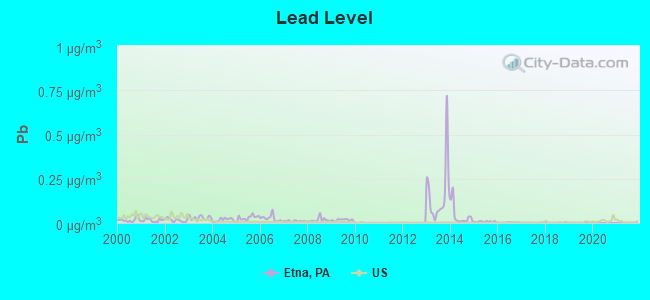
Lead (Pb) [µg/m3] level in 2016 was 0.00226. This is significantly better than average.Closest monitor was 3.8 miles away from the city center.
City:
0.00226
U.S.:
0.00931
Tornado activity:
Etna-area historical tornado activity is near Pennsylvania state average. It is 18% smaller than the overall U.S. average.
On 6/3/1980, a category F4 (max. wind speeds 207-260 mph) tornado 15.5 miles away from the Etna borough center injured 140 peopleand causedbetween $50,000,000 and $500,000,000 in damages.
On 8/3/1963, a category F3 (max. wind speeds 158-206 mph) tornado 13.0 miles away from the borough center killed 2 peopleand injured 70 peopleand causedbetween $5,000,000 and $50,000,000 in damages.
Earthquake activity:
Etna-area historical earthquake activity is significantly above Pennsylvania state average. It is 56% smaller than the overall U.S. average.
On 9/25/1998 at 19:52:52, a magnitude 5.2 (4.8 MB, 4.3 MS, 5.2 LG, 4.5 MW, Depth: 3.1 mi, Class: Moderate, Intensity: VI - VII) earthquake occurred 72.4 miles away from the city center On 8/23/2011 at 17:51:04, a magnitude 5.8 (5.8 MW, Depth: 3.7 mi) earthquake occurred 209.1 miles away from the city center On 1/31/1986 at 16:46:43, a magnitude 5.0 (5.0 MB) earthquake occurred 99.0 miles away from Etna center On 7/27/1980 at 18:52:21, a magnitude 5.2 (5.1 MB, 4.7 MS, 5.0 UK, 5.2 UK) earthquake occurred 266.1 miles away from the city center On 12/31/2011 at 20:05:01, a magnitude 4.0 (4.0 ML, Depth: 3.1 mi, Class: Light, Intensity: IV - V) earthquake occurred 57.7 miles away from the city center On 8/9/2020 at 12:07:37, a magnitude 5.1 (5.1 MW, Depth: 4.7 mi) earthquake occurred 285.2 miles away from the city center Magnitude types: regional Lg-wave magnitude (LG), body-wave magnitude (MB), local magnitude (ML), surface-wave magnitude (MS), moment magnitude (MW)
Natural disasters:
The number of natural disasters in Allegheny County (15) is near the US average (15). Major Disasters (Presidential) Declared: 12 Emergencies Declared: 3
Causes of natural disasters: Floods: 6, Storms: 6, Winter Storms: 3, Hurricanes: 2, Tornadoes: 2, Blizzard: 1, Snowfall: 1, Snowstorm: 1, Tropical Depression: 1, Tropical Storm: 1, Other: 1 (Note: some incidents may be assigned to more than one category).
Hospitals and medical centers near Etna:
FRESENIUS MEDICAL CARE SHALER (Dialysis Facility, about 1 miles away; PITTSBURGH, PA)
LANDMARK HOSPICE (Hospital, about 2 miles away; PITTSBURGH, PA)
VINCENTIAN DE MARILLAC (Nursing Home, about 3 miles away; PITTSBURGH, PA)
ST FRANCIS MEDICAL CENTER (Hospital, about 3 miles away; PITTSBURGH, PA)
ST FRANCIS MED CTR TCU (Nursing Home, about 3 miles away; PITTSBURGH, PA)
CANTERBURY PLACE (Nursing Home, about 3 miles away; PITTSBURGH, PA)
DAVITA - PITTSBURGH DIALYSIS (Dialysis Facility, about 3 miles away; PITTSBURGH, PA)
Amtrak station near Etna:
5 miles: PITTSBURGH (1100 LIBERTY AVE.) . Services: ticket office, fully wheelchair accessible, enclosed waiting area, public restrooms, public payphones, vending machines, ATM, free short-term parking, paid long-term parking, call for car rental service, call for taxi service, intercity bus service, public transit connection.
Colleges/universities with over 2000 students nearest to Etna:
Birthplace of: Jim Laslavic - Football player, John Abramovic - Basketball player, Lee Donaldson - Politician, Ralph Michaels - Baseball player, Vern Hughes (baseball) - Baseball player, Whitey Alperman - Baseball player.
Allegheny County has a predicted average indoor radon screening level greater than 4 pCi/L (pico curies per liter) - Highest Potential
Average household size:
This borough:
2.1 people
Pennsylvania:
2.5 people
Percentage of family households:
This borough:
53.8%
Whole state:
65.0%
Percentage of households with unmarried partners:
This borough:
8.3%
Whole state:
6.6%
Likely homosexual households (counted as self-reported same-sex unmarried-partner households)
Lesbian couples: 0.1% of all households
Gay men: 0.2% of all households
3 people in group homes intended for adults in 2010
40 people in nursing homes in 2000
2 people in religious group quarters in 2000
Banks with branches in Etna (2011 data):
PNC Bank, National Association: Etna Branch at 381 Butler Street, branch established on 1943/02/22. Info updated 2012/03/20: Bank assets: $263,309.6 mil, Deposits: $197,343.0 mil, headquarters in Wilmington, DE, positive income, Commercial Lending Specialization, 3085 total offices, Holding Company: Pnc Financial Services Group, Inc., The
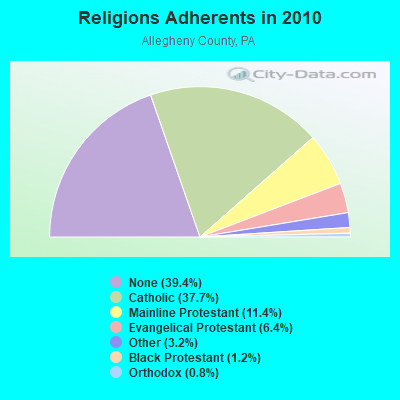
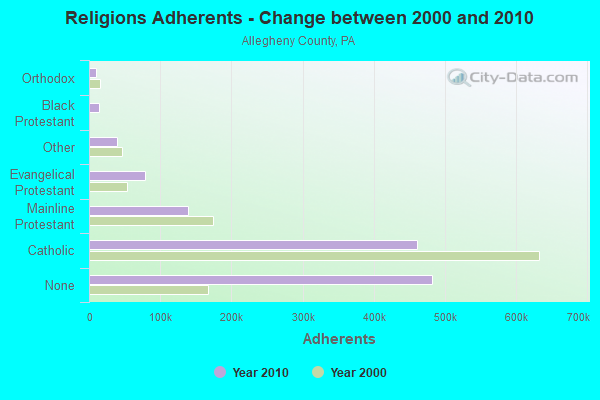
Religion statistics for Etna, PA (based on Allegheny County data)
Religion
Adherents
Congregations
Catholic
460,672
183
Mainline Protestant
139,551
414
Evangelical Protestant
78,101
349
Other
38,781
98
Black Protestant
14,268
75
Orthodox
9,606
29
None
482,369
-
Source: Clifford Grammich, Kirk Hadaway, Richard Houseal, Dale E.Jones, Alexei Krindatch, Richie Stanley and Richard H.Taylor. 2012. 2010 U.S.Religion Census: Religious Congregations & Membership Study. Association of Statisticians of American Religious Bodies. Jones, Dale E., et al. 2002. Congregations and Membership in the United States 2000. Nashville, TN: Glenmary Research Center. Graphs represent county-level data
Bottomfield St (Lat: 40.497194 Lon: -79.948889), Type: Tower, Structure height: 36.6 m, Overall height: 54.9 m, Call Sign: WQBT460, Assigned Frequencies: 1427.85 MHz, Grant Date: 09/18/2014, Expiration Date: 12/09/2024, Certifier: R J Green, Registrant: Dusquesne Light Company, 2839 New Beaver Avenue Mail Drop N2-Doc, Pittsburgh, PA 15233-1003, Phone: (412) 393-7100
2 Pine Street (Lat: 40.500000 Lon: -79.945000), Type: Pole, Structure height: 6.3 m, Overall height: 9.3 m, Call Sign: WQIH716, Assigned Frequencies: 1.67000 MHz, Grant Date: 02/09/2018, Expiration Date: 02/14/2028, Certifier: Peter Ramage, Registrant: Information Station Specialists, Zeeland, MI 49464, Phone: (616) 772-2300, Email:
FCC Registered Amateur Radio Licenses:
3
Call Sign: AA3QS, Previous Call Sign: N3TTM, Licensee ID: L01052903, Grant Date: 08/17/2005, Expiration Date: 08/17/2015, Cancellation Date: 08/18/2017, Certifier: Paul J Hohman, Registrant: Paul J Hohman, 84 Vilsack St, Etna, PA 15223
Call Sign: K3RKS, Licensee ID: L00142935, Grant Date: 07/15/2008, Expiration Date: 09/28/2018, Cancellation Date: 09/29/2020, Registrant: William R Popp, 112 Kay St, Etna, PA 15223
Call Sign: KC3VJZ, Licensee ID: L02613178, Grant Date: 01/10/2023, Expiration Date: 01/10/2033, Certifier: Jordan M Walthour, Registrant: Jordan Walthour, 179 Washington St, Etna, PA 15223-2051
Home Mortgage Disclosure Act Aggregated Statistics For Year 2009 (Based on 1 full tract)
A) FHA, FSA/RHS & VA Home Purchase Loans
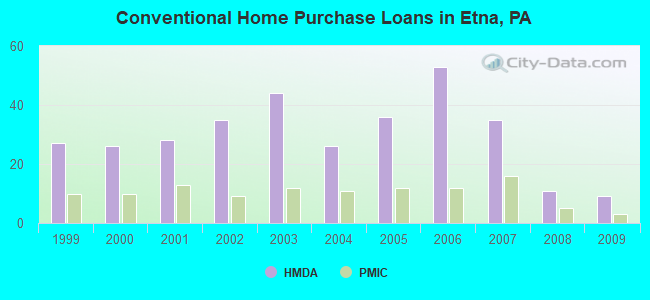
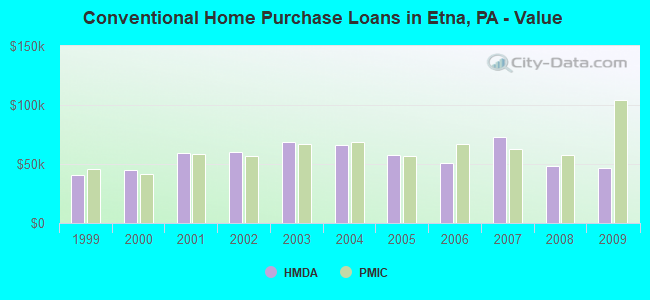
B) Conventional Home Purchase Loans
C) Refinancings
D) Home Improvement Loans
F) Non-occupant Loans on < 5 Family Dwellings (A B C & D)
Number
Average Value
Number
Average Value
Number
Average Value
Number
Average Value
Number
Average Value
LOANS ORIGINATED
15
$71,800
9
$46,333
28
$81,857
5
$38,400
3
$57,667
APPLICATIONS APPROVED, NOT ACCEPTED
0
$0
2
$59,500
4
$63,750
0
$0
1
$48,000
APPLICATIONS DENIED
5
$54,600
5
$108,200
23
$78,348
6
$16,333
1
$70,000
APPLICATIONS WITHDRAWN
4
$61,500
2
$47,500
7
$75,286
1
$30,000
0
$0
FILES CLOSED FOR INCOMPLETENESS
1
$54,000
0
$0
3
$82,667
0
$0
0
$0
Aggregated Statistics For Year 2008 (Based on 1 full tract)
A) FHA, FSA/RHS & VA Home Purchase Loans
B) Conventional Home Purchase Loans
C) Refinancings
D) Home Improvement Loans
F) Non-occupant Loans on < 5 Family Dwellings (A B C & D)
G) Loans On Manufactured Home Dwelling (A B C & D)
Number
Average Value
Number
Average Value
Number
Average Value
Number
Average Value
Number
Average Value
Number
Average Value
LOANS ORIGINATED
13
$62,538
11
$48,000
25
$66,600
3
$38,667
3
$38,000
0
$0
APPLICATIONS APPROVED, NOT ACCEPTED
1
$52,000
1
$71,000
2
$62,000
0
$0
1
$60,000
0
$0
APPLICATIONS DENIED
5
$79,400
7
$45,429
38
$74,158
10
$21,800
2
$44,500
1
$18,000
APPLICATIONS WITHDRAWN
0
$0
0
$0
11
$75,364
1
$5,000
1
$64,000
0
$0
FILES CLOSED FOR INCOMPLETENESS
0
$0
0
$0
1
$50,000
0
$0
0
$0
0
$0
Aggregated Statistics For Year 2007 (Based on 1 full tract)
A) FHA, FSA/RHS & VA Home Purchase Loans
B) Conventional Home Purchase Loans
C) Refinancings
D) Home Improvement Loans
F) Non-occupant Loans on < 5 Family Dwellings (A B C & D)
Number
Average Value
Number
Average Value
Number
Average Value
Number
Average Value
Number
Average Value
LOANS ORIGINATED
7
$71,857
35
$73,143
45
$70,644
10
$30,100
14
$69,643
APPLICATIONS APPROVED, NOT ACCEPTED
0
$0
3
$68,667
13
$56,385
3
$24,000
1
$46,000
APPLICATIONS DENIED
0
$0
8
$96,750
68
$66,500
30
$36,433
11
$71,545
APPLICATIONS WITHDRAWN
0
$0
8
$52,125
31
$84,968
2
$32,000
2
$48,000
FILES CLOSED FOR INCOMPLETENESS
0
$0
1
$120,000
3
$88,667
1
$50,000
0
$0
Aggregated Statistics For Year 2006 (Based on 1 full tract)
A) FHA, FSA/RHS & VA Home Purchase Loans
B) Conventional Home Purchase Loans
C) Refinancings
D) Home Improvement Loans
F) Non-occupant Loans on < 5 Family Dwellings (A B C & D)
Number
Average Value
Number
Average Value
Number
Average Value
Number
Average Value
Number
Average Value
LOANS ORIGINATED
7
$60,429
53
$50,830
62
$67,290
16
$12,562
15
$46,200
APPLICATIONS APPROVED, NOT ACCEPTED
0
$0
8
$44,750
10
$51,500
4
$22,250
2
$32,000
APPLICATIONS DENIED
0
$0
16
$56,812
62
$73,613
19
$31,053
5
$48,000
APPLICATIONS WITHDRAWN
0
$0
4
$58,000
24
$77,167
6
$59,667
0
$0
FILES CLOSED FOR INCOMPLETENESS
0
$0
1
$23,000
5
$94,000
0
$0
0
$0
Aggregated Statistics For Year 2005 (Based on 1 full tract)
A) FHA, FSA/RHS & VA Home Purchase Loans
B) Conventional Home Purchase Loans
C) Refinancings
D) Home Improvement Loans
E) Loans on Dwellings For 5+ Families
F) Non-occupant Loans on < 5 Family Dwellings (A B C & D)
Number
Average Value
Number
Average Value
Number
Average Value
Number
Average Value
Number
Average Value
Number
Average Value
LOANS ORIGINATED
8
$75,875
36
$57,861
57
$64,228
23
$25,652
0
$0
15
$49,933
APPLICATIONS APPROVED, NOT ACCEPTED
0
$0
3
$87,667
17
$72,529
8
$22,375
0
$0
3
$87,667
APPLICATIONS DENIED
0
$0
12
$67,833
72
$72,681
29
$28,207
2
$65,000
12
$29,500
APPLICATIONS WITHDRAWN
0
$0
4
$57,250
48
$81,646
7
$98,714
0
$0
2
$88,000
FILES CLOSED FOR INCOMPLETENESS
0
$0
3
$72,667
11
$100,000
0
$0
0
$0
5
$99,400
Aggregated Statistics For Year 2004 (Based on 1 full tract)
A) FHA, FSA/RHS & VA Home Purchase Loans
B) Conventional Home Purchase Loans
C) Refinancings
D) Home Improvement Loans
E) Loans on Dwellings For 5+ Families
F) Non-occupant Loans on < 5 Family Dwellings (A B C & D)
G) Loans On Manufactured Home Dwelling (A B C & D)
Number
Average Value
Number
Average Value
Number
Average Value
Number
Average Value
Number
Average Value
Number
Average Value
Number
Average Value
LOANS ORIGINATED
7
$66,714
26
$66,115
84
$62,964
31
$19,161
1
$122,000
22
$38,227
0
$0
APPLICATIONS APPROVED, NOT ACCEPTED
0
$0
6
$58,000
23
$52,826
6
$20,167
0
$0
3
$45,333
1
$64,000
APPLICATIONS DENIED
0
$0
10
$61,400
80
$80,562
17
$20,176
0
$0
16
$44,000
0
$0
APPLICATIONS WITHDRAWN
2
$83,500
3
$68,333
48
$75,021
1
$6,000
0
$0
1
$50,000
0
$0
FILES CLOSED FOR INCOMPLETENESS
0
$0
3
$78,333
23
$83,783
0
$0
0
$0
0
$0
0
$0
Aggregated Statistics For Year 2003 (Based on 1 full tract)
A) FHA, FSA/RHS & VA Home Purchase Loans
B) Conventional Home Purchase Loans
C) Refinancings
D) Home Improvement Loans
F) Non-occupant Loans on < 5 Family Dwellings (A B C & D)
Number
Average Value
Number
Average Value
Number
Average Value
Number
Average Value
Number
Average Value
LOANS ORIGINATED
8
$73,875
44
$68,773
113
$63,681
19
$25,053
17
$56,059
APPLICATIONS APPROVED, NOT ACCEPTED
1
$50,000
3
$67,000
26
$58,115
7
$36,857
2
$61,000
APPLICATIONS DENIED
0
$0
7
$62,571
75
$71,973
10
$25,000
10
$56,500
APPLICATIONS WITHDRAWN
1
$87,000
4
$64,250
27
$69,556
4
$36,500
3
$61,000
FILES CLOSED FOR INCOMPLETENESS
0
$0
0
$0
6
$78,500
1
$14,000
0
$0
Aggregated Statistics For Year 2002 (Based on 1 full tract)
A) FHA, FSA/RHS & VA Home Purchase Loans
B) Conventional Home Purchase Loans
C) Refinancings
D) Home Improvement Loans
E) Loans on Dwellings For 5+ Families
F) Non-occupant Loans on < 5 Family Dwellings (A B C & D)
Number
Average Value
Number
Average Value
Number
Average Value
Number
Average Value
Number
Average Value
Number
Average Value
LOANS ORIGINATED
7
$71,714
35
$59,943
86
$55,151
13
$20,846
0
$0
16
$67,188
APPLICATIONS APPROVED, NOT ACCEPTED
1
$24,000
2
$40,000
22
$53,636
4
$35,750
0
$0
4
$34,750
APPLICATIONS DENIED
0
$0
5
$48,800
56
$58,161
13
$8,769
0
$0
3
$46,333
APPLICATIONS WITHDRAWN
0
$0
4
$57,250
25
$56,440
4
$5,500
1
$250,000
2
$70,000
FILES CLOSED FOR INCOMPLETENESS
1
$44,000
2
$106,000
15
$69,467
0
$0
0
$0
2
$68,500
Aggregated Statistics For Year 2001 (Based on 1 full tract)
A) FHA, FSA/RHS & VA Home Purchase Loans
B) Conventional Home Purchase Loans
C) Refinancings
D) Home Improvement Loans
E) Loans on Dwellings For 5+ Families
F) Non-occupant Loans on < 5 Family Dwellings (A B C & D)
Number
Average Value
Number
Average Value
Number
Average Value
Number
Average Value
Number
Average Value
Number
Average Value
LOANS ORIGINATED
10
$64,400
28
$59,679
71
$53,493
17
$18,059
0
$0
9
$52,889
APPLICATIONS APPROVED, NOT ACCEPTED
1
$63,000
5
$31,600
20
$48,200
6
$20,000
0
$0
0
$0
APPLICATIONS DENIED
0
$0
6
$37,833
80
$55,575
16
$15,625
0
$0
2
$47,500
APPLICATIONS WITHDRAWN
3
$60,333
5
$44,200
36
$68,750
1
$75,000
1
$114,000
0
$0
FILES CLOSED FOR INCOMPLETENESS
0
$0
2
$95,000
12
$58,833
1
$7,000
0
$0
0
$0
Aggregated Statistics For Year 2000 (Based on 1 full tract)
A) FHA, FSA/RHS & VA Home Purchase Loans
B) Conventional Home Purchase Loans
C) Refinancings
D) Home Improvement Loans
E) Loans on Dwellings For 5+ Families
F) Non-occupant Loans on < 5 Family Dwellings (A B C & D)
Number
Average Value
Number
Average Value
Number
Average Value
Number
Average Value
Number
Average Value
Number
Average Value
LOANS ORIGINATED
14
$57,643
26
$45,154
43
$43,465
12
$15,500
0
$0
4
$33,000
APPLICATIONS APPROVED, NOT ACCEPTED
0
$0
2
$37,500
11
$45,818
2
$52,500
0
$0
0
$0
APPLICATIONS DENIED
1
$45,000
12
$44,833
47
$53,085
18
$14,889
0
$0
2
$37,500
APPLICATIONS WITHDRAWN
1
$49,000
3
$62,667
20
$53,350
7
$22,429
1
$100,000
1
$100,000
FILES CLOSED FOR INCOMPLETENESS
0
$0
1
$60,000
12
$55,500
0
$0
0
$0
0
$0
Aggregated Statistics For Year 1999 (Based on 1 full tract)
A) FHA, FSA/RHS & VA Home Purchase Loans
B) Conventional Home Purchase Loans
C) Refinancings
D) Home Improvement Loans
F) Non-occupant Loans on < 5 Family Dwellings (A B C & D)
Detailed PMIC statistics for the following Tracts:4250.00
2004 - 2018 National Fire Incident Reporting System (NFIRS) incidents
According to the data from the years 2004 - 2018 the average number of fire incidents per year is 12. The highest number of reported fire incidents - 62 took place in 2015, and the least - 0 in 2005. The data has an increasing trend.
When looking into fire subcategories, the most incidents belonged to: Structure Fires (71.4%), and Other (11.9%).


 Recent articles from our blog. Our writers, many of them Ph.D. graduates or candidates, create easy-to-read articles on a wide variety of topics.

 (4.3 miles


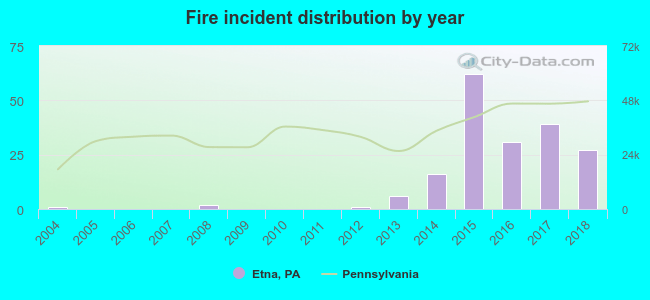 According to the data from the years 2004 - 2018 the average number of fire incidents per year is 12. The highest number of reported fire incidents - 62 took place in 2015, and the least - 0 in 2005. The data has an increasing trend.
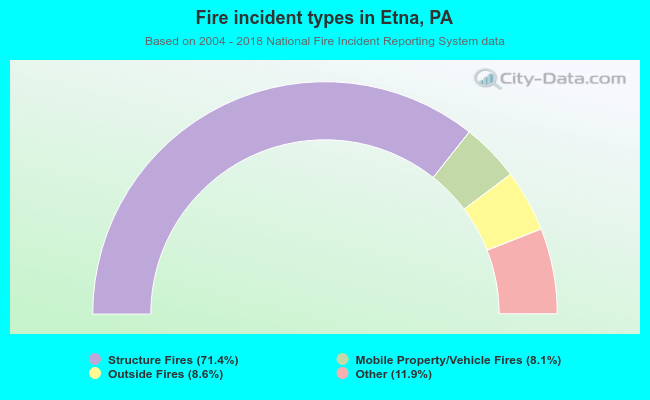 When looking into fire subcategories, the most incidents belonged to: Structure Fires (71.4%), and Other (11.9%).