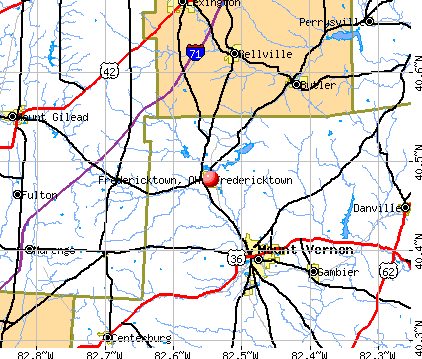
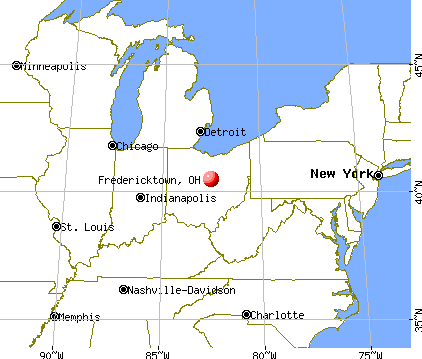
Fredericktown, Ohio
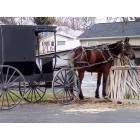
Fredericktown: Buggy and Horse waiting at the grocery store in the parking lot.
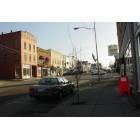
Fredericktown: Looking up Main Street
- add
your
Submit your own pictures of this village and show them to the world
- OSM Map
- General Map
- Google Map
- MSN Map
Population change since 2000: +8.6%
 |
| Males: 1,204 | |
| Females: 1,432 |
| Median resident age: | 41.6 years |
| Ohio median age: | 39.9 years |
Zip codes: 43019.
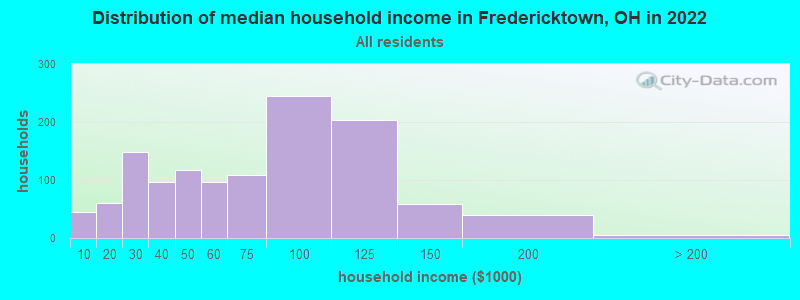
| Fredericktown: | $66,527 |
| OH: | $65,720 |
Estimated per capita income in 2022: $31,796 (it was $19,138 in 2000)
Fredericktown village income, earnings, and wages data
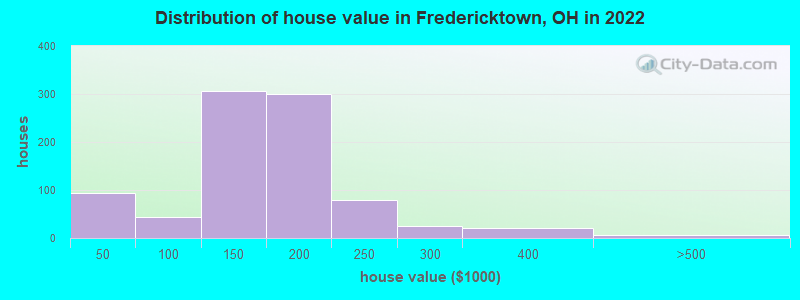
Estimated median house or condo value in 2022: $163,124 (it was $82,500 in 2000)
| Fredericktown: | $163,124 |
| OH: | $204,100 |
Mean prices in 2022: all housing units: $165,582; detached houses: $183,624; in 2-unit structures: $147,135; mobile homes: $16,629
Median gross rent in 2022: $782.
(11.1% for White Non-Hispanic residents, 100.0% for Black residents, 22.2% for two or more races residents)
Detailed information about poverty and poor residents in Fredericktown, OH
Compare current foreclosures near Fredericktown, OH:
| Photo | Address | Area | Beds / Baths | Price | Details |
|---|---|---|---|---|---|

|
#1
Mishey Rd
Fredericktown, OH 43019
|
1,128 sq. feet
|
1 baths 3 beds |
show details | |

|
#2
County Road 183
Fredericktown, OH 43019
|
1,497 sq. feet
|
1 baths 4 beds |
show details | |

|
#3
County Road 80
Fredericktown, OH 43019
|
2,052 sq. feet
|
2 baths 3 beds |
show details | |

|
#4
Smith Rd
Fredericktown, OH 43019
|
788 sq. feet
|
1 baths 2 beds |
show details | |

|
#5
S Portland St
Fredericktown, OH 43019
|
2,004 sq. feet
|
1 baths 3 beds |
show details | |

|
#6
Yankee St
Fredericktown, OH 43019
|
- sq. feet
|
- baths - beds |
show details | |

|
#7
Mcvay Rd
Fredericktown, OH 43019
|
- sq. feet
|
- baths - beds |
show details | |

|
#8
Cassell Rd
Fredericktown, OH 43019
|
- sq. feet
|
- baths - beds |
show details | |

|
#9
State Route 13
Bellville, OH 44813
|
1,300 sq. feet
|
1 baths 3 beds |
show details | |

|
#10
Lincoln Ave
Mount Gilead, OH 43338
|
1,580 sq. feet
|
1 baths 3 beds |
show details |
| Photo | Address | Area | Beds / Baths | Price | Details |
|---|---|---|---|---|---|

|
#11
Granville Rd
Mount Vernon, OH 43050
|
900 sq. feet
|
1 baths 2 beds |
show details | |

|
#12
Township Road 14
Mount Gilead, OH 43338
|
2,391 sq. feet
|
1 baths 4 beds |
show details | |

|
#13
Courtland Dr
Howard, OH 43028
|
1,804 sq. feet
|
2 baths 3 beds |
show details | |

|
#14
Brooklawn Dr
Howard, OH 43028
|
988 sq. feet
|
2 baths 2 beds |
show details | |

|
#15
Graham Rd
Mansfield, OH 44904
|
2,392 sq. feet
|
1 baths 3 beds |
show details | |

|
#16
Greenbriar Cir
Howard, OH 43028
|
1,290 sq. feet
|
2 baths 3 beds |
show details | |

|
#17
County Road 109
Mount Gilead, OH 43338
|
2,016 sq. feet
|
2 baths 3 beds |
show details | |

|
#18
State Route 95
Mount Gilead, OH 43338
|
2,500 sq. feet
|
1 baths 4 beds |
show details | |

|
#19
County Road 24
Mount Gilead, OH 43338
|
1,008 sq. feet
|
1 baths 3 beds |
show details | |

|
#20
Carter Dr
Mansfield, OH 44906
|
960 sq. feet
|
2 baths 3 beds |
show details |
| Photo | Address | Area | Beds / Baths | Price | Details |
|---|---|---|---|---|---|

|
#21
Dirlam Ln
Mansfield, OH 44904
|
1,748 sq. feet
|
1 baths 3 beds |
show details | |

|
#22
Northern Spy Dr
Howard, OH 43028
|
1,500 sq. feet
|
2 baths 3 beds |
show details | |

|
#23
E Hanley Rd
Mansfield, OH 44903
|
1,158 sq. feet
|
1 baths 3 beds |
show details | |

|
#24
Clearview Dr
Mansfield, OH 44904
|
2,268 sq. feet
|
1 baths 3 beds |
show details | |

|
#25
County Road 15
Centerburg, OH 43011
|
1,152 sq. feet
|
1 baths 3 beds |
show details | |

|
#26
Possum Run Rd
Bellville, OH 44813
|
1,418 sq. feet
|
1 baths 3 beds |
show details | |

|
#27
Township Road 206
Marengo, OH 43334
|
1,836 sq. feet
|
2 baths 3 beds |
show details | |

|
#28
Karlson Dr
Mansfield, OH 44904
|
2,026 sq. feet
|
1 baths 4 beds |
show details | |

|
#29
County Road 15
Centerburg, OH 43011
|
1,008 sq. feet
|
1 baths 2 beds |
show details | |

|
#30
Coshocton Rd
Howard, OH 43028
|
1,840 sq. feet
|
2 baths 3 beds |
show details |
| Photo | Address | Area | Beds / Baths | Price | Details |
|---|---|---|---|---|---|

|
#31
Valley Hi Dr
Mansfield, OH 44904
|
1,232 sq. feet
|
1 baths 3 beds |
show details | |

|
#32
State Route 61
Marengo, OH 43334
|
1,512 sq. feet
|
1 baths 3 beds |
show details | |

|
#33
Highridge Rd
Mansfield, OH 44904
|
2,250 sq. feet
|
2 baths 4 beds |
show details | |

|
#34
Township Road 21
Marengo, OH 43334
|
1,092 sq. feet
|
1 baths 3 beds |
show details | |

|
#35
W Main St
Mansfield, OH 44904
|
1,574 sq. feet
|
2 baths 3 beds |
show details | |

|
#36
Tamiami Ter
Mansfield, OH 44904
|
999 sq. feet
|
1 baths 3 beds |
show details | |

|
#37
Mayfair Rd
Mansfield, OH 44904
|
2,160 sq. feet
|
3 baths 4 beds |
show details | |

|
#38
Chapman Way
Mansfield, OH 44904
|
1,160 sq. feet
|
2 baths 2 beds |
show details | |

|
#39
Delano St
Mount Vernon, OH 43050
|
1,132 sq. feet
|
1 baths 3 beds |
show details | |

|
#40
S Edgewood Rd
Mount Vernon, OH 43050
|
1,188 sq. feet
|
1 baths 3 beds |
show details |
| Photo | Address | Area | Beds / Baths | Price | Details |
|---|---|---|---|---|---|

|
#41
Lexington Ave
Mansfield, OH 44904
|
1,149 sq. feet
|
1 baths 2 beds |
show details | |

|
#42
Northgate Dr
Mount Vernon, OH 43050
|
960 sq. feet
|
1 baths 2 beds |
show details | |

|
#43
Orchard Dr
Mount Gilead, OH 43338
|
2,284 sq. feet
|
2 baths 3 beds |
show details | |

|
#44
Belmont Ave
Mount Vernon, OH 43050
|
840 sq. feet
|
1 baths 2 beds |
show details | |

|
#45
Belvedere Dr
Mount Vernon, OH 43050
|
1,272 sq. feet
|
1 baths 3 beds |
show details | |

|
#46
Proper Rd
Mount Vernon, OH 43050
|
1,472 sq. feet
|
1 baths 2 beds |
show details | |

|
#47
Mansfield Ave
Mount Vernon, OH 43050
|
1,304 sq. feet
|
1 baths 3 beds |
show details | |

|
#48
Wooster Rd
Mount Vernon, OH 43050
|
2,196 sq. feet
|
2 baths 4 beds |
show details | |

|
#49
Mansfield Ave
Mount Vernon, OH 43050
|
1,440 sq. feet
|
1 baths 2 beds |
show details | |

|
Check over 1 million property listings on Foreclosure.com!
|
browse all offers | |||


- 2,53296.0%White alone
- 672.5%Two or more races
- 80.3%Black alone
- 50.2%American Indian alone
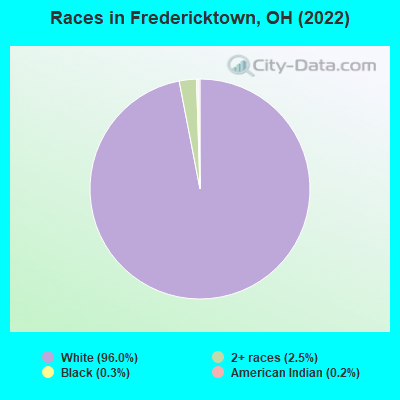
Races in Fredericktown detailed stats: ancestries, foreign born residents, place of birth
According to our research of Ohio and other state lists, there were 12 registered sex offenders living in Fredericktown, Ohio as of April 24, 2024.
The ratio of all residents to sex offenders in Fredericktown is 258 to 1.
Type |
2009 |
2010 |
2011 |
2012 |
2013 |
2014 |
2015 |
2016 |
2017 |
2018 |
2019 |
2020 |
2021 |
2022 |
|---|---|---|---|---|---|---|---|---|---|---|---|---|---|---|
| Murders (per 100,000) | 0 (0.0) | 0 (0.0) | 0 (0.0) | 0 (0.0) | 0 (0.0) | 0 (0.0) | 0 (0.0) | 0 (0.0) | 0 (0.0) | 0 (0.0) | 0 (0.0) | 0 (0.0) | 0 (0.0) | 0 (0.0) |
| Rapes (per 100,000) | 0 (0.0) | 1 (40.1) | 0 (0.0) | 2 (79.7) | 0 (0.0) | 0 (0.0) | 1 (40.0) | 2 (80.5) | 0 (0.0) | 0 (0.0) | 1 (39.7) | 1 (39.6) | 0 (0.0) | 0 (0.0) |
| Robberies (per 100,000) | 0 (0.0) | 0 (0.0) | 1 (40.1) | 0 (0.0) | 0 (0.0) | 0 (0.0) | 0 (0.0) | 0 (0.0) | 0 (0.0) | 0 (0.0) | 0 (0.0) | 0 (0.0) | 0 (0.0) | 0 (0.0) |
| Assaults (per 100,000) | 1 (40.3) | 0 (0.0) | 0 (0.0) | 0 (0.0) | 0 (0.0) | 2 (80.7) | 3 (119.9) | 4 (160.9) | 4 (162.5) | 1 (40.0) | 4 (158.9) | 3 (118.7) | 0 (0.0) | 0 (0.0) |
| Burglaries (per 100,000) | 16 (645.2) | 13 (521.5) | 15 (601.2) | 18 (717.7) | 9 (364.5) | 15 (605.3) | 14 (559.6) | 11 (442.5) | 12 (487.6) | 9 (360.3) | 4 (158.9) | 3 (118.7) | 1 (39.5) | 3 (113.5) |
| Thefts (per 100,000) | 46 (1,855) | 54 (2,166) | 54 (2,164) | 45 (1,794) | 42 (1,701) | 45 (1,816) | 54 (2,158) | 29 (1,167) | 44 (1,788) | 27 (1,081) | 15 (595.9) | 6 (237.3) | 12 (474.5) | 21 (794.6) |
| Auto thefts (per 100,000) | 1 (40.3) | 5 (200.6) | 0 (0.0) | 0 (0.0) | 1 (40.5) | 0 (0.0) | 1 (40.0) | 1 (40.2) | 0 (0.0) | 0 (0.0) | 1 (39.7) | 0 (0.0) | 0 (0.0) | 0 (0.0) |
| Arson (per 100,000) | 1 (40.3) | 0 (0.0) | 0 (0.0) | 0 (0.0) | 0 (0.0) | 0 (0.0) | 1 (40.0) | 0 (0.0) | 0 (0.0) | 0 (0.0) | 0 (0.0) | 0 (0.0) | 0 (0.0) | 0 (0.0) |
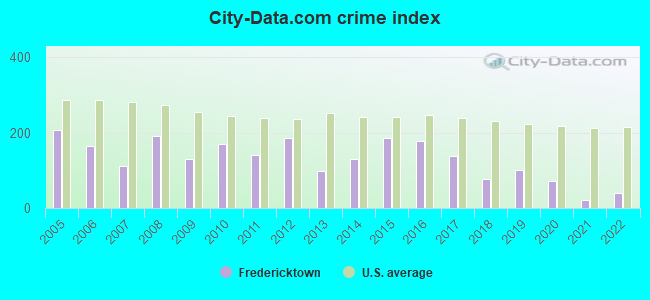
| City-Data.com crime index | 130.6 | 171.3 | 140.7 | 185.8 | 96.8 | 131.2 | 184.7 | 177.4 | 138.2 | 76.5 | 101.7 | 73.2 | 21.7 | 39.7 |
The City-Data.com crime index weighs serious crimes and violent crimes more heavily. Higher means more crime, U.S. average is 246.1. It adjusts for the number of visitors and daily workers commuting into cities.
Crime rate in Fredericktown detailed stats: murders, rapes, robberies, assaults, burglaries, thefts, arson
Full-time law enforcement employees in 2015, including police officers: 5 (5 officers - 5 male; 0 female).
| Officers per 1,000 residents here: | 2.00 |
| Ohio average: | 2.00 |
 Recent articles from our blog. Our writers, many of them Ph.D. graduates or candidates, create easy-to-read articles on a wide variety of topics.


Latest news from Fredericktown, OH collected exclusively by city-data.com from local newspapers, TV, and radio stations
Ancestries: American (24.6%), German (20.1%), English (15.6%), Irish (13.6%), Belgian (3.4%), European (3.0%).
Current Local Time: EST time zone
Land area: 1.41 square miles.
Population density: 1,867 people per square mile (low).
14 residents are foreign born
| This village: | 0.5% |
| Ohio: | 4.9% |
Median real estate property taxes paid for housing units with mortgages in 2022: $1,810 (1.1%)
Median real estate property taxes paid for housing units with no mortgage in 2022: $1,526 (1.0%)
Nearest city with pop. 50,000+: Columbus, OH  (41.3 miles , pop. 711,470).
Nearest city with pop. 1,000,000+: Chicago, IL (283.4 miles , pop. 2,896,016).
Nearest cities:
), )Latitude: 40.48 N, Longitude: 82.55 W
Area code: 740
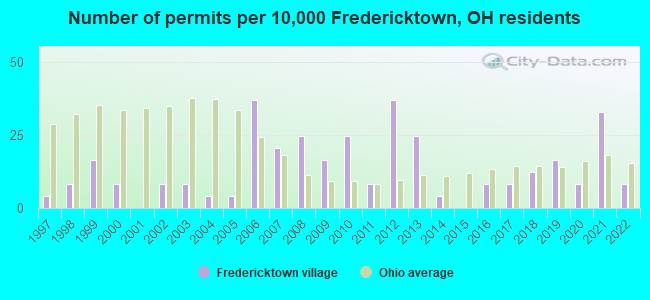
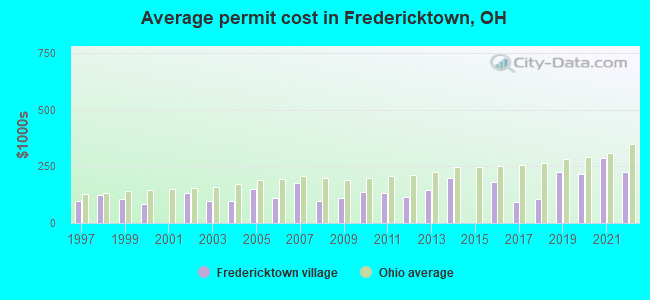
Single-family new house construction building permits:
- 2022: 2 buildings, average cost: $225,000
- 2021: 8 buildings, average cost: $286,000
- 2020: 2 buildings, average cost: $213,500
- 2019: 4 buildings, average cost: $226,800
- 2018: 3 buildings, average cost: $103,700
- 2017: 2 buildings, average cost: $92,500
- 2016: 2 buildings, average cost: $181,500
- 2014: 1 building, cost: $196,800
- 2013: 6 buildings, average cost: $143,700
- 2012: 9 buildings, average cost: $112,900
- 2011: 2 buildings, average cost: $130,500
- 2010: 6 buildings, average cost: $137,300
- 2009: 4 buildings, average cost: $111,300
- 2008: 6 buildings, average cost: $99,200
- 2007: 5 buildings, average cost: $177,800
- 2006: 9 buildings, average cost: $110,700
- 2005: 1 building, cost: $150,000
- 2004: 1 building, cost: $97,500
- 2003: 2 buildings, average cost: $97,500
- 2002: 2 buildings, average cost: $132,500
- 2000: 2 buildings, average cost: $84,300
- 1999: 4 buildings, average cost: $106,400
- 1998: 2 buildings, average cost: $123,500
- 1997: 1 building, cost: $95,000
| Here: | 2.8% |
| Ohio: | 3.1% |
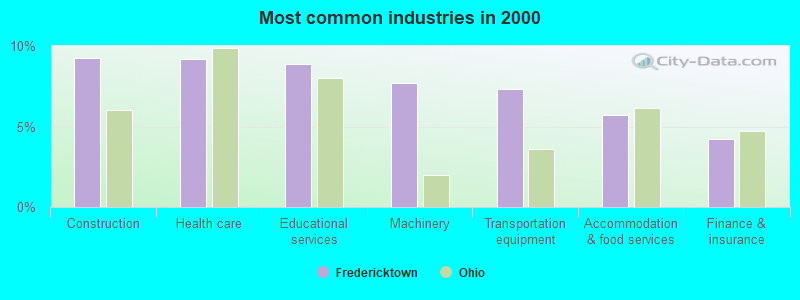
- Construction (9.3%)
- Health care (9.2%)
- Educational services (8.9%)
- Machinery (7.7%)
- Transportation equipment (7.3%)
- Accommodation & food services (5.7%)
- Finance & insurance (4.2%)
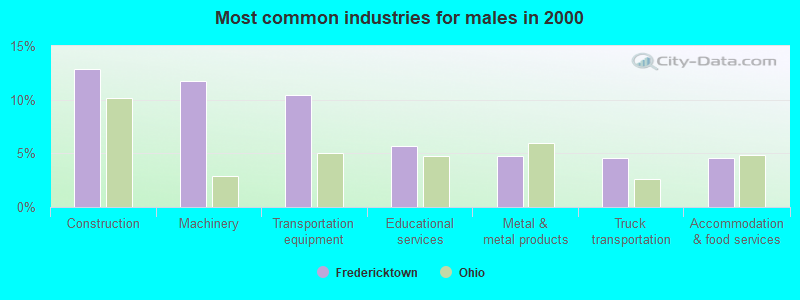
- Construction (12.8%)
- Machinery (11.8%)
- Transportation equipment (10.4%)
- Educational services (5.7%)
- Metal & metal products (4.7%)
- Truck transportation (4.6%)
- Accommodation & food services (4.6%)
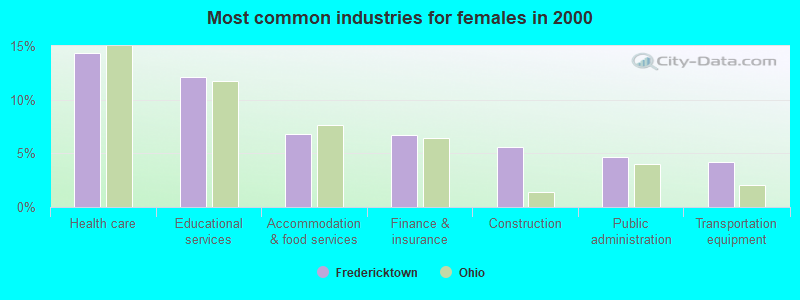
- Health care (14.3%)
- Educational services (12.1%)
- Accommodation & food services (6.8%)
- Finance & insurance (6.7%)
- Construction (5.6%)
- Public administration (4.7%)
- Transportation equipment (4.2%)
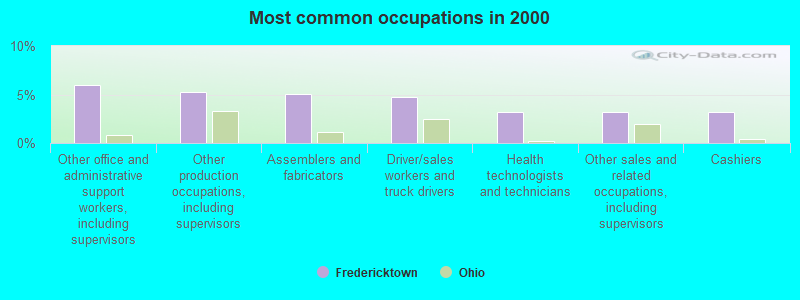
- Other office and administrative support workers, including supervisors (6.0%)
- Other production occupations, including supervisors (5.2%)
- Assemblers and fabricators (5.1%)
- Driver/sales workers and truck drivers (4.8%)
- Health technologists and technicians (3.2%)
- Other sales and related occupations, including supervisors (3.2%)
- Cashiers (3.2%)
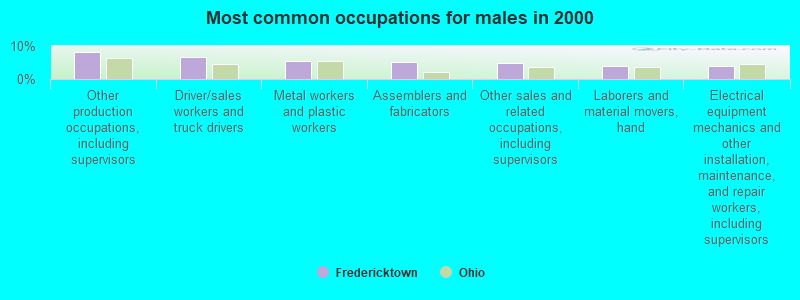
- Other production occupations, including supervisors (8.3%)
- Driver/sales workers and truck drivers (6.7%)
- Metal workers and plastic workers (5.5%)
- Assemblers and fabricators (5.2%)
- Other sales and related occupations, including supervisors (4.9%)
- Laborers and material movers, hand (3.8%)
- Electrical equipment mechanics and other installation, maintenance, and repair workers, including supervisors (3.8%)
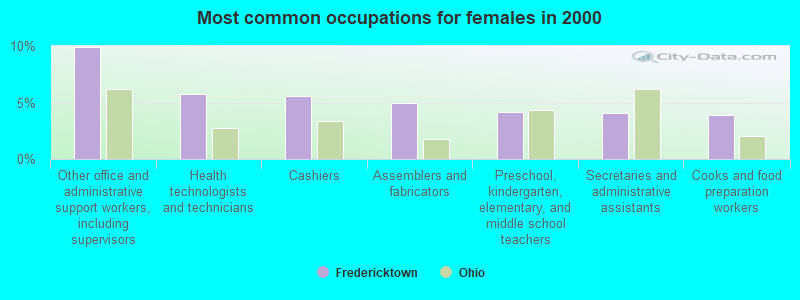
- Other office and administrative support workers, including supervisors (10.0%)
- Health technologists and technicians (5.8%)
- Cashiers (5.6%)
- Assemblers and fabricators (5.0%)
- Preschool, kindergarten, elementary, and middle school teachers (4.2%)
- Secretaries and administrative assistants (4.0%)
- Cooks and food preparation workers (3.9%)
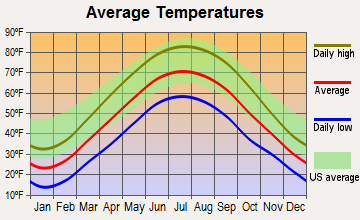
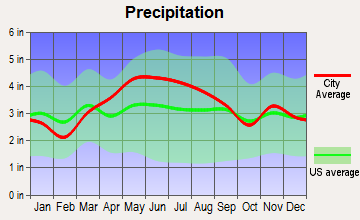
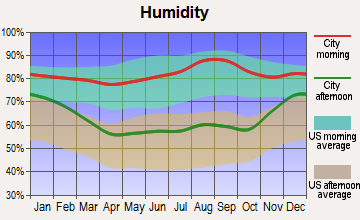
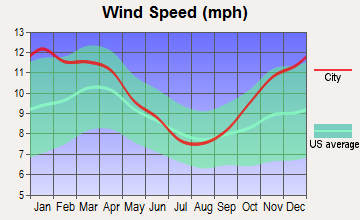
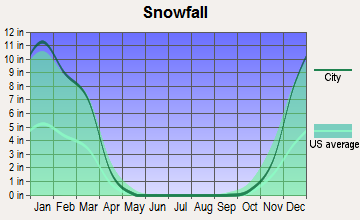
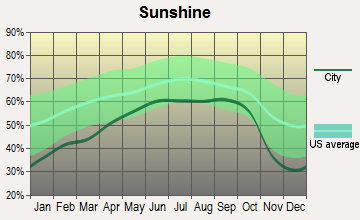
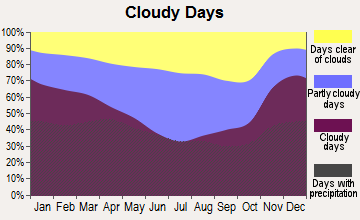
Average climate in Fredericktown, Ohio
Based on data reported by over 4,000 weather stations
|
|


Tornado activity:
Fredericktown-area historical tornado activity is near Ohio state average. It is 22% greater than the overall U.S. average.
On 6/13/1981, a category F3 (max. wind speeds 158-206 mph) tornado 16.7 miles away from the Fredericktown village center killed 4 people and injured 56 people and caused between $5,000,000 and $50,000,000 in damages.
On 5/31/1985, a category F3 tornado 23.3 miles away from the village center killed one person and injured 20 people and caused between $5,000,000 and $50,000,000 in damages.
Earthquake activity:
Fredericktown-area historical earthquake activity is significantly above Ohio state average. It is 31% smaller than the overall U.S. average.On 9/25/1998 at 19:52:52, a magnitude 5.2 (4.8 MB, 4.3 MS, 5.2 LG, 4.5 MW, Depth: 3.1 mi, Class: Moderate, Intensity: VI - VII) earthquake occurred 132.2 miles away from Fredericktown center
On 1/31/1986 at 16:46:43, a magnitude 5.0 (5.0 MB) earthquake occurred 106.0 miles away from the city center
On 7/27/1980 at 18:52:21, a magnitude 5.2 (5.1 MB, 4.7 MS, 5.0 UK, 5.2 UK) earthquake occurred 174.2 miles away from Fredericktown center
On 8/23/2011 at 17:51:04, a magnitude 5.8 (5.8 MW, Depth: 3.7 mi) earthquake occurred 304.3 miles away from the city center
On 7/12/1986 at 08:19:37, a magnitude 4.5 (4.5 MB, Class: Light, Intensity: IV - V) earthquake occurred 96.1 miles away from Fredericktown center
On 4/18/2008 at 09:36:59, a magnitude 5.4 (5.1 MB, 4.8 MS, 5.4 MW, 5.2 MW) earthquake occurred 317.7 miles away from the city center
Magnitude types: regional Lg-wave magnitude (LG), body-wave magnitude (MB), surface-wave magnitude (MS), moment magnitude (MW)
Natural disasters:
The number of natural disasters in Knox County (10) is smaller than the US average (15).Major Disasters (Presidential) Declared: 5
Emergencies Declared: 4
Causes of natural disasters: Storms: 4, Floods: 3, Snowstorms: 2, Winds: 2, Blizzard: 1, Hurricane: 1, Mudslide: 1, Power Outage: 1, Tornado: 1, Tropical Depression: 1, Winter Storm: 1, Other: 1 (Note: some incidents may be assigned to more than one category).
Hospitals and medical centers in Fredericktown:
Other hospitals and medical centers near Fredericktown:
- LAURELS OF MT VERNON THE (Nursing Home, about 7 miles away; MOUNT VERNON, OH)
- WHISPERING HILLS CARE CENTER (Nursing Home, about 7 miles away; MOUNT VERNON, OH)
- STAR HOME HEALTH SERVICES (Home Health Center, about 7 miles away; MOUNT VERNON, OH)
- OHIO EASTERN STAR HLTH CARE CTR THE (Nursing Home, about 7 miles away; MOUNT VERNON, OH)
- MT VERNON DEVELOPMENTAL CENTER (Hospital, about 7 miles away; MOUNT VERNON, OH)
- ROSE GARDEN NURSING HOME (Nursing Home, about 7 miles away; MOUNT VERNON, OH)
- HOSPICE OF KNOX COUNTY (Hospital, about 7 miles away; MOUNT VERNON, OH)
Heliports located in Fredericktown:
Colleges/universities with over 2000 students nearest to Fredericktown:
- Denison University (about 29 miles; Granville, OH; Full-time enrollment: 2,268)
- Central Ohio Technical College (about 29 miles; Newark, OH; FT enrollment: 2,995)
- Ashland University (about 29 miles; Ashland, OH; FT enrollment: 5,151)
- Ohio State University-Newark Campus (about 29 miles; Newark, OH; FT enrollment: 2,028)
- Otterbein University (about 33 miles; Westerville, OH; FT enrollment: 2,933)
- The College of Wooster (about 40 miles; Wooster, OH; FT enrollment: 2,112)
- Ohio Dominican University (about 40 miles; Columbus, OH; FT enrollment: 2,045)
Public high school in Fredericktown:
- FREDERICKTOWN HIGH SCHOOL (Students: 368, Location: 111 STADIUM DR, Grades: 9-12)
Public elementary/middle schools in Fredericktown:
- FREDERICKTOWN ELEMENTARY SCHOOL (Students: 509, Location: 111 STADIUM DRIVE, Grades: KG-5)
- FREDERICKTOWN MIDDLE SCHOOL (Students: 252, Location: 111 STADIUM DR, Grades: 6-8)
Points of interest:
Notable locations in Fredericktown: Fredericktown Community Joint Emergency Ambulance District (A), Fredericktown Community Fire District (B), Fredericktown Public Library (C). Display/hide their locations on the map
Churches in Fredericktown include: Fredericktown Presbyterian Church (A), Fredericktown United Methodist Church (B), Fredericktown Church of the Nazarene (C), First Church of God (D), First Baptist Church (E). Display/hide their locations on the map
Cemeteries: Boyd Cemetery (1), Forest Cemetery (2), Old Fredericktown Cemetery (3). Display/hide their locations on the map
Birthplace of: Clarence Dill - Politician.
Drinking water stations with addresses in Fredericktown and their reported violations in the past:
NEW LIFE COMMUNITY CHURCH (Population served: 202, Groundwater):Past health violations:PALMYRA CHURCH OF CHRIST PWS (Population served: 150, Groundwater):
- MCL, Monthly (TCR) - Between JUL-2013 and SEP-2013, Contaminant: Coliform. Follow-up actions: St Public Notif requested (JUL-18-2013), St Violation/Reminder Notice (JUL-18-2013), St Public Notif received (JUL-29-2013), St Compliance achieved (NOV-08-2013)
- MCL, Monthly (TCR) - Between OCT-2007 and DEC-2007, Contaminant: Coliform. Follow-up actions: St Public Notif requested (JAN-07-2008), St Violation/Reminder Notice (JAN-07-2008), St Public Notif received (MAR-06-2008), St Compliance achieved (NOV-13-2008)
Past monitoring violations:
- One routine major monitoring violation
Drinking water stations with addresses in Fredericktown that have no violations reported:
- FREDERICKTOWN VILLAGE (Population served: 2,493, Primary Water Source Type: Groundwater)
- PENIEL BIBLE CAMP PWS (Population served: 100, Primary Water Source Type: Groundwater)
- MEADE CONSTRUCTION INC PWS (Population served: 33, Primary Water Source Type: Groundwater)
| This village: | 2.4 people |
| Ohio: | 2.4 people |
| This village: | 65.8% |
| Whole state: | 65.0% |
| This village: | 6.9% |
| Whole state: | 6.8% |
Likely homosexual households (counted as self-reported same-sex unmarried-partner households)
- Lesbian couples: 0.2% of all households
- Gay men: 0.0% of all households
Banks with branches in Fredericktown (2011 data):
- The Park National Bank: 1505 Fredericktown Branch at 137 North Main Street, branch established on 1954/08/16. Info updated 2008/09/29: Bank assets: $6,281.7 mil, Deposits: $4,611.6 mil, headquarters in Newark, OH, positive income, Commercial Lending Specialization, 123 total offices, Holding Company: Park National Corporation
- The Farmers Citizens Bank: Fredericktown Branch at 240 West Sandusky Street, branch established on 2000/05/25. Info updated 2010/06/11: Bank assets: $356.8 mil, Deposits: $312.8 mil, headquarters in Bucyrus, OH, positive income, Commercial Lending Specialization, 7 total offices, Holding Company: Fc Banc Corp
For population 15 years and over in Fredericktown:
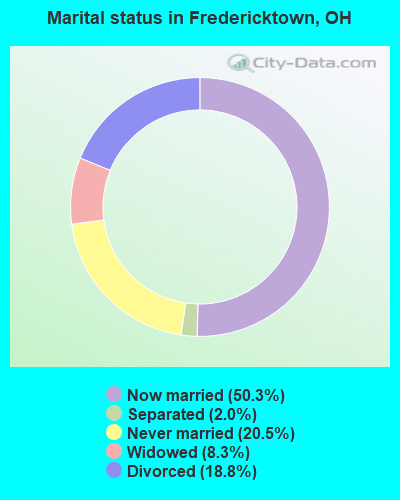
- Never married: 20.5%
- Now married: 50.3%
- Separated: 2.0%
- Widowed: 8.3%
- Divorced: 18.8%
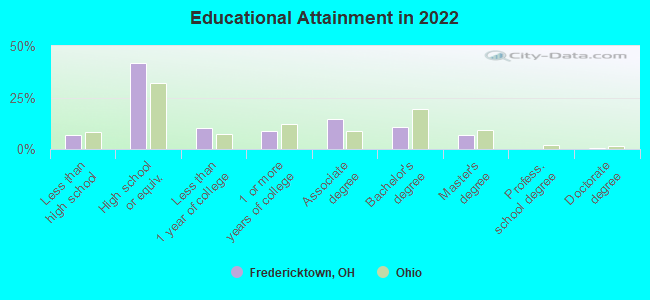
For population 25 years and over in Fredericktown:
- High school or higher: 93.0%
- Bachelor's degree or higher: 17.0%
- Graduate or professional degree: 6.6%
- Unemployed: 2.6%
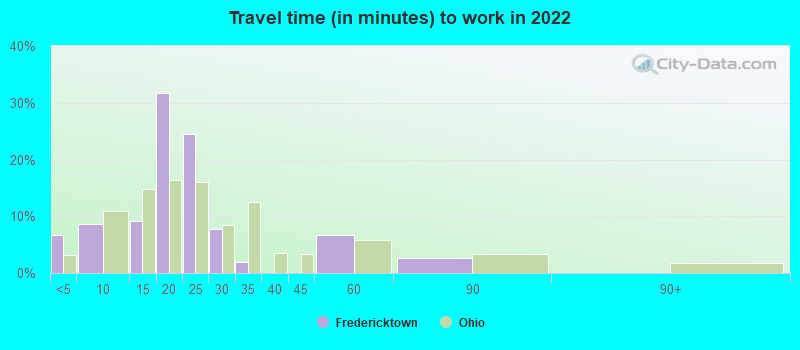
- Mean travel time to work (commute): 27.1 minutes
| Here: | 8.6 |
| Ohio average: | 11.0 |
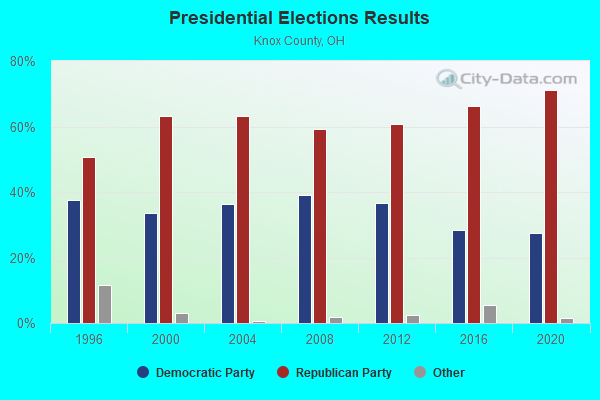
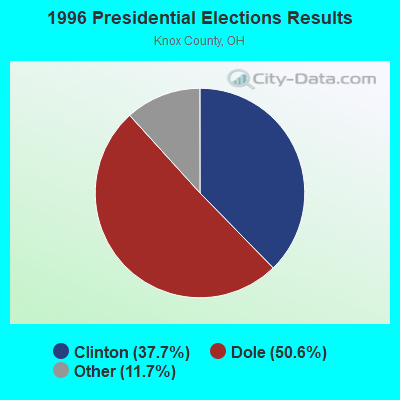
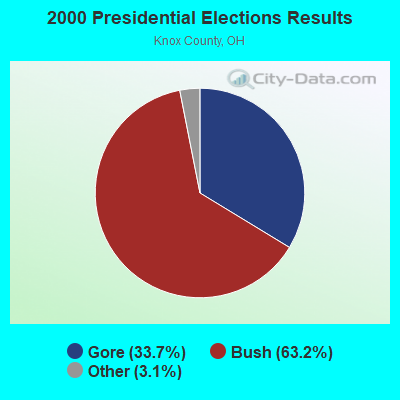
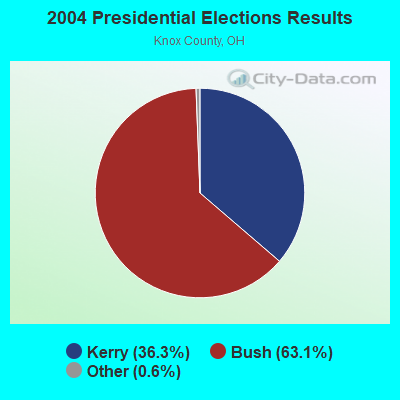
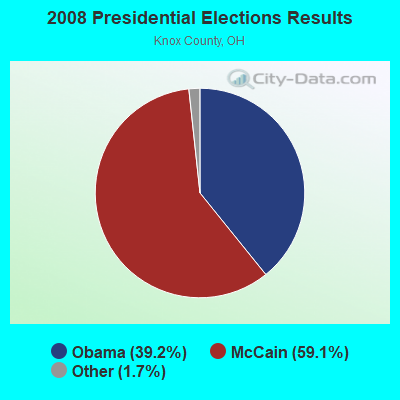
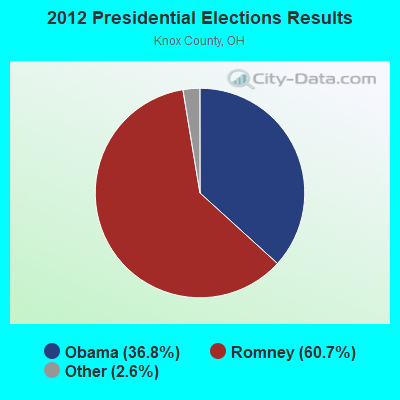
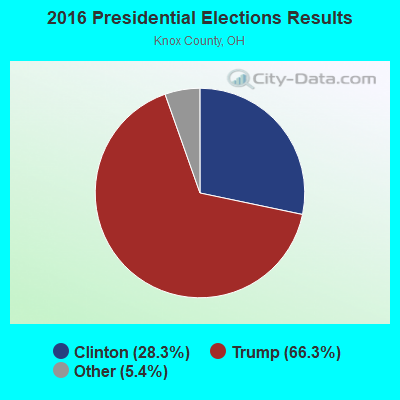
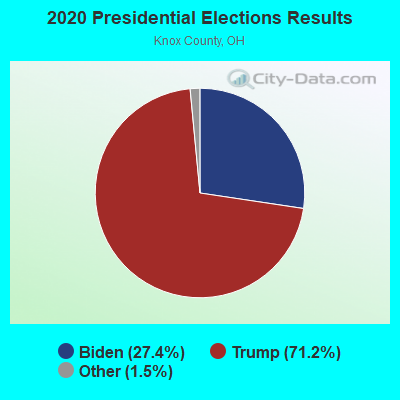
Graphs represent county-level data. Detailed 2008 Election Results
Religion statistics for Fredericktown, OH (based on Knox County data)
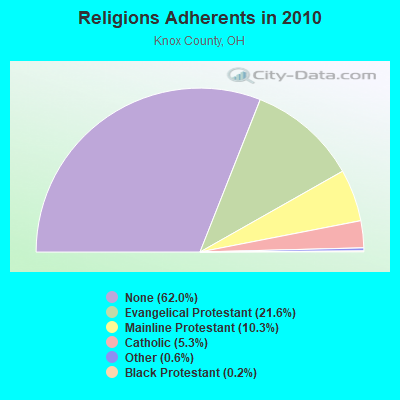
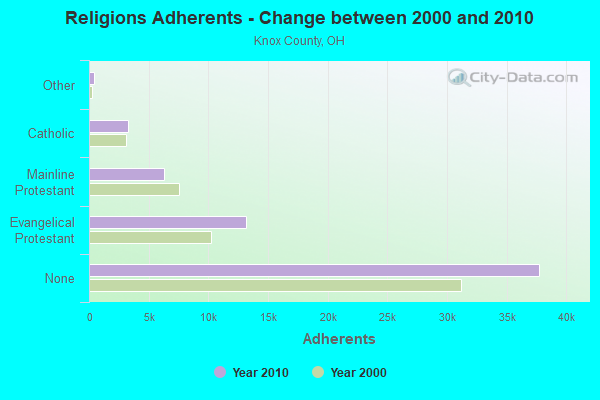
| Religion | Adherents | Congregations |
|---|---|---|
| Evangelical Protestant | 13,143 | 76 |
| Mainline Protestant | 6,260 | 39 |
| Catholic | 3,250 | 2 |
| Other | 389 | 2 |
| Black Protestant | 123 | 1 |
| None | 37,756 | - |
Food Environment Statistics:
| Here: | 2.04 / 10,000 pop. |
| Ohio: | 1.89 / 10,000 pop. |
| Knox County: | 0.51 / 10,000 pop. |
| Ohio: | 1.25 / 10,000 pop. |
| This county: | 3.23 / 10,000 pop. |
| Ohio: | 2.93 / 10,000 pop. |
| Knox County: | 4.58 / 10,000 pop. |
| Ohio: | 6.25 / 10,000 pop. |
| This county: | 9.9% |
| Ohio: | 10.3% |
| This county: | 28.6% |
| Ohio: | 29.1% |
| This county: | 11.7% |
| State: | 11.9% |
Health and Nutrition:
| Here: | 47.4% |
| State: | 50.4% |
| This city: | 48.2% |
| State: | 47.8% |
| Fredericktown: | 31.2 |
| Ohio: | 28.7 |
| This city: | 17.8% |
| State: | 20.6% |
| This city: | 12.0% |
| State: | 10.4% |
| Here: | 6.7 |
| Ohio: | 6.8 |
| Fredericktown: | 41.3% |
| Ohio: | 34.3% |
| This city: | 54.1% |
| Ohio: | 57.0% |
| Fredericktown: | 85.8% |
| Ohio: | 79.1% |
More about Health and Nutrition of Fredericktown, OH Residents
| Local government employment and payroll (March 2022) | |||||
| Function | Full-time employees | Monthly full-time payroll | Average yearly full-time wage | Part-time employees | Monthly part-time payroll |
|---|---|---|---|---|---|
| Police Protection - Officers | 5 | $21,151 | $50,762 | 1 | $2,577 |
| Streets and Highways | 4 | $15,998 | $47,994 | 0 | $0 |
| Financial Administration | 2 | $7,119 | $42,714 | 0 | $0 |
| Other Government Administration | 1 | $5,901 | $70,812 | 8 | $5,000 |
| Sewerage | 1 | $5,565 | $66,780 | 0 | $0 |
| Totals for Government | 13 | $55,734 | $51,447 | 9 | $7,577 |
Fredericktown government finances - Expenditure in 2018 (per resident):
- Current Operations - Sewerage: $403,000 ($152.88)
Police Protection: $264,000 ($100.15)
Regular Highways: $116,000 ($44.01)
General - Other: $104,000 ($39.45)
Central Staff Services: $87,000 ($33.00)
Financial Administration: $44,000 ($16.69)
General Public Buildings: $10,000 ($3.79)
- General - Interest on Debt: $22,000 ($8.35)
- Total Salaries and Wages: $236,000 ($89.53)
Fredericktown government finances - Revenue in 2018 (per resident):
- Miscellaneous - Interest Earnings: $3,000 ($1.14)
- Revenue - Water Utilities: $1,421,000 ($539.07)
- State Intergovernmental - Sewerage: $158,000 ($59.94)
Highways: $51,000 ($19.35)
Water Utilities: $41,000 ($15.55)
- Tax - Individual Income: $578,000 ($219.27)
Property: $149,000 ($56.53)
Motor Vehicle License: $85,000 ($32.25)
Alcoholic Beverage License: $1,000 ($0.38)
Fredericktown government finances - Debt in 2018 (per resident):
- Long Term Debt - Beginning Outstanding - Unspecified Public Purpose: $626,000 ($237.48)
Outstanding Unspecified Public Purpose: $626,000 ($237.48)
Fredericktown government finances - Cash and Securities in 2018 (per resident):
- Other Funds - Cash and Securities: $1,482,000 ($562.22)
| Businesses in Fredericktown, OH | ||||
| Name | Count | Name | Count | |
|---|---|---|---|---|
| Chevrolet | 1 | MasterBrand Cabinets | 2 | |
| Domino's Pizza | 1 | Rite Aid | 1 | |
| FedEx | 1 | Subway | 1 | |
Strongest AM radio stations in Fredericktown:
- WTVN (610 AM; 50 kW; COLUMBUS, OH; Owner: CITICASTERS LICENSES, L.P.)
- WRFD (880 AM; daytime; 23 kW; COLUMBUS-WORTHINGTON, OH; Owner: SALEM MEDIA OF OHIO, INC.)
- WKNR (850 AM; 50 kW; CLEVELAND, OH; Owner: CARON BROADCASTING, INC.)
- WTAM (1100 AM; 50 kW; CLEVELAND, OH; Owner: JACOR BROADCASTING CORPORATION)
- WHK (1220 AM; 50 kW; CLEVELAND, OH; Owner: CARON BROADCASTING, INC.)
- WMVO (1300 AM; 0 kW; MOUNT VERNON, OH; Owner: CAPSTAR TX LIMITED PARTNERSHIP)
- WWVA (1170 AM; 53 kW; WHEELING, WV; Owner: CAPSTAR TX LIMITED PARTNERSHIP)
- WLW (700 AM; 50 kW; CINCINNATI, OH; Owner: JACOR BROADCASTING CORPORATION)
- WJR (760 AM; 50 kW; DETROIT, MI; Owner: ABC, INC.)
- WFDF (910 AM; 50 kW; FLINT, MI; Owner: ABC, INC.)
- WOSU (820 AM; 5 kW; COLUMBUS, OH; Owner: THE OHIO STATE UNIVERSITY)
- WDFN (1130 AM; 50 kW; DETROIT, MI; Owner: AMFM RADIO LICENSES, L.L.C.)
- WDLR (1550 AM; 4 kW; DELAWARE, OH; Owner: THE FIFTEEN FIFTY CORPORATION)
Strongest FM radio stations in Fredericktown:
- WWBK (98.3 FM; FREDERICKTOWN, OH; Owner: CAPSTAR TX LIMITED PARTNERSHIP)
- WQIO (93.7 FM; MOUNT VERNON, OH; Owner: CAPSTAR TX LIMITED PARTNERSHIP)
- WNZR (90.9 FM; MOUNT VERNON, OH; Owner: MT. VERNON NAZARENE COLLEGE)
- WOSV (91.7 FM; MANSFIELD, OH; Owner: THE OHIO STATE UNIVERSITY)
- WVNO-FM (106.1 FM; MANSFIELD, OH; Owner: JOHNNY APPLESEED BROADCASTING CO.)
- WSMZ (103.1 FM; JOHNSTOWN, OH; Owner: STOP 26- RIVERBEND, INC.)
- WVXG (95.1 FM; MOUNT GILEAD, OH; Owner: XAVIER UNIVERSITY)
- WYHT (105.3 FM; MANSFIELD, OH; Owner: CAPSTAR TX LIMITED PARTNERSHIP)
- WFXN-FM (102.3 FM; GALION, OH; Owner: CAPSTAR TX LIMITED PARTNERSHIP)
- WNCO-FM (101.3 FM; ASHLAND, OH; Owner: CAPSTAR TX LIMITED PARTNERSHIP)
- WYXZ (98.7 FM; CRESTLINE, OH; Owner: ELYRIA-LORAIN BROADCASTING COMPANY)
- WVMC-FM (90.7 FM; MANSFIELD, OH; Owner: MANSFIELD CHRISTIAN SCHOOL)
- WODB (107.9 FM; DELAWARE, OH; Owner: FRANKLIN COMMUNICATIONS, INC.)
- WBZW (107.7 FM; LOUDONVILLE, OH; Owner: CAPSTAR TX LIMITED PARTNERSHIP)
TV broadcast stations around Fredericktown:
- WMFD-TV (Channel 68; MANSFIELD, OH; Owner: MID-STATE TELEVISION,INC.)
- WOSU-TV (Channel 34; COLUMBUS, OH; Owner: THE OHIO STATE UNIVERSITY)
- W32AR (Channel 32; LEXINGTON, OH; Owner: TRINITY BROADCASTING NETWORK)
- WOHZ-LP (Channel 57; MANSFIELD, OH; Owner: MID-STATE TELEVISION, INC.)
- WBNS-TV (Channel 10; COLUMBUS, OH; Owner: WBNS-TV, INC.)
- W54AF (Channel 54; BUCYRUS, OH; Owner: CRAWFORD BROADCASTING. COMPANY, INC.)
- W33BW (Channel 33; ASHLAND, OH; Owner: CHRISTIAN FAITH BROADCAST, INC.)

Fredericktown fatal accident list:
Apr 15, 2016 12:10 AM, W Salem Ave, W Salem Ave Extension, Lat: 40.487939, Lon: -82.552942, Vehicles: 1, Persons: 1, Fatalities: 1
Jul 1, 1992 05:20 PM, Millstreet, Vehicles: 1, Persons: 1, Fatalities: 1
May 2, 1977 09:50 PM, Vehicles: 1, Persons: 2, Fatalities: 1
- National Bridge Inventory (NBI) Statistics
- 43Number of bridges
- 354ft / 108mTotal length
- $600,481,000Total costs
- 60,693Total average daily traffic
- 6,806Total average daily truck traffic
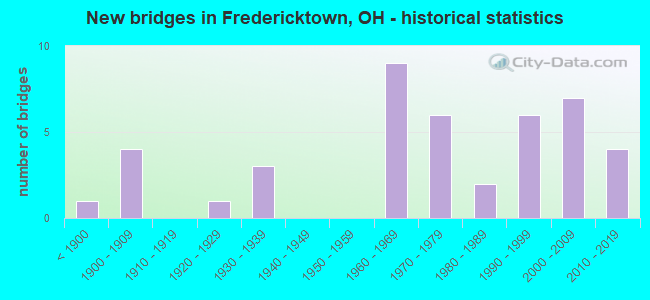
- New bridges - historical statistics
- 1Before 1900
- 41900-1909
- 11920-1929
- 31930-1939
- 91960-1969
- 61970-1979
- 21980-1989
- 61990-1999
- 72000-2009
- 42010-2019
FCC Registered Cell Phone Towers:
2 (See the full list of FCC Registered Cell Phone Towers in Fredericktown)FCC Registered Antenna Towers:
28 (See the full list of FCC Registered Antenna Towers)FCC Registered Microwave Towers:
4- FREDERICKTOWN TWR, 133 Columbus Road (Lat: 40.473944 Lon: -82.548222), Type: Tower, Structure height: 24.4 m, Overall height: 25.5 m, Call Sign: WQEP661,
Assigned Frequencies: 934.837 MHz, Grant Date: 03/20/2006, Expiration Date: 03/20/2016, Cancellation Date: 05/21/2016, Certifier: Larry Hatton, Registrant: Vasu Communications Inc, Avon, OH 44011-0236, Phone: (440) 934-5268, Fax: (440) 934-4679
- CB33XC012, 115 High Street (Lat: 40.484306 Lon: -82.548556), Type: Tank, Structure height: 56.5 m, Call Sign: WQSH756,
Assigned Frequencies: 11305.0 MHz, 11505.0 MHz, Grant Date: 09/20/2013, Expiration Date: 09/20/2023, Cancellation Date: 05/01/2023, Certifier: Jenny Knopf, Registrant: T-Mobile Usa, Inc., 12920 Se 38th Street, Bellevue, WA 98006, Phone: (425) 383-8401, Email:
- CB33XC012, 115 High Street (Lat: 40.484306 Lon: -82.548556), Type: Tank, Structure height: 51.8 m, Call Sign: WQTR966,
Assigned Frequencies: 11305.0 MHz, Grant Date: 04/01/2014, Expiration Date: 04/01/2024, Cancellation Date: 05/03/2023, Certifier: Jenny Knopf, Registrant: T-Mobile Usa, Inc., 12920 Se 38th Street, Bellevue, WA 98006, Phone: (425) 383-8401, Email:
- 155 N. Main St. (Lat: 40.483389 Lon: -82.543472), Overall height: 10.7 m, Call Sign: WLJ913, Licensee ID: L01533306,
Assigned Frequencies: 945.625 MHz, 945.375 MHz, Grant Date: 09/26/1988, Expiration Date: 10/01/2020, Cancellation Date: 01/23/2013, Registrant: Capstar Tx LLC, 2625 S. Memorial Drive Suite A, Tulsa, OK 74129
FCC Registered Amateur Radio Licenses:
62 (See the full list of FCC Registered Amateur Radio Licenses in Fredericktown)FAA Registered Aircraft:
11 (See the full list of FAA Registered Aircraft in Fredericktown)2002 - 2018 National Fire Incident Reporting System (NFIRS) incidents
- Fire incident types reported to NFIRS in Fredericktown, OH
- 36446.2%Structure Fires
- 32040.6%Outside Fires
- 9812.4%Mobile Property/Vehicle Fires
- 60.8%Other
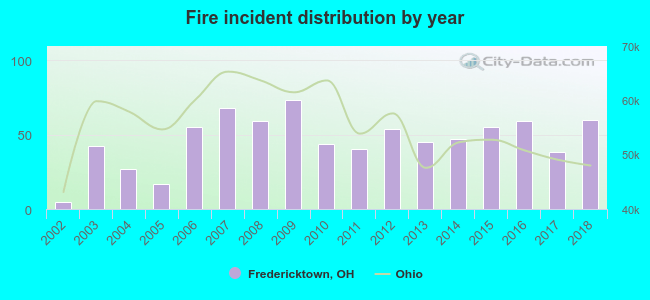 Based on the data from the years 2002 - 2018 the average number of fire incidents per year is 46. The highest number of fire incidents - 73 took place in 2009, and the least - 5 in 2002. The data has an increasing trend.
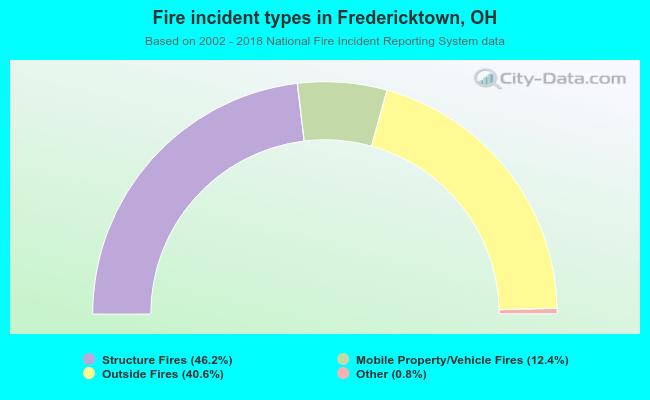 When looking into fire subcategories, the most incidents belonged to: Structure Fires (46.2%), and Outside Fires (40.6%).
| Most common first names in Fredericktown, OH among deceased individuals | ||
| Name | Count | Lived (average) |
|---|---|---|
| William | 53 | 74.6 years |
| John | 52 | 77.7 years |
| Robert | 41 | 72.5 years |
| Charles | 40 | 70.8 years |
| James | 35 | 73.5 years |
| Mary | 35 | 79.2 years |
| Ruth | 28 | 81.0 years |
| George | 25 | 75.3 years |
| Helen | 24 | 79.5 years |
| Richard | 24 | 67.7 years |
| Most common last names in Fredericktown, OH among deceased individuals | ||
| Last name | Count | Lived (average) |
|---|---|---|
| Smith | 28 | 73.9 years |
| Robinson | 17 | 78.4 years |
| Miller | 16 | 78.0 years |
| Phillips | 16 | 80.1 years |
| Wilson | 14 | 77.2 years |
| Shaffer | 13 | 76.5 years |
| Reed | 13 | 79.1 years |
| Frazier | 13 | 78.4 years |
| Brown | 12 | 79.4 years |
| Williams | 11 | 73.7 years |
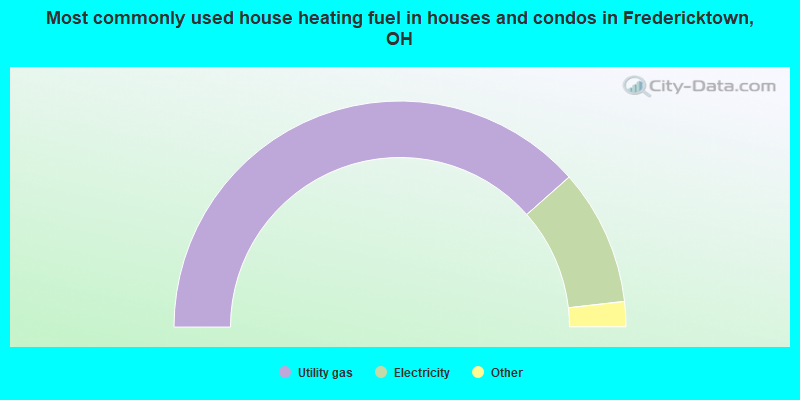
- 77.0%Utility gas
- 19.5%Electricity
- 2.9%Wood
- 0.6%No fuel used
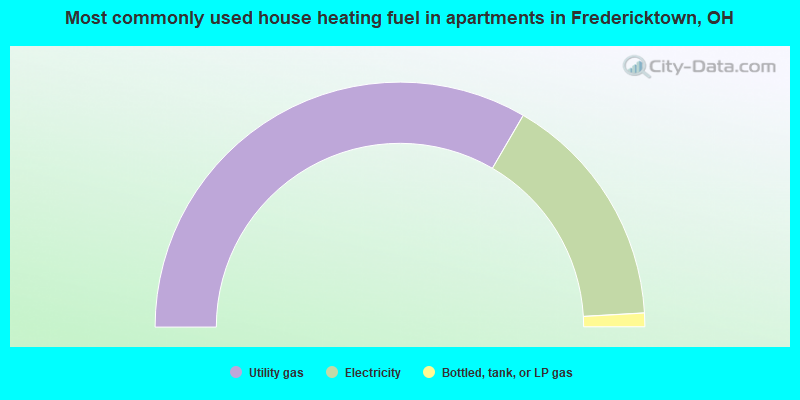
- 66.8%Utility gas
- 31.4%Electricity
- 1.8%Bottled, tank, or LP gas
Fredericktown compared to Ohio state average:
- Unemployed percentage significantly below state average.
- Black race population percentage significantly below state average.
- Hispanic race population percentage significantly below state average.
- Foreign-born population percentage significantly below state average.
- Length of stay since moving in significantly above state average.
- Number of college students below state average.

|
|
Total of 27 patent applications in 2008-2024.