Percentage of residents living in poverty in 2022: 8.7%
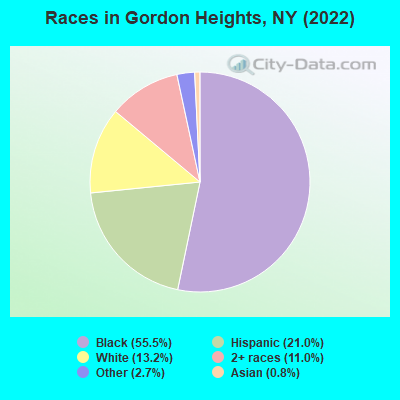
(13.7% for White Non-Hispanic residents, 7.0% for Black residents, 14.4% for Hispanic or Latino residents, 19.6% for other race residents, 0.8% for two or more races residents)
Latest news from Gordon Heights, NY collected exclusively by city-data.com from local newspapers, TV, and radio stations
Ancestries: Haitian (11.6%), Italian (3.7%), Irish (1.0%), Trinidadian and Tobagonian (1.0%).
Current Local Time: EST time zone
Elevation: 157 feet
Land area: 1.69 square miles.
Population density: 2,387 people per square mile (low).
887 residents are foreign born (18.2% Latin America).
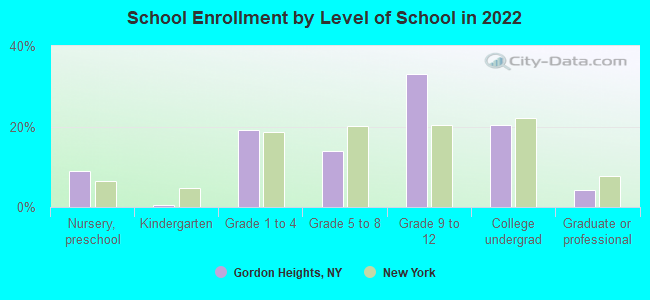
This place:
19.8%
New York:
22.6%
Median real estate property taxes paid for housing units with mortgages in 2022: $9,806 (2.5%) Median real estate property taxes paid for housing units with no mortgage in 2022: $7,786 (2.5%)
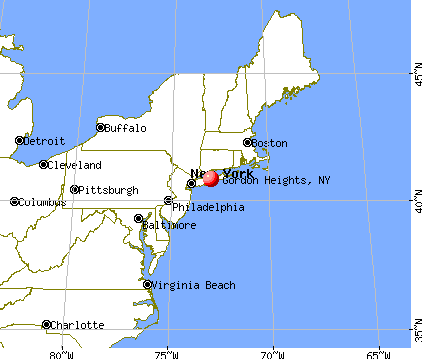
Nearest city with pop. 50,000+: Brentwood, NY (15.4 miles , pop. 53,917).
Nearest city with pop. 200,000+: North Hempstead, NY (37.1 miles , pop. 222,611).
Nearest city with pop. 1,000,000+: Queens, NY (45.8 miles , pop. 2,229,379).
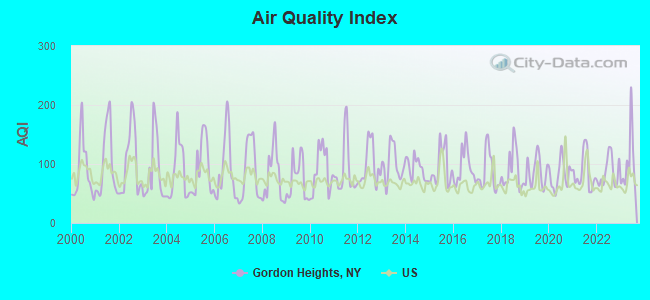
Air Quality Index (AQI) level in 2023 was 101. This is worse than average.
City:
101
U.S.:
73
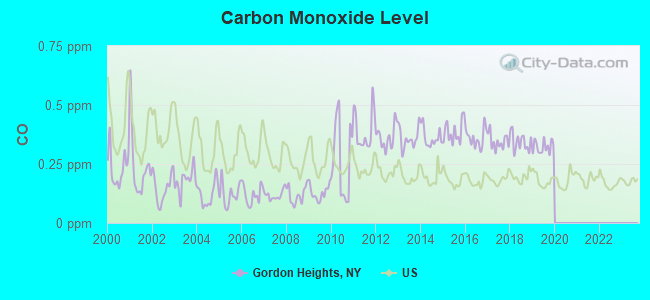
Carbon Monoxide (CO) [ppm] level in 2019 was 0.322. This is worse than average.Closest monitor was 5.2 miles away from the city center.
City:
0.322
U.S.:
0.251
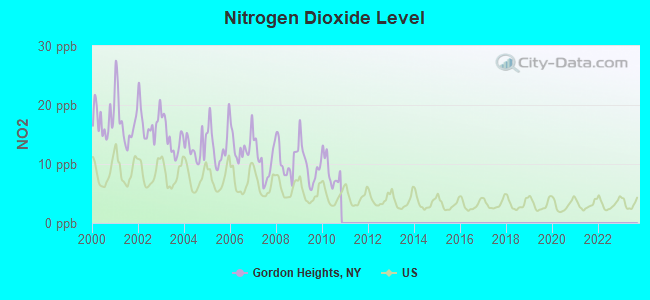
Nitrogen Dioxide (NO2) [ppb] level in 2010 was 8.78. This is significantly worse than average.Closest monitor was 5.2 miles away from the city center.
City:
8.78
U.S.:
5.11
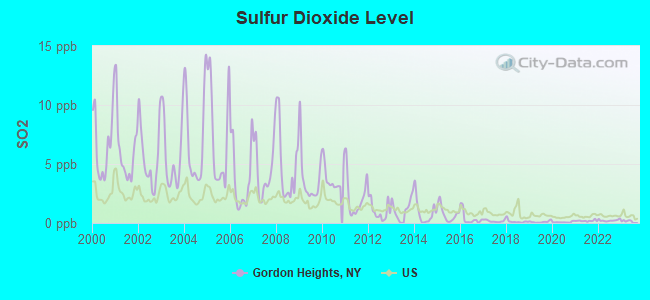
Sulfur Dioxide (SO2) [ppb] level in 2022 was 0.221. This is significantly better than average.Closest monitor was 5.2 miles away from the city center.
City:
0.221
U.S.:
1.515
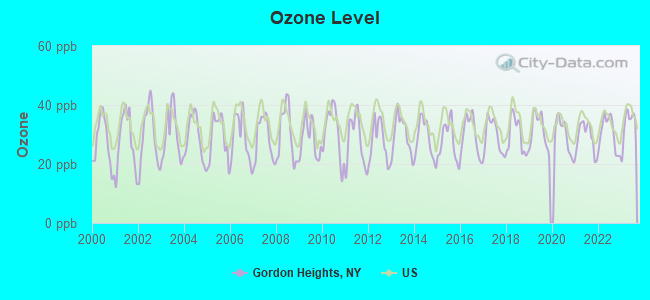
Ozone [ppb] level in 2023 was 33.5. This is about average.Closest monitor was 5.2 miles away from the city center.
City:
33.5
U.S.:
33.3
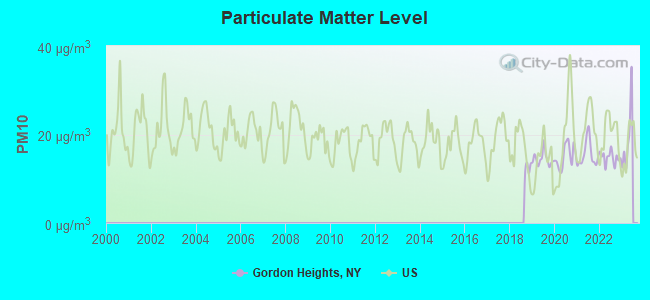
Particulate Matter (PM10) [µg/m3] level in 2022 was 14.8. This is better than average.Closest monitor was 24.5 miles away from the city center.
City:
14.8
U.S.:
19.2
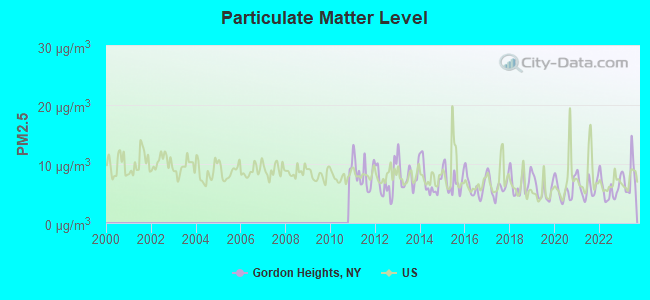
Particulate Matter (PM2.5) [µg/m3] level in 2023 was 7.89. This is about average.Closest monitor was 24.7 miles away from the city center.
City:
7.89
U.S.:
8.11
Tornado activity:
Gordon Heights-area historical tornado activity is near New York state average. It is 61% smaller than the overall U.S. average.
On 7/10/1989, a category F4 (max. wind speeds 207-260 mph) tornado 32.1 miles away from the Gordon Heights place center injured 40 peopleand causedbetween $50,000,000 and $500,000,000 in damages.
On 7/10/1989, a category F2 (max. wind speeds 113-157 mph) tornado 10.1 miles away from the place center injured one person.
Earthquake activity:
Gordon Heights-area historical earthquake activity is significantly above New York state average. It is 71% smaller than the overall U.S. average.
On 10/7/1983 at 10:18:46, a magnitude 5.3 (5.1 MB, 5.3 LG, 5.1 ML, Class: Moderate, Intensity: VI - VII) earthquake occurred 225.3 miles away from Gordon Heights center On 8/23/2011 at 17:51:04, a magnitude 5.8 (5.8 MW, Depth: 3.7 mi) earthquake occurred 334.8 miles away from Gordon Heights center On 4/20/2002 at 10:50:47, a magnitude 5.3 (5.3 ML, Depth: 3.0 mi) earthquake occurred 255.5 miles away from Gordon Heights center On 4/20/2002 at 10:50:47, a magnitude 5.2 (5.2 MB, 4.2 MS, 5.2 MW, 5.0 MW) earthquake occurred 253.9 miles away from the city center On 8/22/1992 at 12:20:32, a magnitude 4.8 (4.8 MB, 3.8 MS, 4.7 LG, Depth: 6.2 mi, Class: Light, Intensity: IV - V) earthquake occurred 185.4 miles away from Gordon Heights center On 1/16/1994 at 01:49:16, a magnitude 4.6 (4.6 MB, 4.6 LG, Depth: 3.1 mi) earthquake occurred 165.3 miles away from Gordon Heights center Magnitude types: regional Lg-wave magnitude (LG), body-wave magnitude (MB), local magnitude (ML), surface-wave magnitude (MS), moment magnitude (MW)
Natural disasters:
The number of natural disasters in Suffolk County (28) is a lot greater than the US average (15). Major Disasters (Presidential) Declared: 19 Emergencies Declared: 7
Causes of natural disasters: Hurricanes: 9, Floods: 7, Storms: 7, Snowstorms: 4, Winter Storms: 3, Blizzards: 2, Heavy Rain: 1, Power Outage: 1, Tropical Depression: 1, Tropical Storm: 1, Water Shortage: 1, Other: 3 (Note: some incidents may be assigned to more than one category).
Hospitals and medical centers near Gordon Heights:
INDEPENDENT GROUP HOME LIVING PROGRAM, INC (Hospital, about 2 miles away; MIDDLE ISLAND, NY)
LAKEVIEW REHABILITATION AND CARE CENTER (Nursing Home, about 3 miles away; MIDDLE ISLAND, NY)
OAK HOLLOW NURSING CENTER (Nursing Home, about 3 miles away; MIDDLE ISLAND, NY)
MEDFORD MULTICARE CENTER FOR LIVING (Nursing Home, about 3 miles away; MEDFORD, NY)
ISLAND NURSING AND REHABILITATION CENTER INC (Nursing Home, about 4 miles away; HOLTSVILLE, NY)
JOHN J FOLEY SKILLED NURSING FACILITY (Nursing Home, about 4 miles away; YAPHANK, NY)
HUNTINGTON AKC- MEDFORD EXT. (Dialysis Facility, about 5 miles away; MEDFORD, NY)
Colleges/universities with over 2000 students nearest to Gordon Heights:
Suffolk County Community College (about 5 miles; Selden, NY; Full-time enrollment: 18,540)
Stony Brook University (about 10 miles; Stony Brook, NY; FT enrollment: 22,071)
Dowling College (about 13 miles; Oakdale, NY; FT enrollment: 2,598)
Porter and Chester Institute of Stratford (about 24 miles; Stratford, CT; FT enrollment: 2,822)
University of Bridgeport (about 25 miles; Bridgeport, CT; FT enrollment: 3,708)
Housatonic Community College (about 25 miles; Bridgeport, CT; FT enrollment: 3,677)
Farmingdale State College (about 26 miles; Farmingdale, NY; FT enrollment: 6,956)
Churches in Gordon Heights include: Saint Michaels and All Angels Church (A), Unity Church of Our Lord (B), Harvest Temple Church of God (C). Display/hide their locations on the map
Religion statistics for Gordon Heights, NY (based on Suffolk County data)
Religion
Adherents
Congregations
Catholic
879,457
75
Mainline Protestant
69,205
182
Evangelical Protestant
58,909
264
Other
50,771
124
Orthodox
10,190
10
Black Protestant
8,298
49
None
416,520
-
Source: Clifford Grammich, Kirk Hadaway, Richard Houseal, Dale E.Jones, Alexei Krindatch, Richie Stanley and Richard H.Taylor. 2012. 2010 U.S.Religion Census: Religious Congregations & Membership Study. Association of Statisticians of American Religious Bodies. Jones, Dale E., et al. 2002. Congregations and Membership in the United States 2000. Nashville, TN: Glenmary Research Center. Graphs represent county-level data
WPXN-TV (Channel 31; NEW YORK, NY; Owner: PAXSON COMMUNICATIONS LICENSE COMPANY, LLC)
WXNY-LP (Channel 32; NEW YORK, NY; Owner: ISLAND BROADCASTING COMPANY)
WTNH (Channel 8; NEW HAVEN, CT; Owner: WTNH BROADCASTING, INC.)
WEDY (Channel 65; NEW HAVEN, CT; Owner: CONNECTICUT PUBLIC BROADCASTING, INC.)
WCTX (Channel 59; NEW HAVEN, CT; Owner: WTNH BROADCASTING, INC.)
FCC Registered Antenna Towers:
7
ED MOONEY, Middle Country & East Bartlett Roads (Lat: 40.878833 Lon: -72.959167), Type: 39.6, Overall height: 39.6 m, Registrant: East End Wireless, Inc., Emooney@highlanderinc.Com, , East -Islip, Phone: (631) 581-8105
ED MOONEY, Middle Country & East Bartlett Roads (Lat: 40.878833 Lon: -72.959167), Type: 39.6, Overall height: 39.6 m, Registrant: East End Wireless, Inc., Emooney@highlanderinc.Com, , East -Islip, Phone: (631) 581-8105
JOY MOONEY, 23 Hawkins Ave (Lat: 40.854306 Lon: -72.965917), Type: 33.5, Overall height: 33.5 m, Registrant: Mid Atlantic Wireless LLC, Jmooney@highlanderinc.Com, , East -Islip, Phone: (631) 581-8105
JOY MOONEY, 23 Hawkins Ave (Lat: 40.854306 Lon: -72.965917), Type: 33.5, Overall height: 33.5 m, Registrant: Mid Atlantic Wireless LLC, Jmooney@highlanderinc.Com, , East -Islip, Phone: (631) 581-8105
Edward G Roach, 23 Hawkins Ave (Lat: 40.854306 Lon: -72.965917), Type: 33.5, Structure height: 36103 m, Overall height: 33.5 m, Registrant: Sba Towers Iv, LLC, Eroach@sbasite.Com, , Boca -Raton, Phone: (561) 995-7670
Edward G Roach, 23 Hawkins Ave(Ny15409-A) (Lat: 40.853833 Lon: -72.965417), Type: 33.5, Structure height: 36103 m, Overall height: 33.5 m, Registrant: Sba Towers Iv, LLC, Eroach@sbasite.Com, , Boca -Raton, Phone: (561) 995-7670
Edward G Roach, 23 Hawkins Ave(Ny15409-A) (Lat: 40.853833 Lon: -72.965417), Type: 33.5, Structure height: 36103 m, Overall height: 33.5 m, Registrant: Sba Towers Iv, LLC, Eroach@sbasite.Com, , Boca -Raton, Phone: (561) 995-7670
Home Mortgage Disclosure Act Aggregated Statistics For Year 2009 (Based on 1 full tract)
A) FHA, FSA/RHS & VA Home Purchase Loans
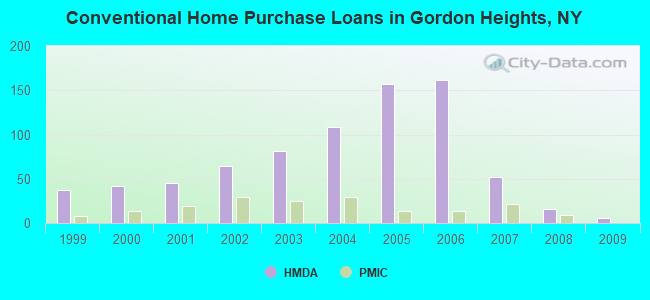
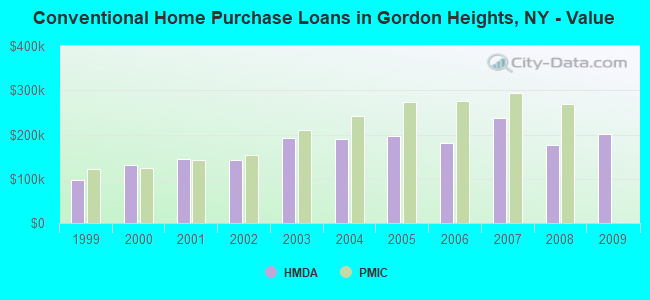
B) Conventional Home Purchase Loans
C) Refinancings
D) Home Improvement Loans
F) Non-occupant Loans on < 5 Family Dwellings (A B C & D)
Number
Average Value
Number
Average Value
Number
Average Value
Number
Average Value
Number
Average Value
LOANS ORIGINATED
8
$221,875
6
$200,833
20
$162,900
1
$102,000
1
$122,000
APPLICATIONS APPROVED, NOT ACCEPTED
4
$181,000
1
$412,000
2
$185,500
0
$0
0
$0
APPLICATIONS DENIED
3
$221,000
4
$176,250
24
$220,292
5
$17,400
1
$139,000
APPLICATIONS WITHDRAWN
2
$270,000
1
$105,000
15
$271,933
0
$0
1
$105,000
FILES CLOSED FOR INCOMPLETENESS
2
$164,000
0
$0
3
$318,000
1
$350,000
0
$0
Aggregated Statistics For Year 2008 (Based on 1 full tract)
A) FHA, FSA/RHS & VA Home Purchase Loans
B) Conventional Home Purchase Loans
C) Refinancings
D) Home Improvement Loans
E) Loans on Dwellings For 5+ Families
F) Non-occupant Loans on < 5 Family Dwellings (A B C & D)
Number
Average Value
Number
Average Value
Number
Average Value
Number
Average Value
Number
Average Value
Number
Average Value
LOANS ORIGINATED
7
$277,857
16
$176,062
25
$219,160
13
$102,846
1
$100,000
7
$176,571
APPLICATIONS APPROVED, NOT ACCEPTED
1
$415,000
7
$237,571
9
$257,667
2
$13,000
0
$0
2
$261,500
APPLICATIONS DENIED
3
$283,333
9
$256,778
54
$252,778
14
$34,571
0
$0
11
$200,818
APPLICATIONS WITHDRAWN
1
$171,000
8
$232,125
18
$244,833
4
$178,250
0
$0
2
$98,500
FILES CLOSED FOR INCOMPLETENESS
1
$157,000
3
$264,667
6
$254,000
0
$0
0
$0
3
$216,000
Aggregated Statistics For Year 2007 (Based on 1 full tract)
A) FHA, FSA/RHS & VA Home Purchase Loans
B) Conventional Home Purchase Loans
C) Refinancings
D) Home Improvement Loans
F) Non-occupant Loans on < 5 Family Dwellings (A B C & D)
Number
Average Value
Number
Average Value
Number
Average Value
Number
Average Value
Number
Average Value
LOANS ORIGINATED
4
$320,750
52
$236,788
80
$231,888
20
$113,600
13
$206,077
APPLICATIONS APPROVED, NOT ACCEPTED
1
$282,000
18
$239,667
22
$224,636
7
$106,857
8
$203,000
APPLICATIONS DENIED
2
$298,500
62
$274,710
139
$253,511
22
$113,045
17
$231,706
APPLICATIONS WITHDRAWN
0
$0
9
$154,889
39
$243,872
8
$155,250
2
$111,000
FILES CLOSED FOR INCOMPLETENESS
0
$0
6
$262,500
9
$302,222
1
$90,000
2
$171,500
Aggregated Statistics For Year 2006 (Based on 1 full tract)
A) FHA, FSA/RHS & VA Home Purchase Loans
B) Conventional Home Purchase Loans
C) Refinancings
D) Home Improvement Loans
F) Non-occupant Loans on < 5 Family Dwellings (A B C & D)
Number
Average Value
Number
Average Value
Number
Average Value
Number
Average Value
Number
Average Value
LOANS ORIGINATED
2
$260,000
162
$181,321
153
$215,523
27
$113,481
36
$182,639
APPLICATIONS APPROVED, NOT ACCEPTED
0
$0
19
$259,263
29
$238,034
2
$72,500
2
$230,000
APPLICATIONS DENIED
1
$345,000
78
$190,000
122
$228,213
27
$64,222
22
$208,455
APPLICATIONS WITHDRAWN
2
$336,500
34
$188,647
73
$231,671
10
$156,300
6
$224,500
FILES CLOSED FOR INCOMPLETENESS
0
$0
15
$207,933
36
$245,639
0
$0
0
$0
Aggregated Statistics For Year 2005 (Based on 1 full tract)
A) FHA, FSA/RHS & VA Home Purchase Loans
B) Conventional Home Purchase Loans
C) Refinancings
D) Home Improvement Loans
E) Loans on Dwellings For 5+ Families
F) Non-occupant Loans on < 5 Family Dwellings (A B C & D)
G) Loans On Manufactured Home Dwelling (A B C & D)
Number
Average Value
Number
Average Value
Number
Average Value
Number
Average Value
Number
Average Value
Number
Average Value
Number
Average Value
LOANS ORIGINATED
4
$232,500
157
$195,650
179
$210,307
17
$96,059
0
$0
32
$176,219
0
$0
APPLICATIONS APPROVED, NOT ACCEPTED
0
$0
19
$199,053
24
$216,625
5
$71,400
1
$7,050,000
5
$174,600
0
$0
APPLICATIONS DENIED
1
$320,000
60
$210,767
123
$207,317
21
$88,476
0
$0
19
$174,053
0
$0
APPLICATIONS WITHDRAWN
0
$0
39
$198,051
76
$223,987
6
$157,000
0
$0
16
$199,250
1
$280,000
FILES CLOSED FOR INCOMPLETENESS
1
$260,000
5
$232,800
36
$223,833
1
$20,000
0
$0
3
$153,000
0
$0
Aggregated Statistics For Year 2004 (Based on 1 full tract)
A) FHA, FSA/RHS & VA Home Purchase Loans
B) Conventional Home Purchase Loans
C) Refinancings
D) Home Improvement Loans
F) Non-occupant Loans on < 5 Family Dwellings (A B C & D)
G) Loans On Manufactured Home Dwelling (A B C & D)
Number
Average Value
Number
Average Value
Number
Average Value
Number
Average Value
Number
Average Value
Number
Average Value
LOANS ORIGINATED
6
$192,333
108
$189,102
171
$174,450
20
$78,550
43
$157,860
0
$0
APPLICATIONS APPROVED, NOT ACCEPTED
0
$0
20
$198,650
42
$159,714
3
$127,667
11
$150,455
1
$20,000
APPLICATIONS DENIED
1
$266,000
25
$191,640
132
$181,106
29
$63,793
9
$163,667
1
$27,000
APPLICATIONS WITHDRAWN
2
$235,500
28
$169,500
74
$177,743
10
$116,900
8
$161,750
0
$0
FILES CLOSED FOR INCOMPLETENESS
0
$0
12
$201,833
41
$178,000
4
$116,500
8
$141,500
0
$0
Aggregated Statistics For Year 2003 (Based on 1 full tract)
A) FHA, FSA/RHS & VA Home Purchase Loans
B) Conventional Home Purchase Loans
C) Refinancings
D) Home Improvement Loans
F) Non-occupant Loans on < 5 Family Dwellings (A B C & D)
Number
Average Value
Number
Average Value
Number
Average Value
Number
Average Value
Number
Average Value
LOANS ORIGINATED
15
$182,333
81
$191,790
199
$142,698
12
$26,167
30
$131,200
APPLICATIONS APPROVED, NOT ACCEPTED
0
$0
19
$188,947
28
$136,179
4
$18,000
4
$144,750
APPLICATIONS DENIED
3
$206,333
23
$185,652
119
$161,924
21
$55,714
7
$233,857
APPLICATIONS WITHDRAWN
1
$203,000
12
$166,667
74
$154,568
3
$35,333
3
$111,667
FILES CLOSED FOR INCOMPLETENESS
1
$182,000
2
$207,500
14
$146,000
0
$0
1
$58,000
Aggregated Statistics For Year 2002 (Based on 1 full tract)
A) FHA, FSA/RHS & VA Home Purchase Loans
B) Conventional Home Purchase Loans
C) Refinancings
D) Home Improvement Loans
F) Non-occupant Loans on < 5 Family Dwellings (A B C & D)
Number
Average Value
Number
Average Value
Number
Average Value
Number
Average Value
Number
Average Value
LOANS ORIGINATED
25
$161,880
64
$143,312
91
$118,429
10
$39,800
28
$104,750
APPLICATIONS APPROVED, NOT ACCEPTED
4
$169,000
17
$150,529
27
$131,333
3
$34,333
6
$91,000
APPLICATIONS DENIED
2
$184,000
11
$127,455
80
$136,550
19
$24,947
7
$101,000
APPLICATIONS WITHDRAWN
3
$153,667
12
$130,500
54
$145,241
7
$41,286
3
$136,333
FILES CLOSED FOR INCOMPLETENESS
2
$179,000
3
$90,333
24
$113,917
1
$75,000
3
$51,667
Aggregated Statistics For Year 2001 (Based on 1 full tract)
A) FHA, FSA/RHS & VA Home Purchase Loans
B) Conventional Home Purchase Loans
C) Refinancings
D) Home Improvement Loans
F) Non-occupant Loans on < 5 Family Dwellings (A B C & D)
Number
Average Value
Number
Average Value
Number
Average Value
Number
Average Value
Number
Average Value
LOANS ORIGINATED
27
$127,778
45
$144,267
73
$121,507
16
$22,562
9
$83,778
APPLICATIONS APPROVED, NOT ACCEPTED
4
$126,500
7
$104,000
23
$96,913
7
$37,571
1
$104,000
APPLICATIONS DENIED
5
$119,000
11
$140,091
72
$99,833
40
$18,425
2
$101,000
APPLICATIONS WITHDRAWN
5
$131,400
7
$101,857
56
$111,821
9
$22,444
2
$66,500
FILES CLOSED FOR INCOMPLETENESS
1
$152,000
9
$128,556
13
$98,615
1
$5,000
0
$0
Aggregated Statistics For Year 2000 (Based on 1 full tract)
A) FHA, FSA/RHS & VA Home Purchase Loans
B) Conventional Home Purchase Loans
C) Refinancings
D) Home Improvement Loans
F) Non-occupant Loans on < 5 Family Dwellings (A B C & D)
Number
Average Value
Number
Average Value
Number
Average Value
Number
Average Value
Number
Average Value
LOANS ORIGINATED
27
$148,444
42
$130,071
32
$95,438
7
$28,429
8
$92,375
APPLICATIONS APPROVED, NOT ACCEPTED
2
$107,000
5
$132,200
10
$114,400
3
$15,000
0
$0
APPLICATIONS DENIED
9
$146,556
30
$123,933
79
$78,848
34
$29,882
9
$97,667
APPLICATIONS WITHDRAWN
4
$148,750
14
$139,571
61
$73,574
2
$31,000
3
$74,333
FILES CLOSED FOR INCOMPLETENESS
1
$174,000
4
$117,250
8
$139,250
1
$40,000
0
$0
Aggregated Statistics For Year 1999 (Based on 1 full tract)
A) FHA, FSA/RHS & VA Home Purchase Loans
B) Conventional Home Purchase Loans
C) Refinancings
D) Home Improvement Loans
F) Non-occupant Loans on < 5 Family Dwellings (A B C & D)
Detailed PMIC statistics for the following Tracts:1587.05
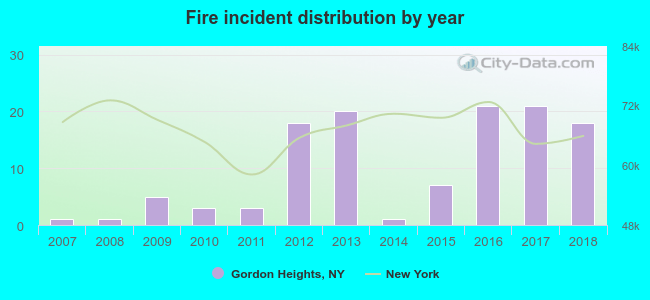
2007 - 2018 National Fire Incident Reporting System (NFIRS) incidents
Based on the data from the years 2007 - 2018 the average number of fires per year is 10. The highest number of reported fire incidents - 21 took place in 2016, and the least - 1 in 2007. The data has an increasing trend.
When looking into fire subcategories, the most reports belonged to: Outside Fires (42.9%), and Structure Fires (39.5%).
Fire incident types reported to NFIRS in Gordon Heights, NY


 Recent articles from our blog. Our writers, many of them Ph.D. graduates or candidates, create easy-to-read articles on a wide variety of topics.

 (15.4 miles


 Based on the data from the years 2007 - 2018 the average number of fires per year is 10. The highest number of reported fire incidents - 21 took place in 2016, and the least - 1 in 2007. The data has an increasing trend.
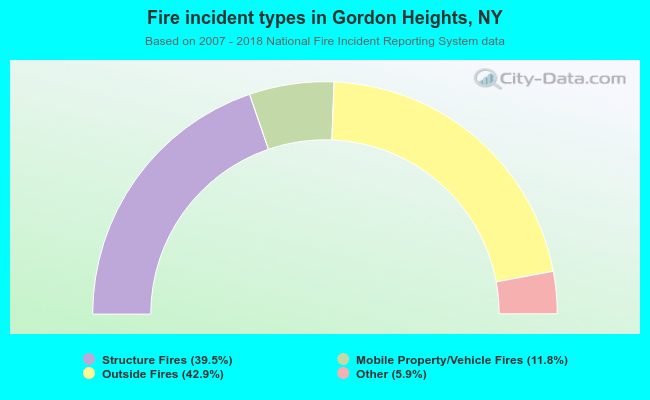 When looking into fire subcategories, the most reports belonged to: Outside Fires (42.9%), and Structure Fires (39.5%).