Greater Landover, Maryland
Submit your own pictures of this place and show them to the world
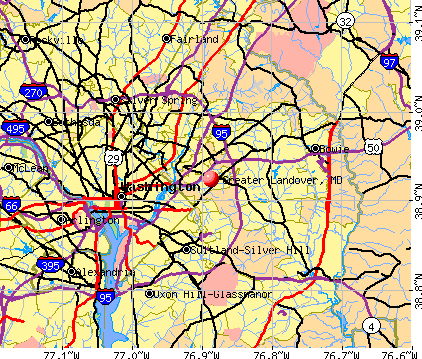
- OSM Map
- General Map
- Google Map
- MSN Map
| Males: 10,960 | |
| Females: 12,781 |
| Median resident age: | 29.5 years |
| Maryland median age: | 36.0 years |
Zip codes: 20785.
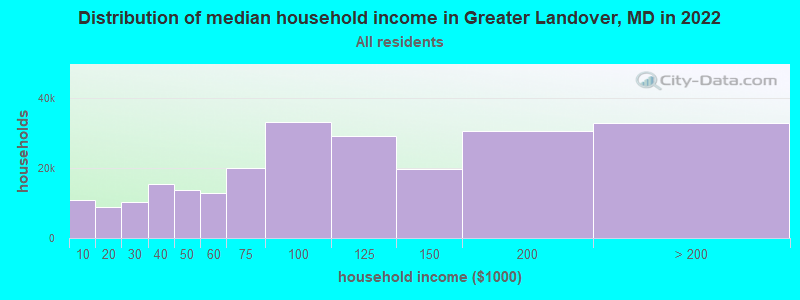
| Greater Landover: | $64,486 |
| MD: | $94,991 |
Estimated per capita income in 2022: $27,705 (it was $15,191 in 2000)
Greater Landover CDP income, earnings, and wages data
Estimated median house or condo value in 2022: $267,863 (it was $93,700 in 2000)
| Greater Landover: | $267,863 |
| MD: | $398,100 |
Mean prices in 2022: all housing units: $424,688; detached houses: $460,769; townhouses or other attached units: $335,894; in 2-unit structures: $711,936; in 3-to-4-unit structures: $270,628; in 5-or-more-unit structures: $250,132; mobile homes: $129,345; occupied boats, rvs, vans, etc.: $551,726
Greater Landover, MD residents, houses, and apartments details
Detailed information about poverty and poor residents in Greater Landover, MD


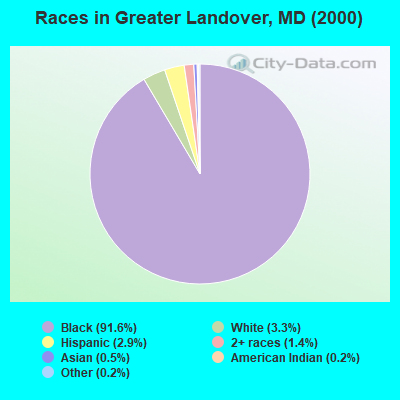
- 20,96791.6%Black alone
- 7613.3%White alone
- 6632.9%Hispanic
- 3151.4%Two or more races
- 1170.5%Asian alone
- 420.2%American Indian alone
- 350.2%Other race alone
Races in Greater Landover detailed stats: ancestries, foreign born residents, place of birth
According to our research of Maryland and other state lists, there was 1 registered sex offender living in Greater Landover, Maryland as of April 16, 2024.
The ratio of all residents to sex offenders in Greater Landover is 23,741 to 1.
The ratio of registered sex offenders to all residents in this city is much lower than the state average.
 Recent articles from our blog. Our writers, many of them Ph.D. graduates or candidates, create easy-to-read articles on a wide variety of topics.

Latest news from Greater Landover, MD collected exclusively by city-data.com from local newspapers, TV, and radio stations
Ancestries: Subsaharan African (5.5%), United States (1.7%), West Indian (1.6%).
Current Local Time: EST time zone
Land area: 4.12 square miles.
Population density: 5,765 people per square mile (average).
1,800 residents are foreign born (4.1% Africa, 3.2% Latin America).
| This place: | 7.9% |
| Maryland: | 9.8% |
| Greater Landover CDP: | 1.6% ($1,522) |
| Maryland: | 1.2% ($1,782) |
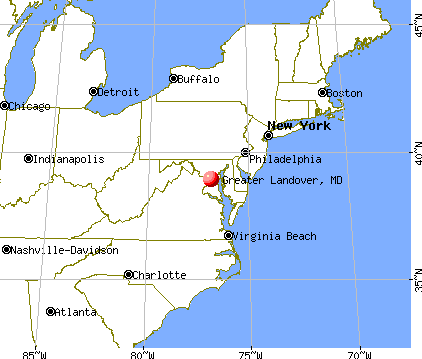
Nearest city with pop. 50,000+: Washington, DC  (6.8 miles , pop. 572,059).
Nearest city with pop. 1,000,000+: Philadelphia, PA (119.0 miles , pop. 1,517,550).
Nearest cities:
), ), ), ), ), ), )Latitude: 38.92 N, Longitude: 76.89 W
Daytime population change due to commuting: -2,302 (-10.1%)
Workers who live and work in this place: 438 (4.7%)
Property values in Greater Landover, MD

| Here: | 2.1% |
| Maryland: | 2.0% |
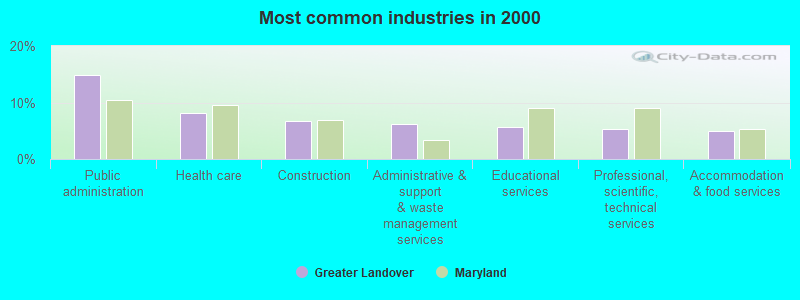
- Public administration (14.9%)
- Health care (8.2%)
- Construction (6.8%)
- Administrative & support & waste management services (6.2%)
- Educational services (5.6%)
- Professional, scientific, technical services (5.3%)
- Accommodation & food services (5.0%)
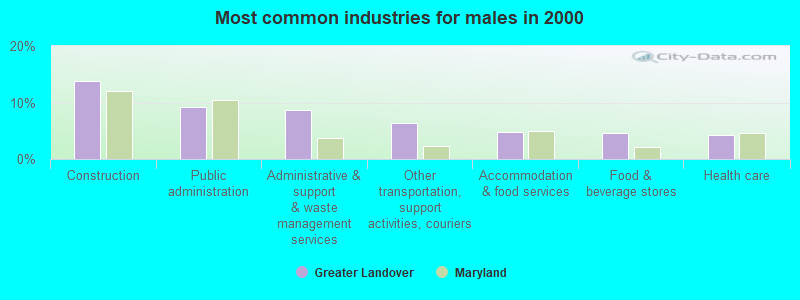
- Construction (13.9%)
- Public administration (9.3%)
- Administrative & support & waste management services (8.6%)
- Other transportation, support activities, couriers (6.4%)
- Accommodation & food services (4.7%)
- Food & beverage stores (4.7%)
- Health care (4.3%)
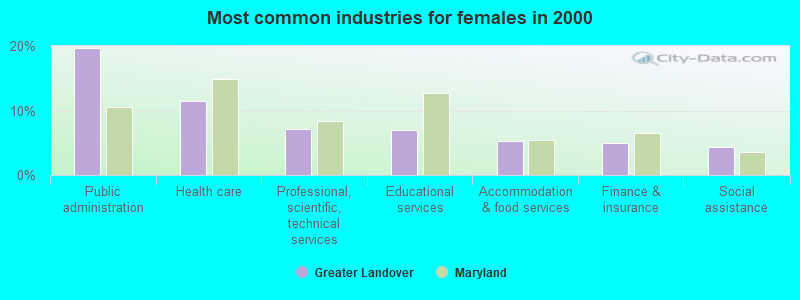
- Public administration (19.8%)
- Health care (11.5%)
- Professional, scientific, technical services (7.1%)
- Educational services (7.0%)
- Accommodation & food services (5.3%)
- Finance & insurance (4.9%)
- Social assistance (4.3%)
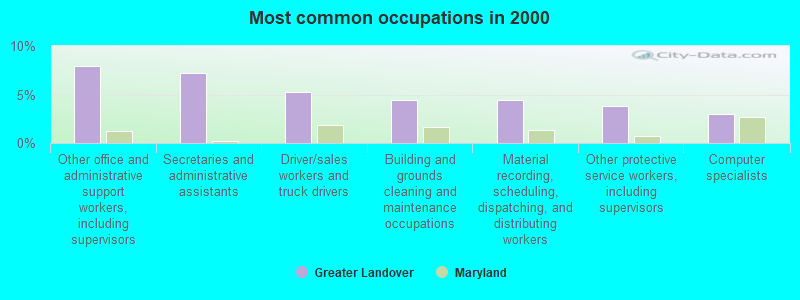
- Other office and administrative support workers, including supervisors (7.9%)
- Secretaries and administrative assistants (7.2%)
- Driver/sales workers and truck drivers (5.3%)
- Building and grounds cleaning and maintenance occupations (4.5%)
- Material recording, scheduling, dispatching, and distributing workers (4.4%)
- Other protective service workers, including supervisors (3.8%)
- Computer specialists (3.0%)
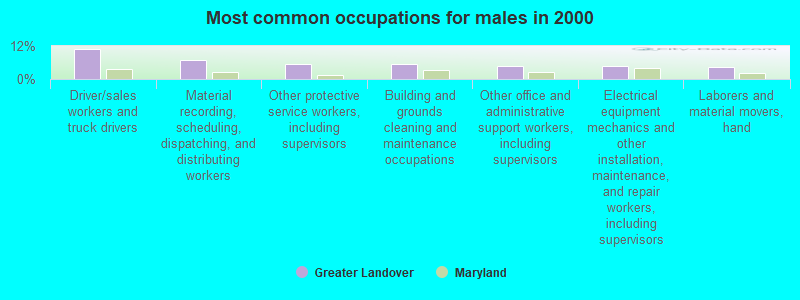
- Driver/sales workers and truck drivers (11.0%)
- Material recording, scheduling, dispatching, and distributing workers (6.9%)
- Other protective service workers, including supervisors (5.6%)
- Building and grounds cleaning and maintenance occupations (5.6%)
- Other office and administrative support workers, including supervisors (4.7%)
- Electrical equipment mechanics and other installation, maintenance, and repair workers, including supervisors (4.6%)
- Laborers and material movers, hand (4.5%)
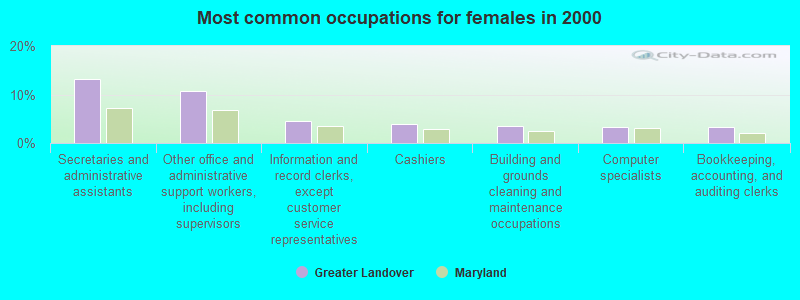
- Secretaries and administrative assistants (13.2%)
- Other office and administrative support workers, including supervisors (10.7%)
- Information and record clerks, except customer service representatives (4.5%)
- Cashiers (4.0%)
- Building and grounds cleaning and maintenance occupations (3.6%)
- Computer specialists (3.4%)
- Bookkeeping, accounting, and auditing clerks (3.3%)
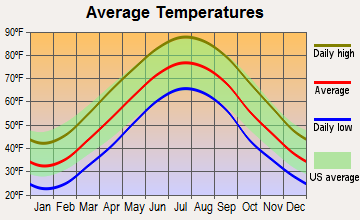
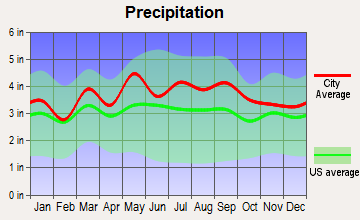
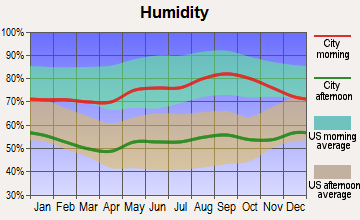
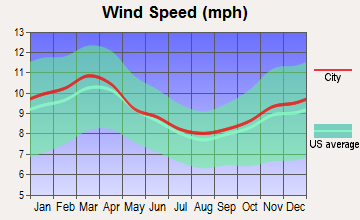
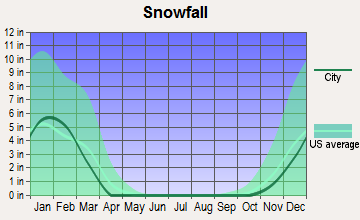
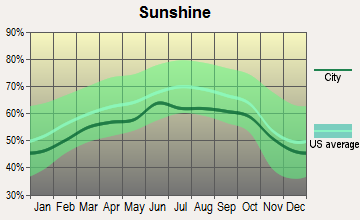
Average climate in Greater Landover, Maryland
Based on data reported by over 4,000 weather stations
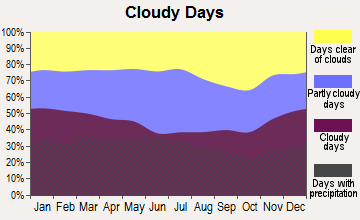
(lower is better)
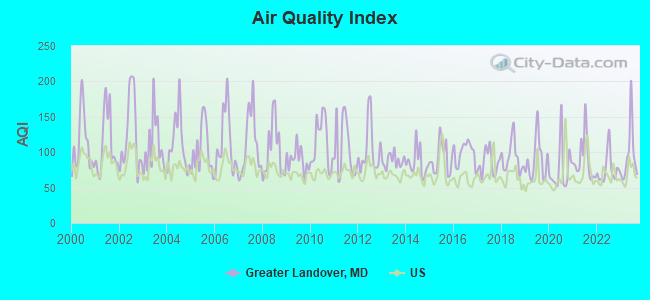
Air Quality Index (AQI) level in 2023 was 95.6. This is worse than average.
| City: | 95.6 |
| U.S.: | 72.6 |
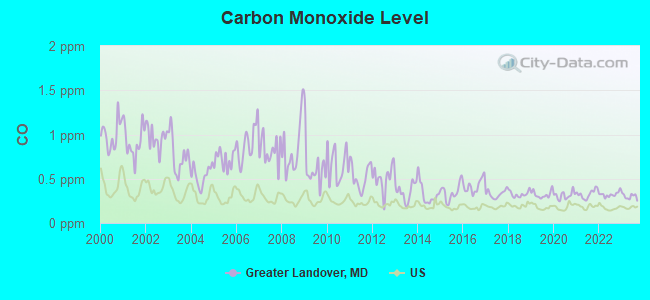
Carbon Monoxide (CO) [ppm] level in 2023 was 0.300. This is about average. Closest monitor was 0.9 miles away from the city center.
| City: | 0.300 |
| U.S.: | 0.251 |
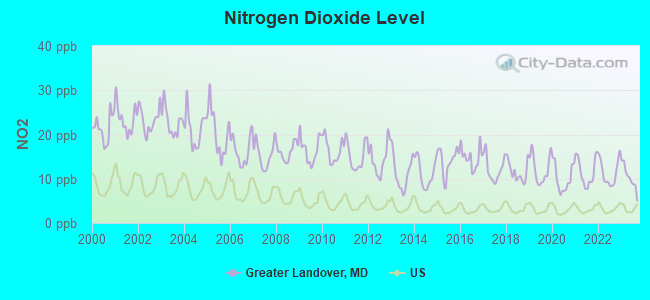
Nitrogen Dioxide (NO2) [ppb] level in 2023 was 10.3. This is significantly worse than average. Closest monitor was 0.9 miles away from the city center.
| City: | 10.3 |
| U.S.: | 5.1 |
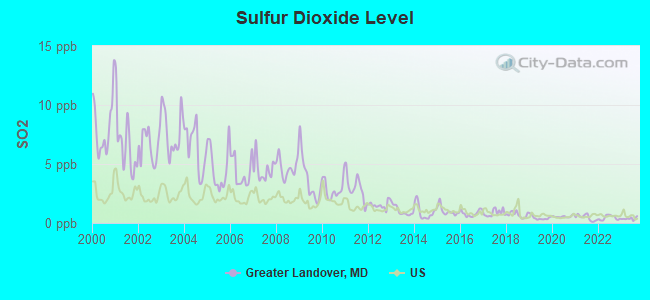
Sulfur Dioxide (SO2) [ppb] level in 2023 was 0.374. This is significantly better than average. Closest monitor was 0.9 miles away from the city center.
| City: | 0.374 |
| U.S.: | 1.515 |
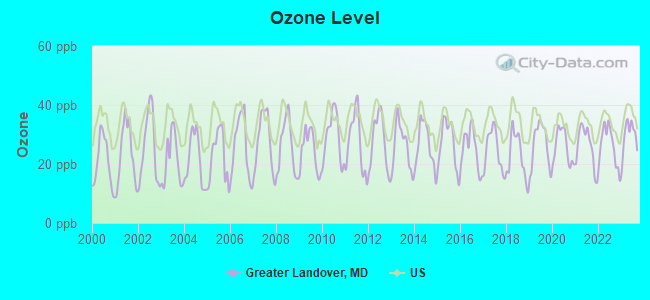
Ozone [ppb] level in 2023 was 29.5. This is about average. Closest monitor was 0.9 miles away from the city center.
| City: | 29.5 |
| U.S.: | 33.3 |
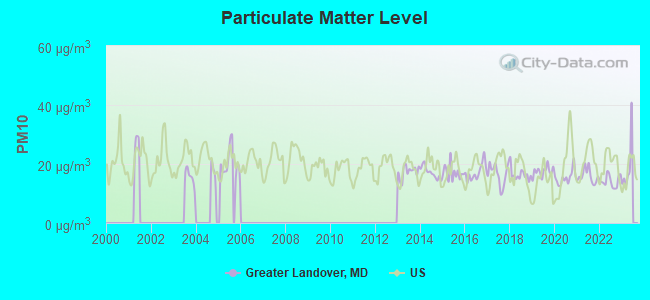
Particulate Matter (PM10) [µg/m3] level in 2022 was 14.2. This is better than average. Closest monitor was 2.5 miles away from the city center.
| City: | 14.2 |
| U.S.: | 19.2 |
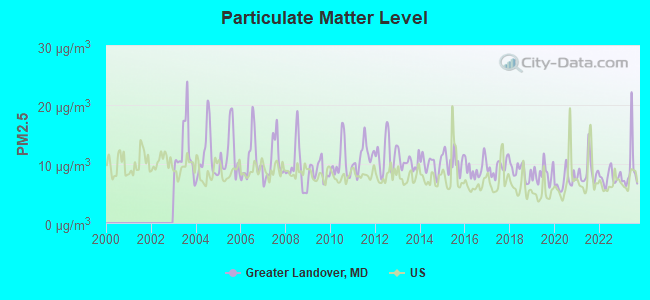
Particulate Matter (PM2.5) [µg/m3] level in 2023 was 9.18. This is about average. Closest monitor was 2.7 miles away from the city center.
| City: | 9.18 |
| U.S.: | 8.11 |
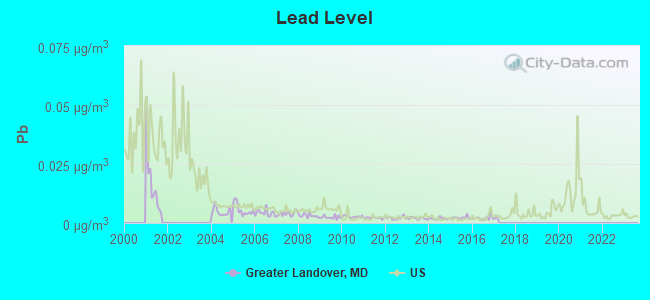
Lead (Pb) [µg/m3] level in 2016 was 0.00212. This is significantly better than average. Closest monitor was 0.9 miles away from the city center.
| City: | 0.00212 |
| U.S.: | 0.00931 |
Tornado activity:
Greater Landover-area historical tornado activity is slightly above Maryland state average. It is 10% greater than the overall U.S. average.
On 9/24/2001, a category F3 (max. wind speeds 158-206 mph) tornado 5.0 miles away from the Greater Landover place center killed 2 people and injured 55 people and caused $101 million in damages.
On 4/28/2002, a category F4 (max. wind speeds 207-260 mph) tornado 30.3 miles away from the place center killed 3 people and injured 122 people and caused $124 million in damages.
Earthquake activity:
Greater Landover-area historical earthquake activity is significantly above Maryland state average. It is 58% smaller than the overall U.S. average.On 8/23/2011 at 17:51:04, a magnitude 5.8 (5.8 MW, Depth: 3.7 mi, Class: Moderate, Intensity: VI - VII) earthquake occurred 90.3 miles away from Greater Landover center
On 1/16/1994 at 01:49:16, a magnitude 4.6 (4.6 MB, 4.6 LG, Depth: 3.1 mi, Class: Light, Intensity: IV - V) earthquake occurred 107.3 miles away from Greater Landover center
On 8/25/2011 at 05:07:52, a magnitude 4.5 (4.5 ML, Depth: 4.2 mi) earthquake occurred 89.4 miles away from the city center
On 12/9/2003 at 20:59:18, a magnitude 4.5 (4.5 ML, Depth: 6.2 mi) earthquake occurred 103.2 miles away from Greater Landover center
On 12/9/2003 at 20:59:14, a magnitude 4.5 (4.5 MB, 4.5 LG) earthquake occurred 107.7 miles away from Greater Landover center
On 9/25/1998 at 19:52:52, a magnitude 5.2 (4.8 MB, 4.3 MS, 5.2 LG, 4.5 MW, Depth: 3.1 mi) earthquake occurred 256.6 miles away from Greater Landover center
Magnitude types: regional Lg-wave magnitude (LG), body-wave magnitude (MB), local magnitude (ML), surface-wave magnitude (MS), moment magnitude (MW)
Natural disasters:
The number of natural disasters in Prince George's County (16) is near the US average (15).Major Disasters (Presidential) Declared: 11
Emergencies Declared: 5
Causes of natural disasters: Hurricanes: 5, Winter Storms: 5, Snowstorms: 3, Floods: 2, Storms: 2, Tropical Storms: 2, Blizzard: 1, Heavy Rain: 1, Ice Storm: 1, Snowfall: 1 (Note: some incidents may be assigned to more than one category).
Hospitals and medical centers near Greater Landover:
- GLADYS SPELLMAN SPEC. HOSP. (Nursing Home, about 2 miles away; CHEVERLY, MD)
- FMC - PRINCE GEORGES COUNTY DIALYSIS (Dialysis Facility, about 2 miles away; LANHAM, MD)
- PRINCE GEORGES HOSPITAL CENTER Acute Care Hospitals (about 3 miles away; CHEVERLY, MD)
- CAPITAL HOSPICE (Hospital, about 3 miles away; LARGO, MD)
- METRO HOMES (Hospital, about 3 miles away; WASHINGTON, DC)
- DAVITA - LEE STREET DIALYSIS (Dialysis Facility, about 3 miles away; WASHINGTON, DC)
- B R A (Hospital, about 3 miles away; WASHINGTON, DC)
Amtrak stations near Greater Landover:
- 3 miles: NEW CARROLLTON (4300 GARDEN CITY DR.) . Services: ticket office, fully wheelchair accessible, enclosed waiting area, public restrooms, public payphones, snack bar, ATM, paid short-term parking, paid long-term parking, call for car rental service, taxi stand, public transit connection.
- 7 miles: WASHINGTON (50 MASSACHUSETTS AVE. N.E.) . Services: ticket office, fully wheelchair accessible, enclosed waiting area, public restrooms, public payphones, full-service food facilities and snack bar, ATM, paid short-term parking, paid long-term parking, car rental agency, taxi stand, public transit connection.
- 13 miles: ALEXANDRIA (110 CALLAHAN DR.) . Services: ticket office, partially wheelchair accessible, enclosed waiting area, public restrooms, public payphones, vending machines, ATM, free short-term parking, free long-term parking, call for car rental service, call for taxi service, public transit connection.
Colleges/universities with over 2000 students nearest to Greater Landover:
- Prince George's Community College (about 5 miles; Largo, MD; Full-time enrollment: 8,537)
- University of Maryland-College Park (about 6 miles; College Park, MD; FT enrollment: 32,734)
- University of Maryland-University College (about 6 miles; Adelphi, MD; FT enrollment: 25,040)
- Catholic University of America (about 7 miles; Washington, DC; FT enrollment: 5,365)
- Strayer University-Maryland (about 8 miles; Suitland, MD; FT enrollment: 2,748)
- Howard University (about 8 miles; Washington, DC; FT enrollment: 7,838)
- Strayer University-Global Region (about 9 miles; Washington, DC; FT enrollment: 2,613)
Points of interest:
Notable locations in Greater Landover: Maryland 50 Industrial Park (A), Cabin Branch Industrial Center (B), Landover Metro Station (C), Prince Georges Country Club (D), Prince Georges County Fire / EMS Company 833 Kentland Volunteer Fire Department (E), Kentland Fire Station Company 33 (F). Display/hide their locations on the map
Shopping Centers: Dodge Park Shopping Center (1), King Shopping Center (2), Capital Corner Shopping Center (3), Landover Mall Shopping Center (4). Display/hide their locations on the map
Churches in Greater Landover include: Kent Baptist Church (A), Eastern Community Church (B), Faith in Christ Church (C), Victory International Worship Center (D), New Home Baptist Church (E), New Jerusalem Baptist Church of Columbia Park (F). Display/hide their locations on the map
Streams, rivers, and creeks: Cattail Branch (A). Display/hide its location on the map
Parks in Greater Landover include: Kentland Park (1), Barlowe Road Park (2). Display/hide their locations on the map
| This place: | 3.0 people |
| Maryland: | 2.6 people |
| This place: | 73.5% |
| Whole state: | 69.1% |
| This place: | 8.3% |
| Whole state: | 5.6% |
Likely homosexual households (counted as self-reported same-sex unmarried-partner households)
- Lesbian couples: 0.4% of all households
- Gay men: 0.2% of all households
| This place: | 17.0% |
| Whole state: | 8.5% |
| This place: | 8.6% |
| Whole state: | 4.2% |
7 people in other noninstitutional group quarters in 2000
For population 15 years and over in Greater Landover:
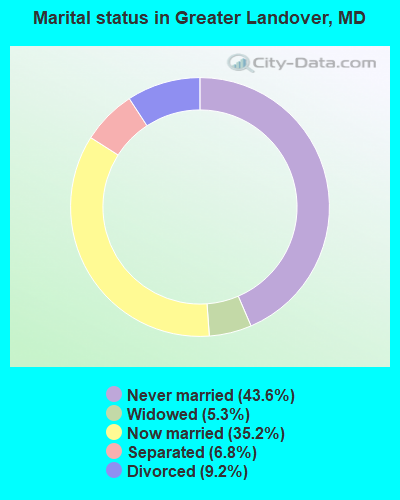
- Never married: 43.6%
- Now married: 35.2%
- Separated: 6.8%
- Widowed: 5.3%
- Divorced: 9.2%
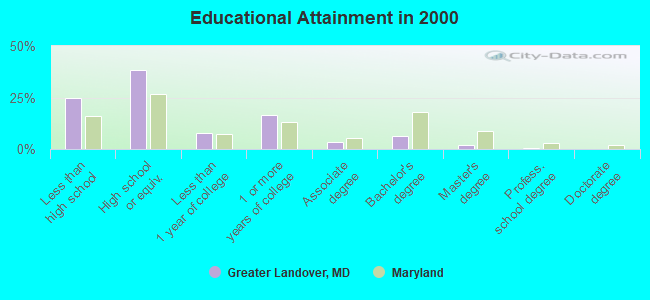
For population 25 years and over in Greater Landover:
- High school or higher: 75.2%
- Bachelor's degree or higher: 8.9%
- Graduate or professional degree: 2.5%
- Unemployed: 10.9%
- Mean travel time to work (commute): 33.9 minutes
| Here: | 9.8 |
| Maryland average: | 12.7 |
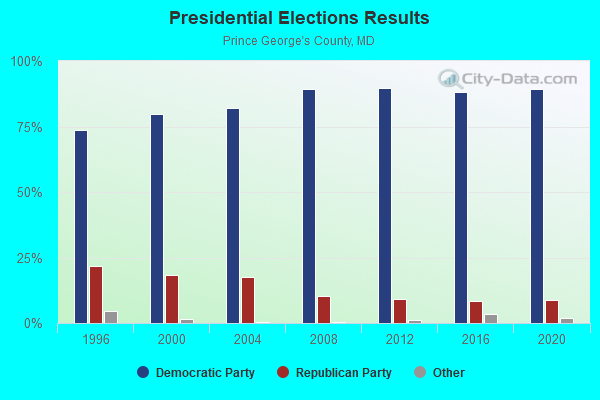
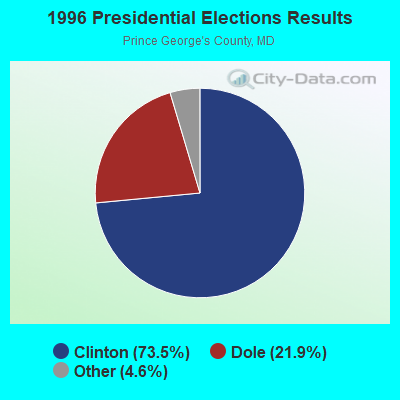
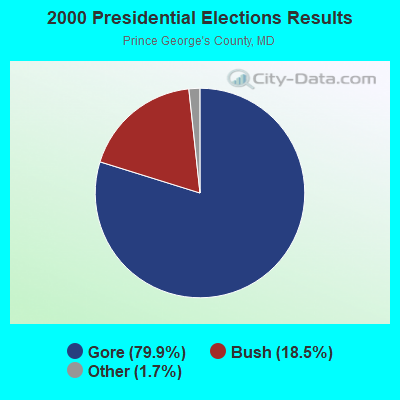
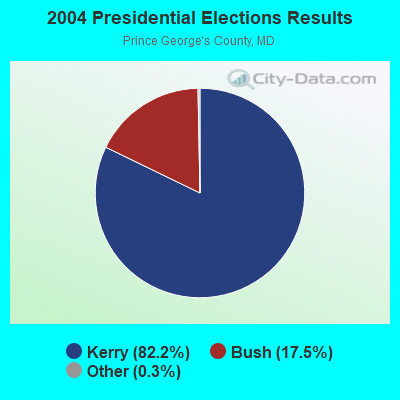
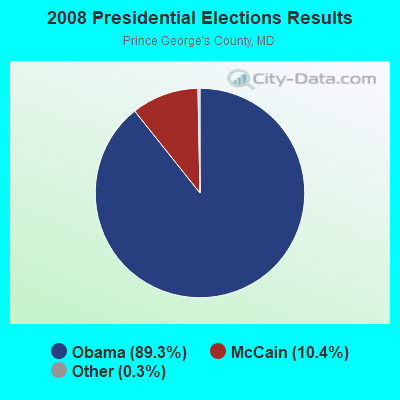

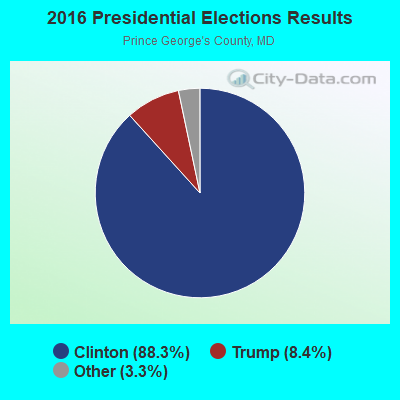
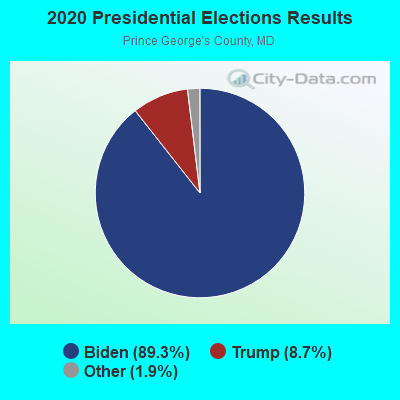
Graphs represent county-level data. Detailed 2008 Election Results
Religion statistics for Greater Landover, MD (based on Prince George's County data)
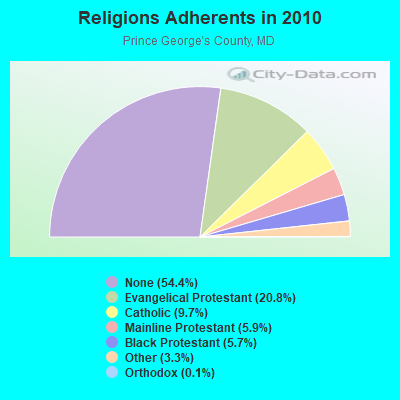
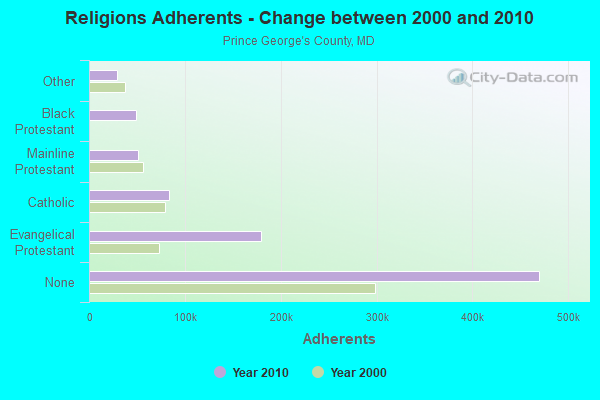
| Religion | Adherents | Congregations |
|---|---|---|
| Evangelical Protestant | 179,374 | 430 |
| Catholic | 83,959 | 35 |
| Mainline Protestant | 51,153 | 156 |
| Black Protestant | 48,984 | 66 |
| Other | 28,743 | 57 |
| Orthodox | 1,218 | 6 |
| None | 469,989 | - |
Food Environment Statistics:
| Prince George's County: | 1.70 / 10,000 pop. |
| Maryland: | 1.96 / 10,000 pop. |
| Here: | 0.02 / 10,000 pop. |
| Maryland: | 0.07 / 10,000 pop. |
| Prince George's County: | 1.60 / 10,000 pop. |
| State: | 1.22 / 10,000 pop. |
| Prince George's County: | 1.66 / 10,000 pop. |
| State: | 2.05 / 10,000 pop. |
| Prince George's County: | 3.24 / 10,000 pop. |
| State: | 5.40 / 10,000 pop. |
| Prince George's County: | 10.5% |
| Maryland: | 9.1% |
| This county: | 30.7% |
| Maryland: | 26.7% |
| Prince George's County: | 16.7% |
| Maryland: | 15.5% |
6.37% of this county's 2021 resident taxpayers lived in other counties in 2020 ($55,200 average adjusted gross income)
| Here: | 6.37% |
| Maryland average: | 7.42% |
0.04% of residents moved from foreign countries ($466 average AGI)
Prince George's County: 0.04% Maryland average: 0.05%
Top counties from which taxpayers relocated into this county between 2020 and 2021:
| from District of Columbia, DC | |
| from Montgomery County, MD | |
| from Anne Arundel County, MD |
8.15% of this county's 2020 resident taxpayers moved to other counties in 2021 ($59,145 average adjusted gross income)
| Here: | 8.15% |
| Maryland average: | 7.91% |
0.05% of residents moved to foreign countries ($401 average AGI)
Prince George's County: 0.05% Maryland average: 0.04%
Top counties to which taxpayers relocated from this county between 2020 and 2021:
| to Montgomery County, MD | |
| to Anne Arundel County, MD | |
| to District of Columbia, DC |
Strongest AM radio stations in Greater Landover:
- WPGC (1580 AM; 50 kW; MORNINGSIDE, MD; Owner: INFINITY WPGC(AM), INC.)
- WTEM (980 AM; 50 kW; WASHINGTON, DC; Owner: AMFM RADIO LICENSES, L.L.C.)
- WTOP (1500 AM; 50 kW; WASHINGTON, DC; Owner: BONNEVILLE HOLDING COMPANY)
- WBIS (1190 AM; 50 kW; ANNAPOLIS, MD; Owner: NATIONS RADIO, LLC)
- WUST (1120 AM; daytime; 20 kW; WASHINGTON, DC)
- WWGB (1030 AM; daytime; 50 kW; INDIAN HEAD, MD; Owner: GOOD BODY MEDIA, LLC)
- WCBM (680 AM; 50 kW; BALTIMORE, MD; Owner: WCBM MARYLAND, INC.)
- WMET (1150 AM; 50 kW; GAITHERSBURG, MD; Owner: BELTWAY ACQUISITION CORPORATION)
- WBAL (1090 AM; 50 kW; BALTIMORE, MD; Owner: HEARST RADIO, INC.)
- WYCB (1340 AM; 1 kW; WASHINGTON, DC; Owner: RADIO ONE LICENSES, LLC)
- WKDL (730 AM; 8 kW; ALEXANDRIA, VA; Owner: MEGA COMMUNICATIONS OF ALEXANDRIA LICENSEE, LLC)
- WWRC (1260 AM; 5 kW; WASHINGTON, DC; Owner: AMFM RADIO LICENSES, L.L.C.)
- WGOP (700 AM; daytime; 25 kW; WALKERSVILLE, MD; Owner: BIRACH BROADCASTING CORPORATION)
Strongest FM radio stations in Greater Landover:
- WPGC-FM (95.5 FM; MORNINGSIDE, MD; Owner: INFINITY BROADCASTING CORPORATION OF MARYLAND)
- WHFS (99.1 FM; ANNAPOLIS, MD; Owner: INFINITY BROADCASTING OPERATIONS, INC.)
- WBIG-FM (100.3 FM; WASHINGTON, DC; Owner: AMFM RADIO LICENSES, L.L.C.)
- WCSP-FM (90.1 FM; WASHINGTON, DC; Owner: NATIONAL CABLE SATELLITE CORPORATION)
- WRQX (107.3 FM; WASHINGTON, DC; Owner: WMAL, INC.)
- WHUR-FM (96.3 FM; WASHINGTON, DC; Owner: THE HOWARD UNIVERSITY)
- WASH (97.1 FM; WASHINGTON, DC; Owner: AMFM RADIO LICENSES, L.L.C.)
- WWDC-FM (101.1 FM; WASHINGTON, DC; Owner: AMFM RADIO LICENSES, L.L.C.)
- WKYS (93.9 FM; WASHINGTON, DC; Owner: RADIO ONE LICENSES, LLC)
- WARW (94.7 FM; BETHESDA, MD; Owner: INFINITY BROADCASTING OPERATIONS, INC.)
- WIHT (99.5 FM; WASHINGTON, DC; Owner: AMFM RADIO LICENSES, L.L.C.)
- WGMS-FM (103.5 FM; WASHINGTON, DC; Owner: BONNEVILLE HOLDING COMPANY)
- WAMU (88.5 FM; WASHINGTON, DC; Owner: THE EXEC. COMM. OF THE BD. OF TRUSTEES OF AMERICAN UNIV.)
- WMMJ (102.3 FM; BETHESDA, MD; Owner: RADIO ONE LICENSES, LLC)
- WETA (90.9 FM; WASHINGTON, DC; Owner: GREATER WASHINGTON EDUCATIONAL TELECOMMUNICATIONS ASSN.)
- WGTS (91.9 FM; TAKOMA PARK, MD; Owner: COLUMBIA UNION COLLEGE BROADCASTING, INC.)
- WAVA (105.1 FM; ARLINGTON, VA; Owner: SALEM MEDIA OF VIRGINIA, INC.)
- WPFW (89.3 FM; WASHINGTON, DC; Owner: PACIFICA FOUNDATION, INC.)
- WFSI (107.9 FM; ANNAPOLIS, MD; Owner: FAMILY STATIONS, INC.)
- WJFK-FM (106.7 FM; MANASSAS, VA; Owner: INFINITY BROADCASTING CORP. OF WASHINGTON, DC)
TV broadcast stations around Greater Landover:
- WBDC-TV (Channel 50; WASHINGTON, DC; Owner: WBDC BROADCASTING, INC.)
- WJLA-TV (Channel 7; WASHINGTON, DC; Owner: ACC LICENSEE, INC.)
- WUSA (Channel 9; WASHINGTON, DC; Owner: THE DETROIT NEWS, INC.)
- WTTG (Channel 5; WASHINGTON, DC; Owner: FOX TELEVISION STATIONS, INC.)
- WHUT-TV (Channel 32; WASHINGTON, DC; Owner: HOWARD UNIVERSITY)
- WETA-TV (Channel 26; WASHINGTON, DC; Owner: THE GREATER WASHINGTON ED TELECOMM. ASSOC)
- WRC-TV (Channel 4; WASHINGTON, DC; Owner: NBC SUBSIDIARY (WRC-TV), INC.)
- WDCA (Channel 20; WASHINGTON, DC; Owner: FOX TELEVISION STATIONS, INC.)
- WZDC-LP (Channel 64; WASHINGTON, DC; Owner: ONDA CAPITAL, INC.)
- WMPT (Channel 22; ANNAPOLIS, MD; Owner: MARYLAND PUBLIC BROADCASTING COMMISSION)
- W28BY (Channel 63; BALTIMORE, MD; Owner: INFORMATION SUPER STATION, L.L.C.)
- WBAL-TV (Channel 11; BALTIMORE, MD; Owner: WBAL HEARST-ARGYLE TV, INC. (CA CORP.))
- WMAR-TV (Channel 2; BALTIMORE, MD; Owner: SCRIPPS HOWARD BROADCASTING COMPANY)
- WNVC (Channel 56; FAIRFAX, VA; Owner: COMMONWEALTH PUBLIC BROADCASTING CORPORATION)
- WBFF (Channel 45; BALTIMORE, MD; Owner: CHESAPEAKE TELEVISION LICENSEE, LLC)
- WNUV (Channel 54; BALTIMORE, MD; Owner: BALTIMORE (WNUV-TV) LICENSEE, INC.)
- WMDO-CA (Channel 30; WASHINGTON, DC; Owner: ENTRAVISION HOLDINGS, LLC)
- WIAV-LP (Channel 58; WASHINGTON, DC; Owner: ASIAVISION, INC.)
- WUTB (Channel 24; BALTIMORE, MD; Owner: FOX TELEVISION STATIONS, INC.)
- WJZ-TV (Channel 13; BALTIMORE, MD; Owner: VIACOM INC.)
- WKRP-LP (Channel 42; WASHINGTON, DC; Owner: CAPITAL MEDIA, LLC)
- WMPB (Channel 67; BALTIMORE, MD; Owner: MARYLAND PUBLIC BROADCASTING COMMISSION)
- W63BP (Channel 63; ANNAPOLIS, MD; Owner: ANNAPOLIS BROADCASTING COMPANY, INC.)
- W61BY (Channel 61; ANNAPOLIS, MD; Owner: ANNAPOLIS BROADCASTING COMPANY, INC.)
- WPXW (Channel 66; MANASSAS, VA; Owner: PAXSON WASHINGTON LICENSE, INC.)
- National Bridge Inventory (NBI) Statistics
- 12Number of bridges
- 161ft / 49.3mTotal length
- $514,000Total costs
- 298,795Total average daily traffic
- 15,825Total average daily truck traffic
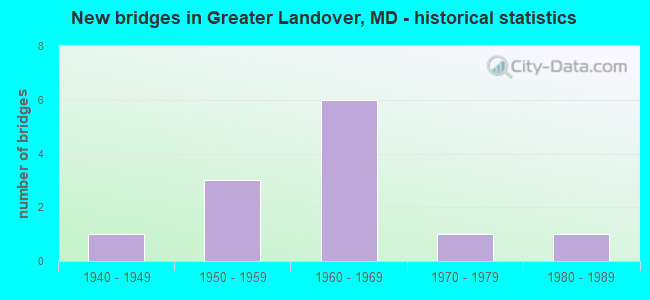
- New bridges - historical statistics
- 11940-1949
- 31950-1959
- 61960-1969
- 11970-1979
- 11980-1989
FCC Registered Microwave Towers:
1- DC-WSH5532A, 6913 Old Landover Rd (Lat: 38.929806 Lon: -76.894000), Type: Pole, Structure height: 30.5 m, Call Sign: WQLH533,
Assigned Frequencies: 11385.0 MHz, 11465.0 MHz, Grant Date: 01/21/2010, Expiration Date: 01/21/2020, Cancellation Date: 01/17/2020, Certifier: Nadja S Sodos-Wallace, Registrant: Sprint Corporation, 12502 Sunrise Valley Drive, M/S: Varesa, Reston, VA 20196, Phone: (800) 572-8256, Fax: (703) 433-4483, Email:
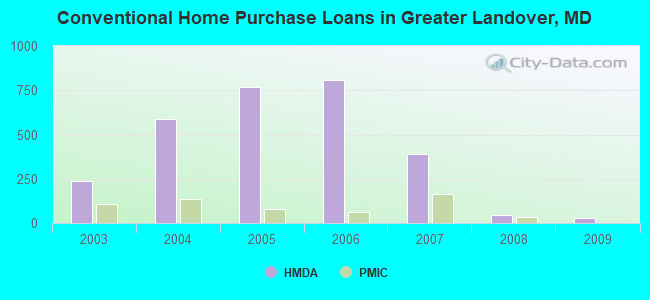
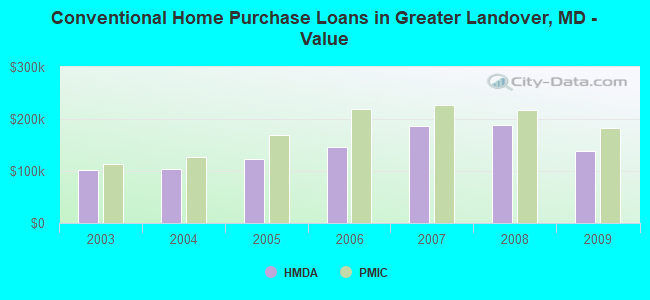
| Home Mortgage Disclosure Act Aggregated Statistics For Year 2009 (Based on 4 full and 3 partial tracts) | ||||||||||||||
| A) FHA, FSA/RHS & VA Home Purchase Loans | B) Conventional Home Purchase Loans | C) Refinancings | D) Home Improvement Loans | E) Loans on Dwellings For 5+ Families | F) Non-occupant Loans on < 5 Family Dwellings (A B C & D) | G) Loans On Manufactured Home Dwelling (A B C & D) | ||||||||
|---|---|---|---|---|---|---|---|---|---|---|---|---|---|---|
| Number | Average Value | Number | Average Value | Number | Average Value | Number | Average Value | Number | Average Value | Number | Average Value | Number | Average Value | |
| LOANS ORIGINATED | 101 | $196,449 | 29 | $137,890 | 220 | $190,182 | 9 | $53,109 | 0 | $0 | 27 | $102,361 | 0 | $0 |
| APPLICATIONS APPROVED, NOT ACCEPTED | 9 | $178,900 | 4 | $86,692 | 32 | $174,167 | 3 | $11,603 | 0 | $0 | 4 | $80,318 | 0 | $0 |
| APPLICATIONS DENIED | 32 | $184,662 | 12 | $186,564 | 187 | $180,830 | 27 | $60,848 | 0 | $0 | 25 | $128,300 | 1 | $69,940 |
| APPLICATIONS WITHDRAWN | 30 | $178,087 | 6 | $95,368 | 89 | $197,647 | 8 | $70,908 | 1 | $3,254,000 | 14 | $146,441 | 0 | $0 |
| FILES CLOSED FOR INCOMPLETENESS | 4 | $145,838 | 1 | $71,000 | 32 | $197,988 | 3 | $92,257 | 0 | $0 | 3 | $173,020 | 0 | $0 |
Detailed HMDA statistics for the following Tracts: 8032.00 , 8033.00, 8034.01, 8034.02, 8035.08, 8035.09, 8041.02
| Private Mortgage Insurance Companies Aggregated Statistics For Year 2009 (Based on 3 full and 2 partial tracts) | ||||||
| A) Conventional Home Purchase Loans | B) Refinancings | C) Non-occupant Loans on < 5 Family Dwellings (A & B) | ||||
|---|---|---|---|---|---|---|
| Number | Average Value | Number | Average Value | Number | Average Value | |
| LOANS ORIGINATED | 1 | $182,460 | 4 | $173,208 | 1 | $199,510 |
| APPLICATIONS APPROVED, NOT ACCEPTED | 1 | $204,840 | 1 | $296,910 | 0 | $0 |
| APPLICATIONS DENIED | 0 | $0 | 2 | $139,500 | 0 | $0 |
| APPLICATIONS WITHDRAWN | 0 | $0 | 0 | $0 | 0 | $0 |
| FILES CLOSED FOR INCOMPLETENESS | 0 | $0 | 1 | $246,800 | 0 | $0 |
Detailed PMIC statistics for the following Tracts: 8032.00 , 8033.00, 8034.01, 8034.02, 8035.08, 8035.09, 8041.02
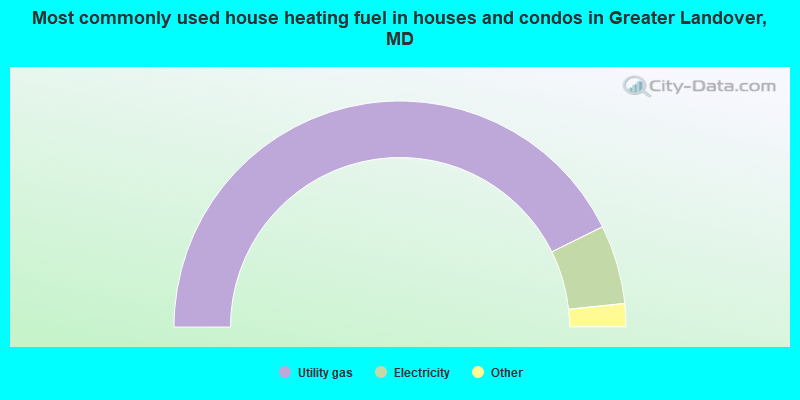
- 85.4%Utility gas
- 11.3%Electricity
- 1.8%Fuel oil, kerosene, etc.
- 1.1%Bottled, tank, or LP gas
- 0.2%Other fuel
- 0.2%Wood
- 0.1%Coal or coke
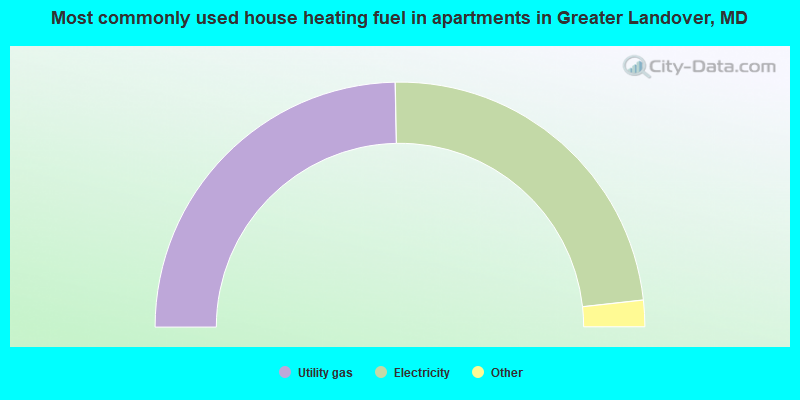
- 49.4%Utility gas
- 47.1%Electricity
- 1.5%Bottled, tank, or LP gas
- 1.2%Fuel oil, kerosene, etc.
- 0.8%No fuel used
Greater Landover compared to Maryland state average:
- Black race population percentage significantly above state average.
- Hispanic race population percentage significantly below state average.
- Median age below state average.
- Foreign-born population percentage below state average.
- Renting percentage significantly below state average.
- Length of stay since moving in significantly above state average.
- Number of rooms per house significantly below state average.
- House age significantly below state average.
- Percentage of population with a bachelor's degree or higher significantly below state average.
Greater Landover on our top lists:
- #6 on the list of "Top 101 cities with largest percentage of females in occupations: secretaries and administrative assistants (population 5,000+)"
- #6 on the list of "Top 101 cities with largest percentage of males in industries: u. s. postal service (population 5,000+)"
- #10 on the list of "Top 101 cities with largest percentage of males in occupations: other protective service workers including supervisors (population 5,000+)"
- #11 on the list of "Top 101 cities with largest percentage of males in industries: other transportation, and support activities, and couriers (population 5,000+)"
- #12 on the list of "Top 101 cities with largest percentage of males in occupations: material recording, scheduling, dispatching, and distributing workers (population 5,000+)"
- #13 on the list of "Top 101 cities with largest percentage of males in occupations: motor vehicle operators except bus and truck drivers (population 5,000+)"
- #14 on the list of "Top 101 cities with largest percentage of females in occupations: other protective service workers including supervisors (population 5,000+)"
- #17 on the list of "Top 101 cities with largest percentage of females in industries: u. s. postal service (population 5,000+)"
- #17 on the list of "Top 101 cities with the most people taking subway or elevated to work (population 5,000+)"
- #21 on the list of "Top 101 cities with largest percentage of females in industries: data processing, libraries, and other information services (population 5,000+)"
- #23 on the list of "Top 101 cities with largest percentage of males in occupations: other office and administrative support workers including supervisors (population 5,000+)"
- #27 on the list of "Top 101 cities with largest percentage of males in industries: furniture and home furnishing merchant wholesalers (population 5,000+)"
- #37 on the list of "Top 101 cities with largest percentage of females in industries: religious, grantmaking, civic, professional, and similar organizations (population 5,000+)"
- #41 on the list of "Top 101 cities with largest percentage of females in industries: other transportation, and support activities, and couriers (population 5,000+)"
- #48 on the list of "Top 101 cities with largest percentage of males in industries: food and beverage stores (population 5,000+)"
- #51 on the list of "Top 101 cities with largest percentage of males in industries: personal and laundry services (population 5,000+)"
- #51 on the list of "Top 101 cities with largest percentage of males in industries: religious, grantmaking, civic, professional, and similar organizations (population 5,000+)"
- #66 on the list of "Top 101 cities with largest percentage of males in industries: furniture and home furnishings, and household appliance stores (population 5,000+)"
- #68 on the list of "Top 101 cities with largest percentage of females in industries: public administration (population 5,000+)"
- #96 on the list of "Top 101 cities with largest percentage of females in industries: other direct selling establishments (population 5,000+)"
- #44 (20785) on the list of "Top 101 zip codes with the largest percentage of Subsaharan African first ancestries"
- #73 (20785) on the list of "Top 101 zip codes with the lowest 2012 average reported profit/loss from business (pop 5,000+)"
- #5 on the list of "Top 101 counties with highest percentage of residents voting for Obama (Democrat) in the 2012 Presidential Election"
- #12 on the list of "Top 101 counties with the highest number of infant deaths per 1000 residents 2007-2013 (pop. 50,000+)"
- #13 on the list of "Top 101 counties with the highest average weight of females"
- #14 on the list of "Top 101 counties with the highest Nitrogen Dioxide air pollution readings in 2012 (ppm)"
- #14 on the list of "Top 101 counties with the most Black Protestant adherents"