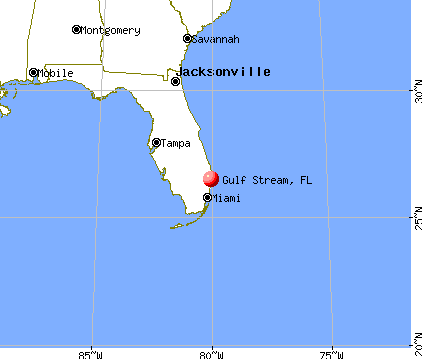
Gulf Stream, Florida Submit your own pictures of this town and show them to the world
OSM Map
General Map
Google Map
MSN Map
OSM Map
General Map
Google Map
MSN Map
OSM Map
General Map
Google Map
MSN Map
OSM Map
General Map
Google Map
MSN Map
Please wait while loading the map...
Population in 2022: 953 (100% urban, 0% rural). Population change since 2000: +33.1%Males: 478 Females: 475
March 2022 cost of living index in Gulf Stream: 110.1 (more than average, U.S. average is 100) Percentage of residents living in poverty in 2022: 8.3%
Profiles of local businesses
Business Search - 14 Million verified businesses
Data:
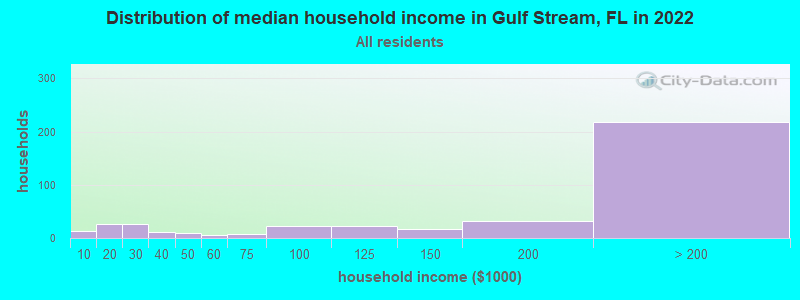
Median household income ($)
Median household income (% change since 2000)
Household income diversity
Ratio of average income to average house value (%)
Ratio of average income to average rent
Median household income ($) - White
Median household income ($) - Black or African American
Median household income ($) - Asian
Median household income ($) - Hispanic or Latino
Median household income ($) - American Indian and Alaska Native
Median household income ($) - Multirace
Median household income ($) - Other Race
Median household income for houses/condos with a mortgage ($)
Median household income for apartments without a mortgage ($)
Races - White alone (%)
Races - White alone (% change since 2000)
Races - Black alone (%)
Races - Black alone (% change since 2000)
Races - American Indian alone (%)
Races - American Indian alone (% change since 2000)
Races - Asian alone (%)
Races - Asian alone (% change since 2000)
Races - Hispanic (%)
Races - Hispanic (% change since 2000)
Races - Native Hawaiian and Other Pacific Islander alone (%)
Races - Native Hawaiian and Other Pacific Islander alone (% change since 2000)
Races - Two or more races (%)
Races - Two or more races (% change since 2000)
Races - Other race alone (%)
Races - Other race alone (% change since 2000)
Racial diversity
Unemployment (%)
Unemployment (% change since 2000)
Unemployment (%) - White
Unemployment (%) - Black or African American
Unemployment (%) - Asian
Unemployment (%) - Hispanic or Latino
Unemployment (%) - American Indian and Alaska Native
Unemployment (%) - Multirace
Unemployment (%) - Other Race
Population density (people per square mile)
Population - Males (%)
Population - Females (%)
Population - Males (%) - White
Population - Males (%) - Black or African American
Population - Males (%) - Asian
Population - Males (%) - Hispanic or Latino
Population - Males (%) - American Indian and Alaska Native
Population - Males (%) - Multirace
Population - Males (%) - Other Race
Population - Females (%) - White
Population - Females (%) - Black or African American
Population - Females (%) - Asian
Population - Females (%) - Hispanic or Latino
Population - Females (%) - American Indian and Alaska Native
Population - Females (%) - Multirace
Population - Females (%) - Other Race
Coronavirus confirmed cases (Apr 16, 2024)
Deaths caused by coronavirus (Apr 16, 2024)
Coronavirus confirmed cases (per 100k population) (Apr 16, 2024)
Deaths caused by coronavirus (per 100k population) (Apr 16, 2024)
Daily increase in number of cases (Apr 16, 2024)
Weekly increase in number of cases (Apr 16, 2024)
Cases doubled (in days) (Apr 16, 2024)
Hospitalized patients (Apr 18, 2022)
Negative test results (Apr 18, 2022)
Total test results (Apr 18, 2022)
COVID Vaccine doses distributed (per 100k population) (Sep 19, 2023)
COVID Vaccine doses administered (per 100k population) (Sep 19, 2023)
COVID Vaccine doses distributed (Sep 19, 2023)
COVID Vaccine doses administered (Sep 19, 2023)
Likely homosexual households (%)
Likely homosexual households (% change since 2000)
Likely homosexual households - Lesbian couples (%)
Likely homosexual households - Lesbian couples (% change since 2000)
Likely homosexual households - Gay men (%)
Likely homosexual households - Gay men (% change since 2000)
Cost of living index
Median gross rent ($)
Median contract rent ($)
Median monthly housing costs ($)
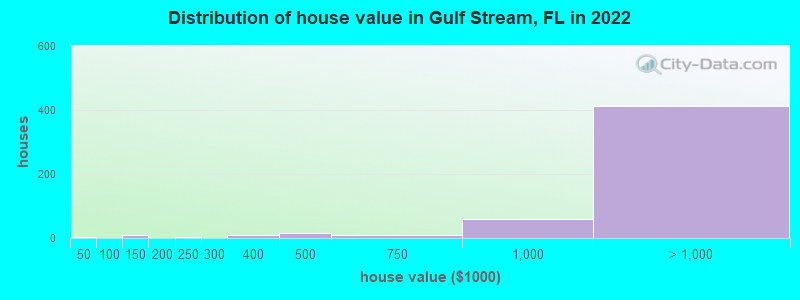
Median house or condo value ($)
Median house or condo value ($ change since 2000)
Mean house or condo value by units in structure - 1, detached ($)
Mean house or condo value by units in structure - 1, attached ($)
Mean house or condo value by units in structure - 2 ($)
Mean house or condo value by units in structure by units in structure - 3 or 4 ($)
Mean house or condo value by units in structure - 5 or more ($)
Mean house or condo value by units in structure - Boat, RV, van, etc. ($)
Mean house or condo value by units in structure - Mobile home ($)
Median house or condo value ($) - White
Median house or condo value ($) - Black or African American
Median house or condo value ($) - Asian
Median house or condo value ($) - Hispanic or Latino
Median house or condo value ($) - American Indian and Alaska Native
Median house or condo value ($) - Multirace
Median house or condo value ($) - Other Race
Median resident age
Resident age diversity
Median resident age - Males
Median resident age - Females
Median resident age - White
Median resident age - Black or African American
Median resident age - Asian
Median resident age - Hispanic or Latino
Median resident age - American Indian and Alaska Native
Median resident age - Multirace
Median resident age - Other Race
Median resident age - Males - White
Median resident age - Males - Black or African American
Median resident age - Males - Asian
Median resident age - Males - Hispanic or Latino
Median resident age - Males - American Indian and Alaska Native
Median resident age - Males - Multirace
Median resident age - Males - Other Race
Median resident age - Females - White
Median resident age - Females - Black or African American
Median resident age - Females - Asian
Median resident age - Females - Hispanic or Latino
Median resident age - Females - American Indian and Alaska Native
Median resident age - Females - Multirace
Median resident age - Females - Other Race
Commute - mean travel time to work (minutes)
Travel time to work - Less than 5 minutes (%)
Travel time to work - Less than 5 minutes (% change since 2000)
Travel time to work - 5 to 9 minutes (%)
Travel time to work - 5 to 9 minutes (% change since 2000)
Travel time to work - 10 to 19 minutes (%)
Travel time to work - 10 to 19 minutes (% change since 2000)
Travel time to work - 20 to 29 minutes (%)
Travel time to work - 20 to 29 minutes (% change since 2000)
Travel time to work - 30 to 39 minutes (%)
Travel time to work - 30 to 39 minutes (% change since 2000)
Travel time to work - 40 to 59 minutes (%)
Travel time to work - 40 to 59 minutes (% change since 2000)
Travel time to work - 60 to 89 minutes (%)
Travel time to work - 60 to 89 minutes (% change since 2000)
Travel time to work - 90 or more minutes (%)
Travel time to work - 90 or more minutes (% change since 2000)
Marital status - Never married (%)
Marital status - Now married (%)
Marital status - Separated (%)
Marital status - Widowed (%)
Marital status - Divorced (%)
Median family income ($)
Median family income (% change since 2000)
Median non-family income ($)
Median non-family income (% change since 2000)
Median per capita income ($)
Median per capita income (% change since 2000)
Median family income ($) - White
Median family income ($) - Black or African American
Median family income ($) - Asian
Median family income ($) - Hispanic or Latino
Median family income ($) - American Indian and Alaska Native
Median family income ($) - Multirace
Median family income ($) - Other Race
Median year house/condo built
Median year apartment built
Year house built - Built 2005 or later (%)
Year house built - Built 2000 to 2004 (%)
Year house built - Built 1990 to 1999 (%)
Year house built - Built 1980 to 1989 (%)
Year house built - Built 1970 to 1979 (%)
Year house built - Built 1960 to 1969 (%)
Year house built - Built 1950 to 1959 (%)
Year house built - Built 1940 to 1949 (%)
Year house built - Built 1939 or earlier (%)
Average household size
Household density (households per square mile)
Average household size - White
Average household size - Black or African American
Average household size - Asian
Average household size - Hispanic or Latino
Average household size - American Indian and Alaska Native
Average household size - Multirace
Average household size - Other Race
Occupied housing units (%)
Vacant housing units (%)
Owner occupied housing units (%)
Renter occupied housing units (%)
Vacancy status - For rent (%)
Vacancy status - For sale only (%)
Vacancy status - Rented or sold, not occupied (%)
Vacancy status - For seasonal, recreational, or occasional use (%)
Vacancy status - For migrant workers (%)
Vacancy status - Other vacant (%)
Residents with income below the poverty level (%)
Residents with income below 50% of the poverty level (%)
Children below poverty level (%)
Poor families by family type - Married-couple family (%)
Poor families by family type - Male, no wife present (%)
Poor families by family type - Female, no husband present (%)
Poverty status for native-born residents (%)
Poverty status for foreign-born residents (%)
Poverty among high school graduates not in families (%)
Poverty among people who did not graduate high school not in families (%)
Residents with income below the poverty level (%) - White
Residents with income below the poverty level (%) - Black or African American
Residents with income below the poverty level (%) - Asian
Residents with income below the poverty level (%) - Hispanic or Latino
Residents with income below the poverty level (%) - American Indian and Alaska Native
Residents with income below the poverty level (%) - Multirace
Residents with income below the poverty level (%) - Other Race
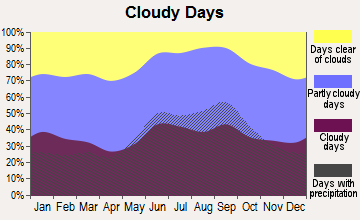
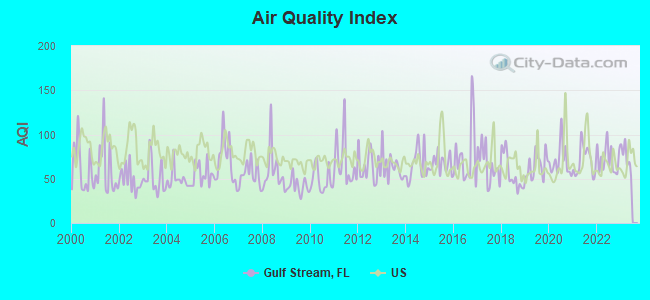
Air pollution - Air Quality Index (AQI)
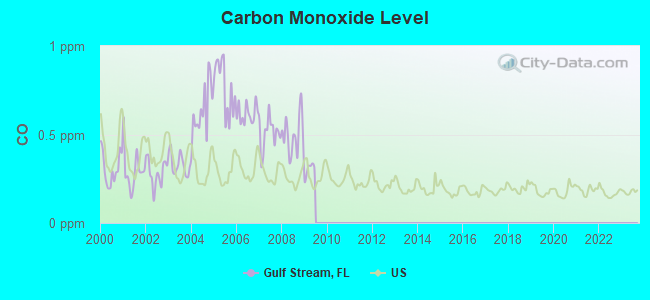
Air pollution - CO
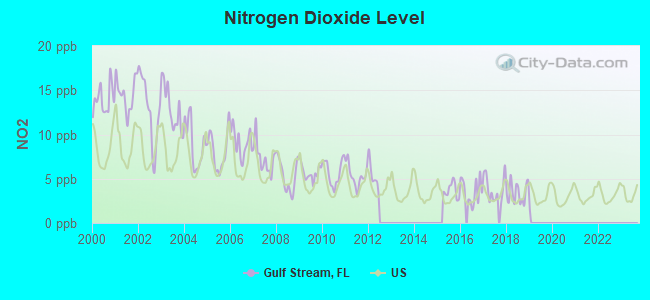
Air pollution - NO2
Air pollution - SO2
Air pollution - Ozone
Air pollution - PM10
Air pollution - PM25
Air pollution - Pb
Crime - Murders per 100,000 population
Crime - Rapes per 100,000 population
Crime - Robberies per 100,000 population
Crime - Assaults per 100,000 population
Crime - Burglaries per 100,000 population
Crime - Thefts per 100,000 population
Crime - Auto thefts per 100,000 population
Crime - Arson per 100,000 population
Crime - City-data.com crime index
Crime - Violent crime index
Crime - Property crime index
Crime - Murders per 100,000 population (5 year average)
Crime - Rapes per 100,000 population (5 year average)
Crime - Robberies per 100,000 population (5 year average)
Crime - Assaults per 100,000 population (5 year average)
Crime - Burglaries per 100,000 population (5 year average)
Crime - Thefts per 100,000 population (5 year average)
Crime - Auto thefts per 100,000 population (5 year average)
Crime - Arson per 100,000 population (5 year average)
Crime - City-data.com crime index (5 year average)
Crime - Violent crime index (5 year average)
Crime - Property crime index (5 year average)
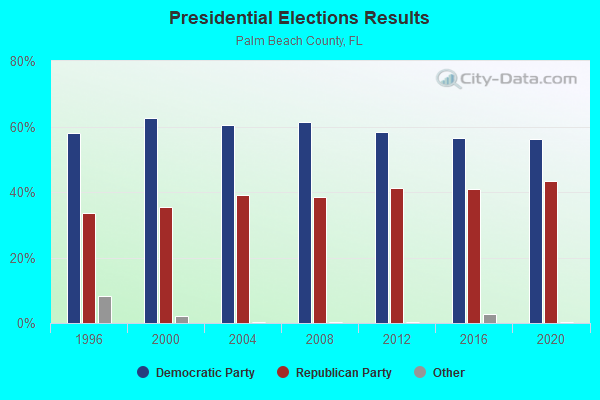
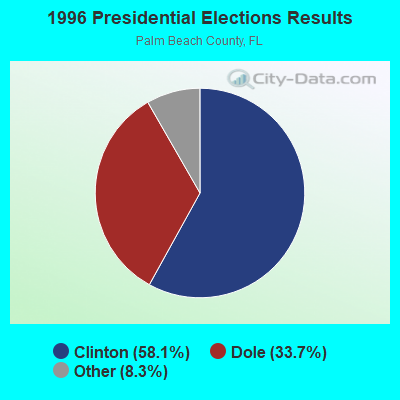
1996 Presidential Elections Results (%) - Democratic Party (Clinton)
1996 Presidential Elections Results (%) - Republican Party (Dole)
1996 Presidential Elections Results (%) - Other
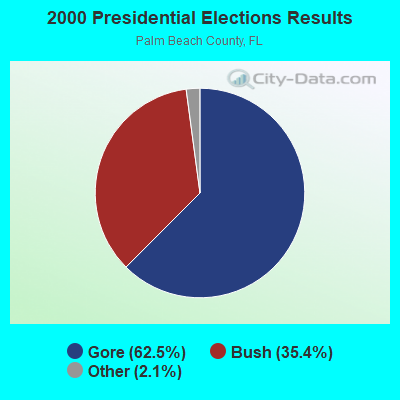
2000 Presidential Elections Results (%) - Democratic Party (Gore)
2000 Presidential Elections Results (%) - Republican Party (Bush)
2000 Presidential Elections Results (%) - Other
2004 Presidential Elections Results (%) - Democratic Party (Kerry)
2004 Presidential Elections Results (%) - Republican Party (Bush)
2004 Presidential Elections Results (%) - Other
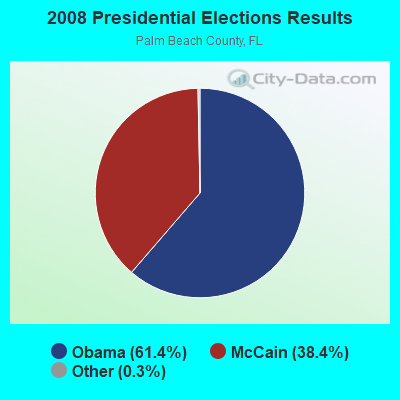
2008 Presidential Elections Results (%) - Democratic Party (Obama)
2008 Presidential Elections Results (%) - Republican Party (McCain)
2008 Presidential Elections Results (%) - Other
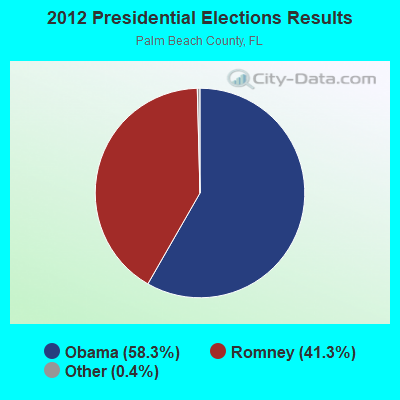
2012 Presidential Elections Results (%) - Democratic Party (Obama)
2012 Presidential Elections Results (%) - Republican Party (Romney)
2012 Presidential Elections Results (%) - Other
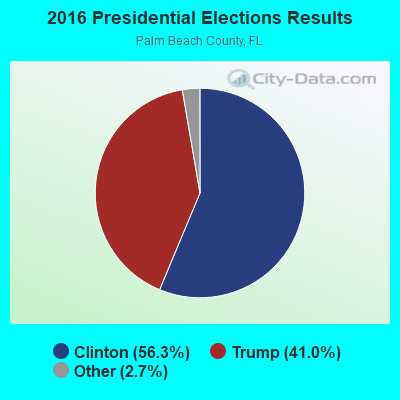
2016 Presidential Elections Results (%) - Democratic Party (Clinton)
2016 Presidential Elections Results (%) - Republican Party (Trump)
2016 Presidential Elections Results (%) - Other
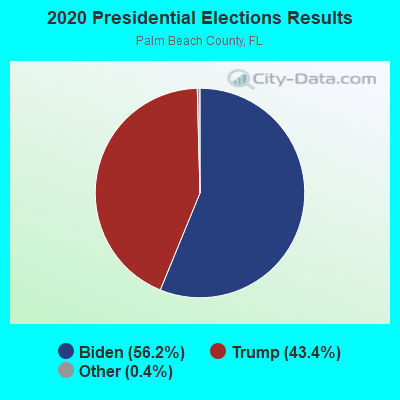
2020 Presidential Elections Results (%) - Democratic Party (Biden)
2020 Presidential Elections Results (%) - Republican Party (Trump)
2020 Presidential Elections Results (%) - Other
Ancestries Reported - Arab (%)
Ancestries Reported - Czech (%)
Ancestries Reported - Danish (%)
Ancestries Reported - Dutch (%)
Ancestries Reported - English (%)
Ancestries Reported - French (%)
Ancestries Reported - French Canadian (%)
Ancestries Reported - German (%)
Ancestries Reported - Greek (%)
Ancestries Reported - Hungarian (%)
Ancestries Reported - Irish (%)
Ancestries Reported - Italian (%)
Ancestries Reported - Lithuanian (%)
Ancestries Reported - Norwegian (%)
Ancestries Reported - Polish (%)
Ancestries Reported - Portuguese (%)
Ancestries Reported - Russian (%)
Ancestries Reported - Scotch-Irish (%)
Ancestries Reported - Scottish (%)
Ancestries Reported - Slovak (%)
Ancestries Reported - Subsaharan African (%)
Ancestries Reported - Swedish (%)
Ancestries Reported - Swiss (%)
Ancestries Reported - Ukrainian (%)
Ancestries Reported - United States (%)
Ancestries Reported - Welsh (%)
Ancestries Reported - West Indian (%)
Ancestries Reported - Other (%)
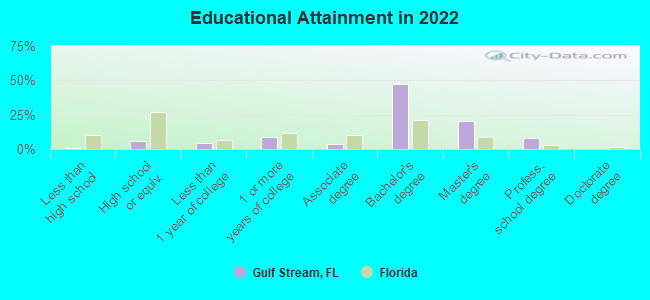
Educational Attainment - No schooling completed (%)
Educational Attainment - Less than high school (%)
Educational Attainment - High school or equivalent (%)
Educational Attainment - Less than 1 year of college (%)
Educational Attainment - 1 or more years of college (%)
Educational Attainment - Associate degree (%)
Educational Attainment - Bachelor's degree (%)
Educational Attainment - Master's degree (%)
Educational Attainment - Professional school degree (%)
Educational Attainment - Doctorate degree (%)
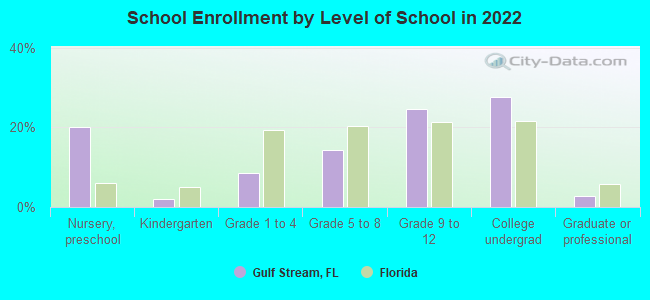
School Enrollment - Nursery, preschool (%)
School Enrollment - Kindergarten (%)
School Enrollment - Grade 1 to 4 (%)
School Enrollment - Grade 5 to 8 (%)
School Enrollment - Grade 9 to 12 (%)
School Enrollment - College undergrad (%)
School Enrollment - Graduate or professional (%)
School Enrollment - Not enrolled in school (%)
School enrollment - Public schools (%)
School enrollment - Private schools (%)
School enrollment - Not enrolled (%)
Median number of rooms in houses and condos
Median number of rooms in apartments
Housing units lacking complete plumbing facilities (%)
Housing units lacking complete kitchen facilities (%)
Density of houses
Urban houses (%)
Rural houses (%)
Households with people 60 years and over (%)
Households with people 65 years and over (%)
Households with people 75 years and over (%)
Households with one or more nonrelatives (%)
Households with no nonrelatives (%)
Population in households (%)
Family households (%)
Nonfamily households (%)
Population in families (%)
Family households with own children (%)
Median number of bedrooms in owner occupied houses
Mean number of bedrooms in owner occupied houses
Median number of bedrooms in renter occupied houses
Mean number of bedrooms in renter occupied houses
Median number of vehichles in owner occupied houses
Mean number of vehichles in owner occupied houses
Median number of vehichles in renter occupied houses
Mean number of vehichles in renter occupied houses
Mortgage status - with mortgage (%)
Mortgage status - with second mortgage (%)
Mortgage status - with home equity loan (%)
Mortgage status - with both second mortgage and home equity loan (%)
Mortgage status - without a mortgage (%)
Average family size
Average family size - White
Average family size - Black or African American
Average family size - Asian
Average family size - Hispanic or Latino
Average family size - American Indian and Alaska Native
Average family size - Multirace
Average family size - Other Race
Geographical mobility - Same house 1 year ago (%)
Geographical mobility - Moved within same county (%)
Geographical mobility - Moved from different county within same state (%)
Geographical mobility - Moved from different state (%)
Geographical mobility - Moved from abroad (%)
Place of birth - Born in state of residence (%)
Place of birth - Born in other state (%)
Place of birth - Native, outside of US (%)
Place of birth - Foreign born (%)
Housing units in structures - 1, detached (%)
Housing units in structures - 1, attached (%)
Housing units in structures - 2 (%)
Housing units in structures - 3 or 4 (%)
Housing units in structures - 5 to 9 (%)
Housing units in structures - 10 to 19 (%)
Housing units in structures - 20 to 49 (%)
Housing units in structures - 50 or more (%)
Housing units in structures - Mobile home (%)
Housing units in structures - Boat, RV, van, etc. (%)
House/condo owner moved in on average (years ago)
Renter moved in on average (years ago)
Year householder moved into unit - Moved in 1999 to March 2000 (%)
Year householder moved into unit - Moved in 1995 to 1998 (%)
Year householder moved into unit - Moved in 1990 to 1994 (%)
Year householder moved into unit - Moved in 1980 to 1989 (%)
Year householder moved into unit - Moved in 1970 to 1979 (%)
Year householder moved into unit - Moved in 1969 or earlier (%)
Means of transportation to work - Drove car alone (%)
Means of transportation to work - Carpooled (%)
Means of transportation to work - Public transportation (%)
Means of transportation to work - Bus or trolley bus (%)
Means of transportation to work - Streetcar or trolley car (%)
Means of transportation to work - Subway or elevated (%)
Means of transportation to work - Railroad (%)
Means of transportation to work - Ferryboat (%)
Means of transportation to work - Taxicab (%)
Means of transportation to work - Motorcycle (%)
Means of transportation to work - Bicycle (%)
Means of transportation to work - Walked (%)
Means of transportation to work - Other means (%)
Working at home (%)
Industry diversity
Most Common Industries - Agriculture, forestry, fishing and hunting, and mining (%)
Most Common Industries - Agriculture, forestry, fishing and hunting (%)
Most Common Industries - Mining, quarrying, and oil and gas extraction (%)
Most Common Industries - Construction (%)
Most Common Industries - Manufacturing (%)
Most Common Industries - Wholesale trade (%)
Most Common Industries - Retail trade (%)
Most Common Industries - Transportation and warehousing, and utilities (%)
Most Common Industries - Transportation and warehousing (%)
Most Common Industries - Utilities (%)
Most Common Industries - Information (%)
Most Common Industries - Finance and insurance, and real estate and rental and leasing (%)
Most Common Industries - Finance and insurance (%)
Most Common Industries - Real estate and rental and leasing (%)
Most Common Industries - Professional, scientific, and management, and administrative and waste management services (%)
Most Common Industries - Professional, scientific, and technical services (%)
Most Common Industries - Management of companies and enterprises (%)
Most Common Industries - Administrative and support and waste management services (%)
Most Common Industries - Educational services, and health care and social assistance (%)
Most Common Industries - Educational services (%)
Most Common Industries - Health care and social assistance (%)
Most Common Industries - Arts, entertainment, and recreation, and accommodation and food services (%)
Most Common Industries - Arts, entertainment, and recreation (%)
Most Common Industries - Accommodation and food services (%)
Most Common Industries - Other services, except public administration (%)
Most Common Industries - Public administration (%)
Occupation diversity
Most Common Occupations - Management, business, science, and arts occupations (%)
Most Common Occupations - Management, business, and financial occupations (%)
Most Common Occupations - Management occupations (%)
Most Common Occupations - Business and financial operations occupations (%)
Most Common Occupations - Computer, engineering, and science occupations (%)
Most Common Occupations - Computer and mathematical occupations (%)
Most Common Occupations - Architecture and engineering occupations (%)
Most Common Occupations - Life, physical, and social science occupations (%)
Most Common Occupations - Education, legal, community service, arts, and media occupations (%)
Most Common Occupations - Community and social service occupations (%)
Most Common Occupations - Legal occupations (%)
Most Common Occupations - Education, training, and library occupations (%)
Most Common Occupations - Arts, design, entertainment, sports, and media occupations (%)
Most Common Occupations - Healthcare practitioners and technical occupations (%)
Most Common Occupations - Health diagnosing and treating practitioners and other technical occupations (%)
Most Common Occupations - Health technologists and technicians (%)
Most Common Occupations - Service occupations (%)
Most Common Occupations - Healthcare support occupations (%)
Most Common Occupations - Protective service occupations (%)
Most Common Occupations - Fire fighting and prevention, and other protective service workers including supervisors (%)
Most Common Occupations - Law enforcement workers including supervisors (%)
Most Common Occupations - Food preparation and serving related occupations (%)
Most Common Occupations - Building and grounds cleaning and maintenance occupations (%)
Most Common Occupations - Personal care and service occupations (%)
Most Common Occupations - Sales and office occupations (%)
Most Common Occupations - Sales and related occupations (%)
Most Common Occupations - Office and administrative support occupations (%)
Most Common Occupations - Natural resources, construction, and maintenance occupations (%)
Most Common Occupations - Farming, fishing, and forestry occupations (%)
Most Common Occupations - Construction and extraction occupations (%)
Most Common Occupations - Installation, maintenance, and repair occupations (%)
Most Common Occupations - Production, transportation, and material moving occupations (%)
Most Common Occupations - Production occupations (%)
Most Common Occupations - Transportation occupations (%)
Most Common Occupations - Material moving occupations (%)
People in Group quarters - Institutionalized population (%)
People in Group quarters - Correctional institutions (%)
People in Group quarters - Federal prisons and detention centers (%)
People in Group quarters - Halfway houses (%)
People in Group quarters - Local jails and other confinement facilities (including police lockups) (%)
People in Group quarters - Military disciplinary barracks (%)
People in Group quarters - State prisons (%)
People in Group quarters - Other types of correctional institutions (%)
People in Group quarters - Nursing homes (%)
People in Group quarters - Hospitals/wards, hospices, and schools for the handicapped (%)
People in Group quarters - Hospitals/wards and hospices for chronically ill (%)
People in Group quarters - Hospices or homes for chronically ill (%)
People in Group quarters - Military hospitals or wards for chronically ill (%)
People in Group quarters - Other hospitals or wards for chronically ill (%)
People in Group quarters - Hospitals or wards for drug/alcohol abuse (%)
People in Group quarters - Mental (Psychiatric) hospitals or wards (%)
People in Group quarters - Schools, hospitals, or wards for the mentally retarded (%)
People in Group quarters - Schools, hospitals, or wards for the physically handicapped (%)
People in Group quarters - Institutions for the deaf (%)
People in Group quarters - Institutions for the blind (%)
People in Group quarters - Orthopedic wards and institutions for the physically handicapped (%)
People in Group quarters - Wards in general hospitals for patients who have no usual home elsewhere (%)
People in Group quarters - Wards in military hospitals for patients who have no usual home elsewhere (%)
People in Group quarters - Juvenile institutions (%)
People in Group quarters - Long-term care (%)
People in Group quarters - Homes for abused, dependent, and neglected children (%)
People in Group quarters - Residential treatment centers for emotionally disturbed children (%)
People in Group quarters - Training schools for juvenile delinquents (%)
People in Group quarters - Short-term care, detention or diagnostic centers for delinquent children (%)
People in Group quarters - Type of juvenile institution unknown (%)
People in Group quarters - Noninstitutionalized population (%)
People in Group quarters - College dormitories (includes college quarters off campus) (%)
People in Group quarters - Military quarters (%)
People in Group quarters - On base (%)
People in Group quarters - Barracks, unaccompanied personnel housing (UPH), (Enlisted/Officer), ;and similar group living quarters for military personnel (%)
People in Group quarters - Transient quarters for temporary residents (%)
People in Group quarters - Military ships (%)
People in Group quarters - Group homes (%)
People in Group quarters - Homes or halfway houses for drug/alcohol abuse (%)
People in Group quarters - Homes for the mentally ill (%)
People in Group quarters - Homes for the mentally retarded (%)
People in Group quarters - Homes for the physically handicapped (%)
People in Group quarters - Other group homes (%)
People in Group quarters - Religious group quarters (%)
People in Group quarters - Dormitories (%)
People in Group quarters - Agriculture workers' dormitories on farms (%)
People in Group quarters - Job Corps and vocational training facilities (%)
People in Group quarters - Other workers' dormitories (%)
People in Group quarters - Crews of maritime vessels (%)
People in Group quarters - Other nonhousehold living situations (%)
People in Group quarters - Other noninstitutional group quarters (%)
Residents speaking English at home (%)
Residents speaking English at home - Born in the United States (%)
Residents speaking English at home - Native, born elsewhere (%)
Residents speaking English at home - Foreign born (%)
Residents speaking Spanish at home (%)
Residents speaking Spanish at home - Born in the United States (%)
Residents speaking Spanish at home - Native, born elsewhere (%)
Residents speaking Spanish at home - Foreign born (%)
Residents speaking other language at home (%)
Residents speaking other language at home - Born in the United States (%)
Residents speaking other language at home - Native, born elsewhere (%)
Residents speaking other language at home - Foreign born (%)
Class of Workers - Employee of private company (%)
Class of Workers - Self-employed in own incorporated business (%)
Class of Workers - Private not-for-profit wage and salary workers (%)
Class of Workers - Local government workers (%)
Class of Workers - State government workers (%)
Class of Workers - Federal government workers (%)
Class of Workers - Self-employed workers in own not incorporated business and Unpaid family workers (%)
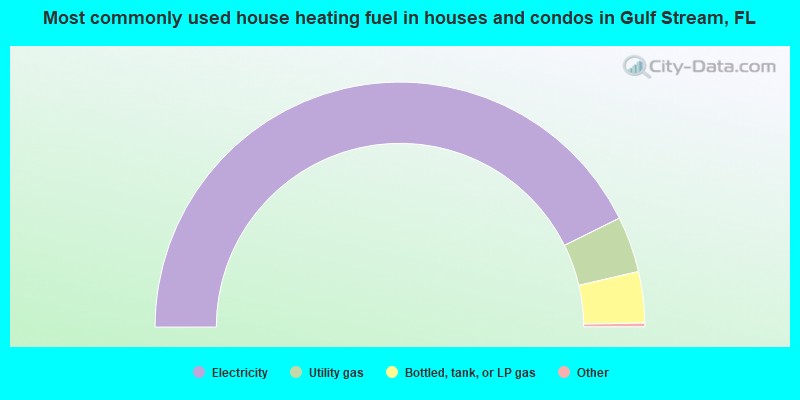
House heating fuel used in houses and condos - Utility gas (%)
House heating fuel used in houses and condos - Bottled, tank, or LP gas (%)
House heating fuel used in houses and condos - Electricity (%)
House heating fuel used in houses and condos - Fuel oil, kerosene, etc. (%)
House heating fuel used in houses and condos - Coal or coke (%)
House heating fuel used in houses and condos - Wood (%)
House heating fuel used in houses and condos - Solar energy (%)
House heating fuel used in houses and condos - Other fuel (%)
House heating fuel used in houses and condos - No fuel used (%)
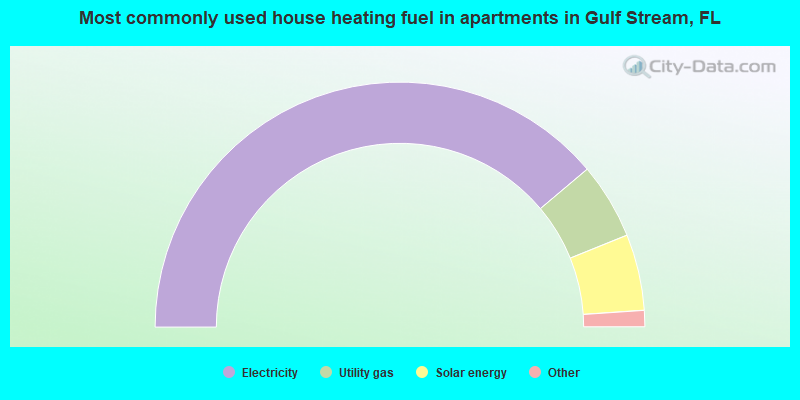
House heating fuel used in apartments - Utility gas (%)
House heating fuel used in apartments - Bottled, tank, or LP gas (%)
House heating fuel used in apartments - Electricity (%)
House heating fuel used in apartments - Fuel oil, kerosene, etc. (%)
House heating fuel used in apartments - Coal or coke (%)
House heating fuel used in apartments - Wood (%)
House heating fuel used in apartments - Solar energy (%)
House heating fuel used in apartments - Other fuel (%)
House heating fuel used in apartments - No fuel used (%)
Armed forces status - In Armed Forces (%)
Armed forces status - Civilian (%)
Armed forces status - Civilian - Veteran (%)
Armed forces status - Civilian - Nonveteran (%)
Fatal accidents locations in years 2005-2021
Fatal accidents locations in 2005
Fatal accidents locations in 2006
Fatal accidents locations in 2007
Fatal accidents locations in 2008
Fatal accidents locations in 2009
Fatal accidents locations in 2010
Fatal accidents locations in 2011
Fatal accidents locations in 2012
Fatal accidents locations in 2013
Fatal accidents locations in 2014
Fatal accidents locations in 2015
Fatal accidents locations in 2016
Fatal accidents locations in 2017
Fatal accidents locations in 2018
Fatal accidents locations in 2019
Fatal accidents locations in 2020
Fatal accidents locations in 2021
Alcohol use - People drinking some alcohol every month (%)
Alcohol use - People not drinking at all (%)
Alcohol use - Average days/month drinking alcohol
Alcohol use - Average drinks/week
Alcohol use - Average days/year people drink much
Audiometry - Average condition of hearing (%)
Audiometry - People that can hear a whisper from across a quiet room (%)
Audiometry - People that can hear normal voice from across a quiet room (%)
Audiometry - Ears ringing, roaring, buzzing (%)
Audiometry - Had a job exposure to loud noise (%)
Audiometry - Had off-work exposure to loud noise (%)
Blood Pressure & Cholesterol - Has high blood pressure (%)
Blood Pressure & Cholesterol - Checking blood pressure at home (%)
Blood Pressure & Cholesterol - Frequently checking blood cholesterol (%)
Blood Pressure & Cholesterol - Has high cholesterol level (%)
Consumer Behavior - Money monthly spent on food at supermarket/grocery store
Consumer Behavior - Money monthly spent on food at other stores
Consumer Behavior - Money monthly spent on eating out
Consumer Behavior - Money monthly spent on carryout/delivered foods
Consumer Behavior - Income spent on food at supermarket/grocery store (%)
Consumer Behavior - Income spent on food at other stores (%)
Consumer Behavior - Income spent on eating out (%)
Consumer Behavior - Income spent on carryout/delivered foods (%)
Current Health Status - General health condition (%)
Current Health Status - Blood donors (%)
Current Health Status - Has blood ever tested for HIV virus (%)
Current Health Status - Left-handed people (%)
Dermatology - People using sunscreen (%)
Diabetes - Diabetics (%)
Diabetes - Had a blood test for high blood sugar (%)
Diabetes - People taking insulin (%)
Diet Behavior & Nutrition - Diet health (%)
Diet Behavior & Nutrition - Milk product consumption (# of products/month)
Diet Behavior & Nutrition - Meals not home prepared (#/week)
Diet Behavior & Nutrition - Meals from fast food or pizza place (#/week)
Diet Behavior & Nutrition - Ready-to-eat foods (#/month)
Diet Behavior & Nutrition - Frozen meals/pizza (#/month)
Drug Use - People that ever used marijuana or hashish (%)
Drug Use - Ever used hard drugs (%)
Drug Use - Ever used any form of cocaine (%)
Drug Use - Ever used heroin (%)
Drug Use - Ever used methamphetamine (%)
Health Insurance - People covered by health insurance (%)
Kidney Conditions-Urology - Avg. # of times urinating at night
Medical Conditions - People with asthma (%)
Medical Conditions - People with anemia (%)
Medical Conditions - People with psoriasis (%)
Medical Conditions - People with overweight (%)
Medical Conditions - Elderly people having difficulties in thinking or remembering (%)
Medical Conditions - People who ever received blood transfusion (%)
Medical Conditions - People having trouble seeing even with glass/contacts (%)
Medical Conditions - People with arthritis (%)
Medical Conditions - People with gout (%)
Medical Conditions - People with congestive heart failure (%)
Medical Conditions - People with coronary heart disease (%)
Medical Conditions - People with angina pectoris (%)
Medical Conditions - People who ever had heart attack (%)
Medical Conditions - People who ever had stroke (%)
Medical Conditions - People with emphysema (%)
Medical Conditions - People with thyroid problem (%)
Medical Conditions - People with chronic bronchitis (%)
Medical Conditions - People with any liver condition (%)
Medical Conditions - People who ever had cancer or malignancy (%)
Mental Health - People who have little interest in doing things (%)
Mental Health - People feeling down, depressed, or hopeless (%)
Mental Health - People who have trouble sleeping or sleeping too much (%)
Mental Health - People feeling tired or having little energy (%)
Mental Health - People with poor appetite or overeating (%)
Mental Health - People feeling bad about themself (%)
Mental Health - People who have trouble concentrating on things (%)
Mental Health - People moving or speaking slowly or too fast (%)
Mental Health - People having thoughts they would be better off dead (%)
Oral Health - Average years since last visit a dentist
Oral Health - People embarrassed because of mouth (%)
Oral Health - People with gum disease (%)
Oral Health - General health of teeth and gums (%)
Oral Health - Average days a week using dental floss/device
Oral Health - Average days a week using mouthwash for dental problem
Oral Health - Average number of teeth
Pesticide Use - Households using pesticides to control insects (%)
Pesticide Use - Households using pesticides to kill weeds (%)
Physical Activity - People doing vigorous-intensity work activities (%)
Physical Activity - People doing moderate-intensity work activities (%)
Physical Activity - People walking or bicycling (%)
Physical Activity - People doing vigorous-intensity recreational activities (%)
Physical Activity - People doing moderate-intensity recreational activities (%)
Physical Activity - Average hours a day doing sedentary activities
Physical Activity - Average hours a day watching TV or videos
Physical Activity - Average hours a day using computer
Physical Functioning - People having limitations keeping them from working (%)
Physical Functioning - People limited in amount of work they can do (%)
Physical Functioning - People that need special equipment to walk (%)
Physical Functioning - People experiencing confusion/memory problems (%)
Physical Functioning - People requiring special healthcare equipment (%)
Prescription Medications - Average number of prescription medicines taking
Preventive Aspirin Use - Adults 40+ taking low-dose aspirin (%)
Reproductive Health - Vaginal deliveries (%)
Reproductive Health - Cesarean deliveries (%)
Reproductive Health - Deliveries resulted in a live birth (%)
Reproductive Health - Pregnancies resulted in a delivery (%)
Reproductive Health - Women breastfeeding newborns (%)
Reproductive Health - Women that had a hysterectomy (%)
Reproductive Health - Women that had both ovaries removed (%)
Reproductive Health - Women that have ever taken birth control pills (%)
Reproductive Health - Women taking birth control pills (%)
Reproductive Health - Women that have ever used Depo-Provera or injectables (%)
Reproductive Health - Women that have ever used female hormones (%)
Sexual Behavior - People 18+ that ever had sex (vaginal, anal, or oral) (%)
Sexual Behavior - Males 18+ that ever had vaginal sex with a woman (%)
Sexual Behavior - Males 18+ that ever performed oral sex on a woman (%)
Sexual Behavior - Males 18+ that ever had anal sex with a woman (%)
Sexual Behavior - Males 18+ that ever had any sex with a man (%)
Sexual Behavior - Females 18+ that ever had vaginal sex with a man (%)
Sexual Behavior - Females 18+ that ever performed oral sex on a man (%)
Sexual Behavior - Females 18+ that ever had anal sex with a man (%)
Sexual Behavior - Females 18+ that ever had any kind of sex with a woman (%)
Sexual Behavior - Average age people first had sex
Sexual Behavior - Average number of female sex partners in lifetime (males 18+)
Sexual Behavior - Average number of female vaginal sex partners in lifetime (males 18+)
Sexual Behavior - Average age people first performed oral sex on a woman (18+)
Sexual Behavior - Average number of woman performed oral sex on in lifetime (18+)
Sexual Behavior - Average number of male sex partners in lifetime (males 18+)
Sexual Behavior - Average number of male anal sex partners in lifetime (males 18+)
Sexual Behavior - Average age people first performed oral sex on a man (18+)
Sexual Behavior - Average number of male oral sex partners in lifetime (18+)
Sexual Behavior - People using protection when performing oral sex (%)
Sexual Behavior - Average number of times people have vaginal or anal sex a year
Sexual Behavior - People having sex without condom (%)
Sexual Behavior - Average number of male sex partners in lifetime (females 18+)
Sexual Behavior - Average number of male vaginal sex partners in lifetime (females 18+)
Sexual Behavior - Average number of female sex partners in lifetime (females 18+)
Sexual Behavior - Circumcised males 18+ (%)
Sleep Disorders - Average hours sleeping at night
Sleep Disorders - People that has trouble sleeping (%)
Smoking-Cigarette Use - People smoking cigarettes (%)
Taste & Smell - People 40+ having problems with smell (%)
Taste & Smell - People 40+ having problems with taste (%)
Taste & Smell - People 40+ that ever had wisdom teeth removed (%)
Taste & Smell - People 40+ that ever had tonsils teeth removed (%)
Taste & Smell - People 40+ that ever had a loss of consciousness because of a head injury (%)
Taste & Smell - People 40+ that ever had a broken nose or other serious injury to face or skull (%)
Taste & Smell - People 40+ that ever had two or more sinus infections (%)
Weight - Average height (inches)
Weight - Average weight (pounds)
Weight - Average BMI
Weight - People that are obese (%)
Weight - People that ever were obese (%)
Weight - People trying to lose weight (%)
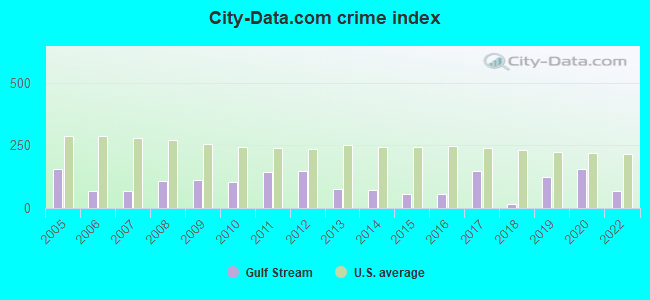
Officers per 1,000 residents here:
13.03Florida average:
2.33
Latest news from Gulf Stream, FL collected exclusively by city-data.com from local newspapers, TV, and radio stations
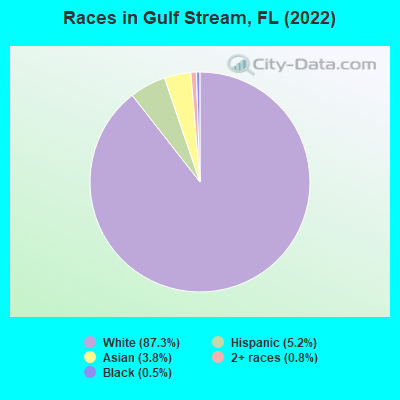
Ancestries: English (19.5%), Irish (9.0%), Italian (7.4%), German (6.6%), European (6.2%), Scottish (6.2%).
Current Local Time:
Land area: 0.75 square miles.
Population density: 1,269 people per square mile (low).
143 residents are foreign born (3.9% Europe , 3.9% Asia , 3.6% North America , 2.6% Africa , 2.1% Latin America ).
This town:
16.6%Florida:
21.1%
Median real estate property taxes paid for housing units with mortgages in 2022: $10,633 (0.4%)Median real estate property taxes paid for housing units with no mortgage in 2022: $10,251 (0.4%)
Nearest city with pop. 50,000+: Delray Beach, FL
Nearest city with pop. 200,000+: Hialeah, FL
Nearest city with pop. 1,000,000+: Houston, TX
Nearest cities:
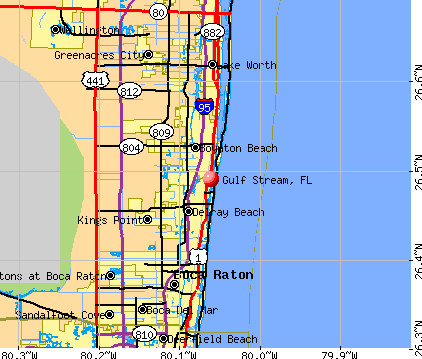
Latitude: 26.49 N, Longitude: 80.06 W
Area code commonly used in this area: 561
Property values in Gulf Stream, FL
Single-family new house construction building permits:
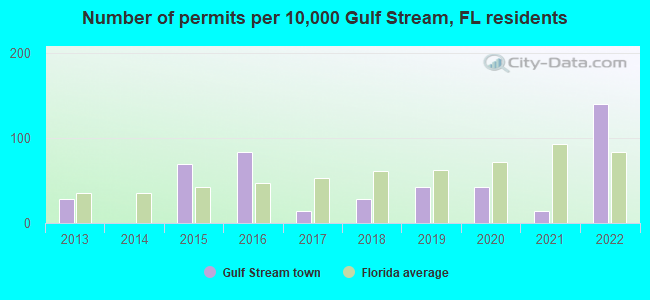
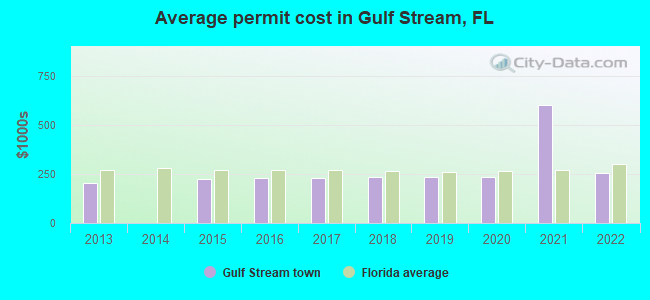
2022: 10 buildings , average cost: $256,2002021: 1 building , cost: $600,0002020: 3 buildings , average cost: $233,1002019: 3 buildings , average cost: $236,4002018: 2 buildings , average cost: $233,8002017: 1 building , cost: $231,2002016: 6 buildings , average cost: $227,1002015: 5 buildings , average cost: $225,7002013: 2 buildings , average cost: $205,200Unemployment in December 2023: Population change in the 1990s: +23 (+3.3%).
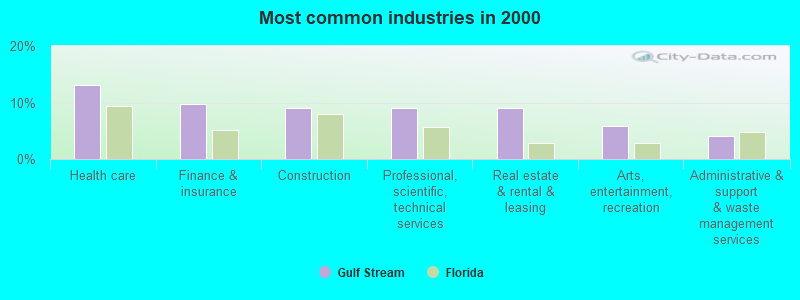
Most common industries in Gulf Stream, FL (%)
Both Males Females
Health care (13.0%)
Finance & insurance (9.8%)
Construction (9.1%)
Professional, scientific, technical services (9.1%)
Real estate & rental & leasing (9.1%)
Arts, entertainment, recreation (5.8%)
Administrative & support & waste management services (4.0%)
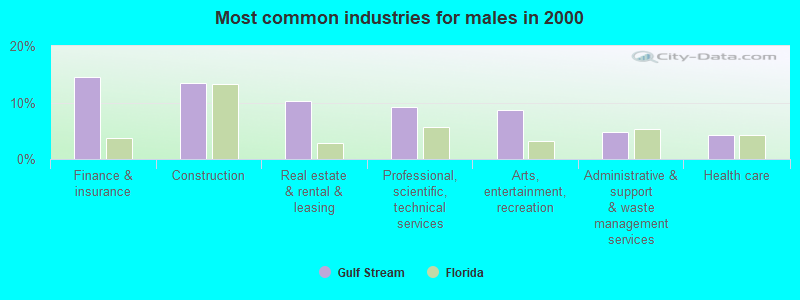
Finance & insurance (14.5%)
Construction (13.4%)
Real estate & rental & leasing (10.2%)
Professional, scientific, technical services (9.1%)
Arts, entertainment, recreation (8.6%)
Administrative & support & waste management services (4.8%)
Health care (4.3%)
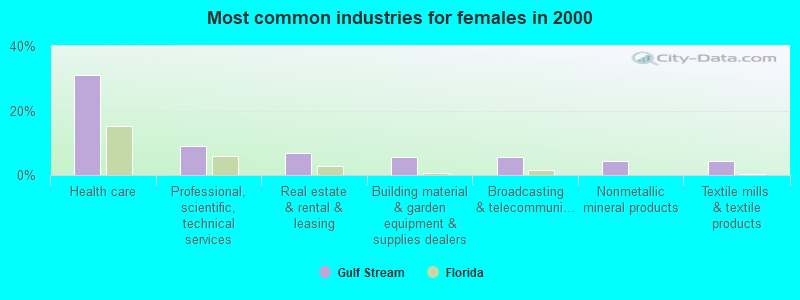
Health care (31.1%)
Professional, scientific, technical services (8.9%)
Real estate & rental & leasing (6.7%)
Building material & garden equipment & supplies dealers (5.6%)
Broadcasting & telecommunications (5.6%)
Nonmetallic mineral products (4.4%)
Textile mills & textile products (4.4%)
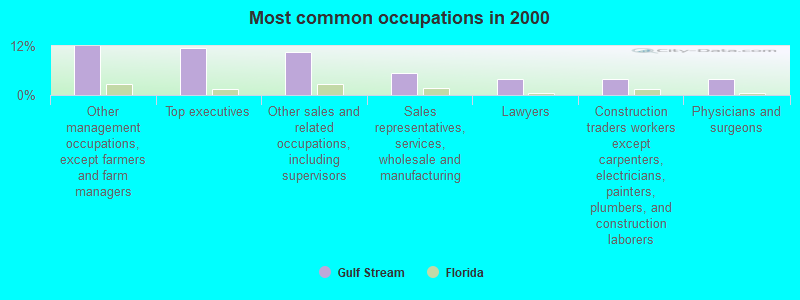
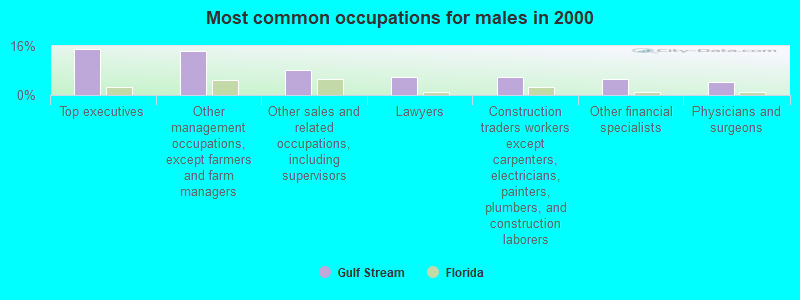
Most common occupations in Gulf Stream, FL (%)
Both Males Females
Other management occupations, except farmers and farm managers (12.0%)
Top executives (11.6%)
Other sales and related occupations, including supervisors (10.5%)
Sales representatives, services, wholesale and manufacturing (5.4%)
Lawyers (4.0%)
Construction traders workers except carpenters, electricians, painters, plumbers, and construction laborers (4.0%)
Physicians and surgeons (4.0%)
Top executives (15.1%)
Other management occupations, except farmers and farm managers (14.5%)
Other sales and related occupations, including supervisors (8.1%)
Lawyers (5.9%)
Construction traders workers except carpenters, electricians, painters, plumbers, and construction laborers (5.9%)
Other financial specialists (5.4%)
Physicians and surgeons (4.3%)
Other sales and related occupations, including supervisors (15.6%)
Sales representatives, services, wholesale and manufacturing (10.0%)
Advertising, marketing, promotions, public relations, and sales managers (7.8%)
Other management occupations, except farmers and farm managers (6.7%)
Registered nurses (5.6%)
Retail sales workers, except cashiers (5.6%)
Top executives (4.4%)
Tornado activity:
Gulf Stream-area historical tornado activity is slightly below Florida state average. It is 27% smaller than the overall U.S. average.
On 3/1/1980, a category F3 (max. wind speeds 158-206 mph) tornado 16.7 miles away from the Gulf Stream town center killed one person and injured 33 people and caused between $5,000,000 and $50,000,000 in damages.
On 2/23/1965, a category F3 tornado 22.5 miles away from the town center injured 6 people and caused between $50,000 and $500,000 in damages.
Earthquake activity:
Gulf Stream-area historical earthquake activity is above Florida state average. It is 94% smaller than the overall U.S. average. On 9/10/2006 at 14:56:08, a magnitude 5.9 (5.9 MB, 5.5 MS, 5.8 MW, Class: Moderate, Intensity: VI - VII) earthquake occurred 407.4 miles away from Gulf Stream center On 2/22/1992 at 04:21:34, a magnitude 3.2 (3.2 MB, Depth: 6.2 mi, Class: Light, Intensity: II - III) earthquake occurred 73.3 miles away from the city center On 6/23/2016 at 17:20:29, a magnitude 3.8 (3.8 ML) earthquake occurred 245.2 miles away from Gulf Stream center On 7/16/2016 at 20:00:10, a magnitude 3.7 (3.7 MB) earthquake occurred 229.7 miles away from the city center On 9/21/2016 at 16:30:52, a magnitude 3.8 (3.8 ML) earthquake occurred 250.2 miles away from the city center On 9/4/2016 at 18:29:29, a magnitude 3.8 (3.8 ML) earthquake occurred 251.3 miles away from the city center Magnitude types: body-wave magnitude (MB), local magnitude (ML), surface-wave magnitude (MS), moment magnitude (MW) Natural disasters: The number of natural disasters in Palm Beach County (27) is a lot greater than the US average (15).Major Disasters (Presidential) Declared: 15Emergencies Declared: 8Hurricanes: 17, Tropical Storms: 4, Fires: 3, Flood: 1, Freeze: 1, Storm: 1, Other: 2 (Note: some incidents may be assigned to more than one category). Hospitals and medical centers near Gulf Stream: COMPREHENSIVE REHAB INC (Hospital, about 1 miles away; BOYNTON BEACH, FL)
BOULEVARD REHABILITATION CENTER (Nursing Home, about 2 miles away; BOYNTON BEACH, FL)
BETHESDA HOSPITAL EAST (about 2 miles away; BOYNTON BEACH, FL)
MANORCARE HEALTH SERVICES BOYNTON BEACH (Nursing Home, about 2 miles away; BOYNTON BEACH, FL)
ASSOCIATED HOME HEALTH (Home Health Center, about 2 miles away; BOYNTON BEACH, FL)
ACTIVA HOME HEALTH (Home Health Center, about 3 miles away; BOYNTON BEACH, FL)
VITAL HOME CARE OF FLORIDA, INC (Home Health Center, about 3 miles away; BOYNTON BEACH, FL)
Amtrak stations near Gulf Stream: 4 miles: DELRAY BEACH (345 S. CONGRESS AVE.) Services: enclosed waiting area, public restrooms, public payphones, vending machines, free short-term parking, free long-term parking, call for car rental service, call for taxi service, public transit connection.
13 miles: DEERFIELD BEACH (1300 W. HILLSBORO BLVD.) Services: ticket office, fully wheelchair accessible, enclosed waiting area, public restrooms, public payphones, free short-term parking, free long-term parking, call for taxi service, public transit connection.
16 miles: WEST PALM BEACH (201 S. TAMARIND AVE.) Services: ticket office, fully wheelchair accessible, enclosed waiting area, public restrooms, public payphones, vending machines, free short-term parking, free long-term parking, taxi stand, intercity bus service, public transit connection.
Colleges/universities with over 2000 students nearest to Gulf Stream:
Lynn University (about 9 miles; Boca Raton, FL ; Full-time enrollment: 2,151)
Florida Atlantic University (about 9 miles; Boca Raton, FL ; FT enrollment: 24,403)
Palm Beach State College (about 9 miles; Lake Worth, FL ; FT enrollment: 19,938)
Palm Beach Atlantic University (about 15 miles; West Palm Beach, FL ; FT enrollment: 2,868)
Everest University-Pompano Beach (about 18 miles; Pompano Beach, FL ; FT enrollment: 2,316)
Keiser University-Ft Lauderdale (about 23 miles; Fort Lauderdale, FL ; FT enrollment: 18,270)
Broward College (about 31 miles; Fort Lauderdale, FL ; FT enrollment: 30,322)
Private elementary/middle school in Gulf Stream:
See full list of schools located in Gulf Stream Palm Beach County has a predicted average indoor radon screening level less than 2 pCi/L (pico curies per liter) - Low Potential Average household size: This town:
2.2 peopleFlorida:
2.5 people
Percentage of family households: This town:
69.5%Whole state:
65.2%
Percentage of households with unmarried partners: This town:
3.0%Whole state:
7.3%
Likely homosexual households (counted as self-reported same-sex unmarried-partner households)
Lesbian couples: 0.0% of all households Gay men: 0.6% of all households
For population 15 years and over in Gulf Stream:
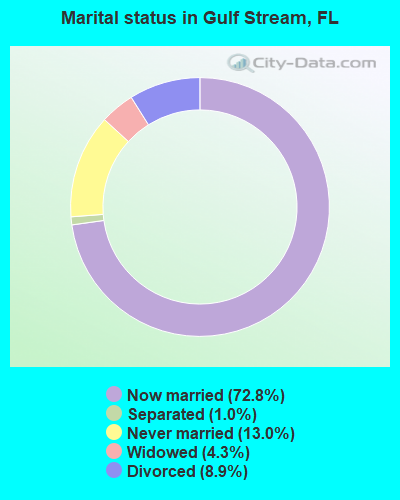
Never married: 13.0%Now married: 72.8%Separated: 1.0%Widowed: 4.3%Divorced: 8.9% For population 25 years and over in Gulf Stream:
High school or higher: 98.9%Bachelor's degree or higher: 73.7%Graduate or professional degree: 27.9%Unemployed: 1.4%Mean travel time to work (commute): 23.0 minutes
Education Gini index (Inequality in education) Here:
7.1Florida average:
12.2
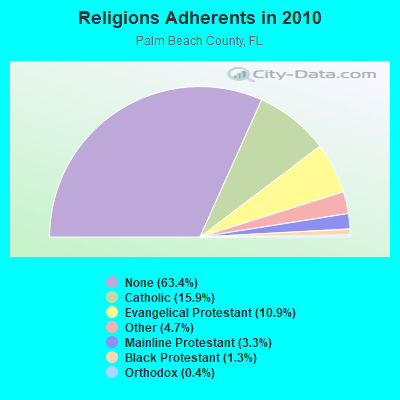
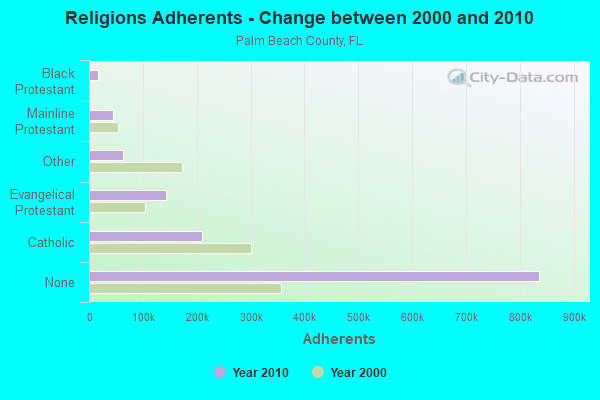
Religion statistics for Gulf Stream, FL (based on Palm Beach County data)
Religion Adherents Congregations Catholic 210,006 36 Evangelical Protestant 143,738 477 Other 62,520 124 Mainline Protestant 44,223 83 Black Protestant 17,533 47 Orthodox 5,695 8 None 836,419 -
Source: Clifford Grammich, Kirk Hadaway, Richard Houseal, Dale E.Jones, Alexei Krindatch, Richie Stanley and Richard H.Taylor. 2012. 2010 U.S.Religion Census: Religious Congregations & Membership Study. Association of Statisticians of American Religious Bodies. Jones, Dale E., et al. 2002. Congregations and Membership in the United States 2000. Nashville, TN: Glenmary Research Center. Graphs represent county-level data
Food Environment Statistics: Number of grocery stores : 259Here :
2.05 / 10,000 pop.State :
2.04 / 10,000 pop.
Number of supercenters and club stores : 13This county :
0.10 / 10,000 pop.Florida :
0.11 / 10,000 pop.
Number of convenience stores (no gas) : 161Palm Beach County :
1.28 / 10,000 pop.State :
1.28 / 10,000 pop.
Number of convenience stores (with gas) : 284Palm Beach County :
2.25 / 10,000 pop.Florida :
3.04 / 10,000 pop.
Number of full-service restaurants : 1,129Here :
8.96 / 10,000 pop.Florida :
7.45 / 10,000 pop.
Adult diabetes rate : Palm Beach County :
8.7%State :
9.2%
Adult obesity rate : Palm Beach County :
19.3%Florida :
23.7%
Low-income preschool obesity rate : Palm Beach County :
17.3%Florida :
14.0%
Health and Nutrition:
Average overall health of teeth and gums : This city:
60.5%State:
49.4%
People feeling badly about themselves : This city:
14.9%Florida:
19.5%
People not drinking alcohol at all : Gulf Stream:
6.2%Florida:
10.7%
Average hours sleeping at night : Gulf Stream:
7.2Florida:
6.9
Overweight people : This city:
37.2%State:
34.7%
General health condition : This city:
63.5%Florida:
57.0%
Average condition of hearing : This city:
76.8%State:
79.2%
More about Health and Nutrition of Gulf Stream, FL Residents
Local government employment and payroll (March 2022)
Function
Full-time employees
Monthly full-time payroll
Average yearly full-time wage
Part-time employees
Monthly part-time payroll
Police Protection - Officers
11 $82,959 $90,501 0 $0 Other Government Administration
3 $30,723 $122,892 0 $0 Streets and Highways
1 $6,466 $77,592 0 $0 Water Supply
1 $4,686 $56,232 0 $0 Other and Unallocable
1 $3,543 $42,516 0 $0 Judicial and Legal
1 $4,577 $54,924 0 $0 Financial Administration
1 $7,867 $94,404 0 $0
Totals for Government
19 $140,821 $88,940 0 $0
Gulf Stream government finances - Expenditure in 2017 (per resident):
Current Operations - Police Protection: $1,432,000 ($1502.62)
Financial Administration: $1,282,000 ($1345.23)Water Utilities: $902,000 ($946.48)Judicial and Legal Services: $580,000 ($608.60)Local Fire Protection: $429,000 ($450.16)Regular Highways: $148,000 ($155.30)Solid Waste Management: $138,000 ($144.81)Natural Resources - Other: $87,000 ($91.29)Other Capital Outlay - Police Protection: $80,000 ($83.95)
Regular Highways: $72,000 ($75.55)Financial Administration: $40,000 ($41.97)
Gulf Stream government finances - Revenue in 2017 (per resident):
Charges - Solid Waste Management: $140,000 ($146.90)
Other: $5,000 ($5.25)Local Intergovernmental - General Local Government Support: $49,000 ($51.42)
Miscellaneous - Special Assessments: $233,000 ($244.49)
General Revenue - Other: $130,000 ($136.41)Interest Earnings: $48,000 ($50.37)Donations From Private Sources: $26,000 ($27.28)Fines and Forfeits: $1,000 ($1.05)Revenue - Water Utilities: $1,072,000 ($1124.87)
State Intergovernmental - General Local Government Support: $101,000 ($105.98)
Highways: $2,000 ($2.10)Tax - Property: $4,652,000 ($4881.43)
Other License: $595,000 ($624.34)Public Utilities Sales: $269,000 ($282.27)Occupation and Business License - Other: $157,000 ($164.74)Other Selective Sales: $36,000 ($37.78)
Gulf Stream government finances - Cash and Securities in 2017 (per resident):
Other Funds - Cash and Securities: $3,595,000 ($3772.30)
7.12% of this county's 2021 resident taxpayers lived in other counties in 2020 ($242,201 average adjusted gross income )
Here:
7.12%Florida average:
8.80%
0.02% of residents moved from foreign countries ($131 average AGI )Palm Beach County:
0.02%Florida average:
0.05%
Top counties from which taxpayers relocated into this county between 2020 and 2021:
6.27% of this county's 2020 resident taxpayers moved to other counties in 2021 ($96,101 average adjusted gross income )
Here:
6.27%Florida average:
7.45%
0.02% of residents moved to foreign countries ($206 average AGI )Palm Beach County:
0.02%Florida average:
0.04%
Top counties to which taxpayers relocated from this county between 2020 and 2021: Strongest AM radio stations in Gulf Stream:
WFTL (850 AM; 50 kW; WEST PALM BEACH, FL; Owner: JAMES CRYSTAL ENTERPRISES II, L.L.C.)
WDJA (1420 AM; 5 kW; DELRAY BEACH, FL; Owner: JAMES CRYSTAL DELRAY BEACH, INC.)
WLVJ (1040 AM; 25 kW; BOYNTON BEACH, FL; Owner: JAMES CRYSTAL BOYNTON BEACH, INC.)
WWNN (1470 AM; 50 kW; POMPANO BEACH, FL; Owner: WWNN LICENSE, LLC)
WAQI (710 AM; 50 kW; MIAMI, FL; Owner: LICENSE CORPORATION #1)
WRFX (940 AM; 50 kW; MIAMI, FL; Owner: CLEAR CHANNEL BROADCASTING LICENSES, INC.)
WJNA (640 AM; 38 kW; ROYAL PALM BEACH, FL; Owner: SOUTH FLORIDA RADIO, INC.)
WWFE (670 AM; 50 kW; MIAMI, FL; Owner: FENIX BROADCASTING CORP.)
WNMA (1210 AM; 49 kW; MIAMI SPRINGS, FL; Owner: RADIO UNICA OF MIAMI LICENSE CORP.)
WHSR (980 AM; 5 kW; POMPANO BEACH, FL; Owner: WWNN LICENSE, LLC)
WJNO (1290 AM; 10 kW; WEST PALM BEACH, FL; Owner: CLEAR CHANNEL BROADCASTING LICENSES, INC.)
WQBA (1140 AM; 50 kW; MIAMI, FL; Owner: WQBA-AM LICENSE CORP.)
WSUA (1260 AM; 50 kW; MIAMI, FL; Owner: WSUA BROADCASTING CORPORATION)
Strongest FM radio stations in Gulf Stream:
WEAT-FM (104.3 FM; WEST PALM BEACH, FL; Owner: INFINITY RADIO OPERATIONS INC.)
WXEL (90.7 FM; WEST PALM BEACH, FL; Owner: BARRY TELECOMMUNICATIONS, INC.)
WRMF (97.9 FM; PALM BEACH, FL; Owner: PBB LICENSES, LLC)
WRMB (89.3 FM; BOYNTON BEACH, FL; Owner: THE MOODY BIBLE INSTITUTE OF CHICAGO)
WIRK-FM (107.9 FM; WEST PALM BEACH, FL; Owner: INFINITY RADIO OPERATIONS INC.)
WOLL (105.5 FM; HOBE SOUND, FL; Owner: CLEAR CHANNEL BROADCASTING LICENSES, INC.)
WAYF (88.1 FM; WEST PALM BEACH, FL; Owner: WAY-FM MEDIA GROUP. INC.)
WEDR (99.1 FM; MIAMI, FL; Owner: COX RADIO, INC.)
WKGR (98.7 FM; FORT PIERCE, FL; Owner: CLEAR CHANNEL BROADCASTING LICENSES, INC.)
W270AD (101.9 FM; WEST PALM BEACH, FL; Owner: TRINITY INTERNATIONAL FOUNDATION, INC.)
WRLX (92.1 FM; WEST PALM BEACH, FL; Owner: CAPSTAR TX LIMITED PARTNERSHIP)
WXDJ (95.7 FM; NORTH MIAMI BEACH, FL; Owner: WXDJ LICENSING, INC.)
WBGG-FM (105.9 FM; FORT LAUDERDALE, FL; Owner: CLEAR CHANNEL BROADCASTING LICENSES, INC.)
WHYI-FM (100.7 FM; FORT LAUDERDALE, FL; Owner: CLEAR CHANNEL BROADCASTING LICENSES, INC.)
WKIS (99.9 FM; BOCA RATON, FL; Owner: WKIS LICENSE LIMITED PARTNERSHIP)
WRMA (106.7 FM; FORT LAUDERDALE, FL; Owner: WRMA LICENSING, INC.)
WFLC (97.3 FM; MIAMI, FL; Owner: COX RADIO, INC.)
WPYM (93.1 FM; MIAMI, FL; Owner: COX RADIO-MIAMI, LLC)
WHQT (105.1 FM; CORAL GABLES, FL; Owner: COX RADIO, INC.)
WLVE (93.9 FM; MIAMI BEACH, FL; Owner: CLEAR CHANNEL BROADCASTING LICENSES, INC.)
TV broadcast stations around Gulf Stream:
WPTV (Channel 5; WEST PALM BEACH, FL; Owner: SCRIPPS HOWARD BROADCASTING COMPANY)
WFLX (Channel 29; WEST PALM BEACH, FL; Owner: RAYCOM NATIONAL, INC.)
WXEL-TV (Channel 42; WEST PALM BEACH, FL; Owner: BARRY TELECOMMUNICATIONS, INC.)
WPEC (Channel 12; WEST PALM BEACH, FL; Owner: FREEDOM BROADCASTING OF FLORIDA, INC)
WFGC (Channel 61; PALM BEACH, FL; Owner: CHRISTIAN TELEVISION OF PALM BEACH COUNTY, INC.)
WPXP (Channel 67; LAKE WORTH, FL; Owner: PAXSON WEST PALM BEACH LICENSE, INC.)
WHDT-LP (Channel 44; MIAMI, FL; Owner: GUENTER MARKSTEINER)
WWHB-CA (Channel 15; STUART, FL; Owner: AMERICAN NETCOM, INC.)
WPBT (Channel 2; MIAMI, FL; Owner: COMMUNITY TV FOUNDATION OF S. FLORIDA, INC.)
WSVN (Channel 7; MIAMI, FL; Owner: SUNBEAM TELEVISION CORP.)
WBWP-LP (Channel 57; WEST PALM BEACH, FL; Owner: H&R PRODUCTION GROUP, LLC)
W58BU (Channel 58; HALLANDALE, FL; Owner: NBC STATIONS MANAGEMENT,INC.)
WPPB-TV (Channel 63; BOCA RATON, FL; Owner: THE SCHOOL BOARD OF BROWARD COUNTY, FLORIDA)
WHFT-TV (Channel 45; MIAMI, FL; Owner: TRINITY BROADCASTING OF FLORIDA, INC.)
WAMI-TV (Channel 69; HOLLYWOOD, FL; Owner: TELEFUTURA MIAMI LLC)
W24CA (Channel 24; MARATHON, FL; Owner: KEY COMMUNICATIONS OF TEXAS)
WTVX (Channel 34; FORT PIERCE, FL; Owner: C-34 FCC LICENSEE SUBSIDIARY, LLC)
WPBF (Channel 25; TEQUESTA, FL; Owner: WPBF-TV COMPANY)
WSCV (Channel 51; FORT LAUDERDALE, FL; Owner: TELEMUNDO OF FLORIDA LICENSE CORP.)
WLRN-TV (Channel 17; MIAMI, FL; Owner: THE SCHOOL BOARD OF MIAMI - DADE COUNTY, FL)
WPLG (Channel 10; MIAMI, FL; Owner: POST-NEWSWEEK STATIONS, FLORIDA, INC.)
WLTV (Channel 23; MIAMI, FL; Owner: WLTV LICENSE PARTNERSHIP, G.P.)
WTCN-CA (Channel 43; PALM BEACH, FL; Owner: WILLIAM H. BROTHERS)
W47BG (Channel 47; WEST PALM BEACH, FL; Owner: JACKSONVILLE EDUCATORS B/CING., INC.)
WBFS-TV (Channel 33; MIAMI, FL; Owner: VIACOM STATIONS GROUP OF MIAMI INC.)
Gulf Stream fatal accident list:
Dec 26, 2014 04:10 PM, Sr-A1a, Lat: 26.476483, Lon: -80.056658, Vehicles: 1, Persons: 1, Pedestrians: 1, Fatalities: 1Lat: 26.700490, Lon: -80.033350, Vehicles: 1, Persons: 1, Fatalities: 1, Drunk persons involved: 1Vehicles: 2, Persons: 2, Fatalities: 1Vehicles: 1, Persons: 2, Fatalities: 1, Drunk persons involved: 1Vehicles: 2, Persons: 3, Fatalities: 2, Drunk persons involved: 2
FCC Registered Broadcast Land Mobile Towers: 3
Lat: 26.490611 Lon: -80.055306, Call Sign: WPUC761, Assigned Frequencies: 452.537 MHz, 457.312 MHz, 457.837 MHz, Grant Date: 02/05/2002, Expiration Date: 02/05/2012, Cancellation Date: 04/07/2012, Certifier: Mark Henderson, Registrant: Cara Enterprises Inc, Salt Lake City, UT 84117-0503, Phone: (801) 278-9728, Fax: (801) 278-7239L1, 4333 N Ocean Blvd (Lat: 26.502667 Lon: -80.052389), Call Sign: WQSG884, Assigned Frequencies: 466.525 MHz, 469.200 MHz, Grant Date: 07/18/2023, Expiration Date: 09/18/2033, Certifier: Thomas Hill, Registrant: Federal Licensing Inc, 1588 Fairfield Road, Gettysburg, PA 17325, Phone: (717) 334-9262, Fax: (717) 334-6440, Email:
GULF STREAM, 3600 Gulf Stream Rd (Lat: 26.498444 Lon: -80.053694), Call Sign: WRCY962, Assigned Frequencies: 452.862 MHz, Grant Date: 03/01/2019, Expiration Date: 03/01/2029, Certifier: Hugh Mcgraw, Registrant: Citation Communications, 1855 Indian Rd, Wpb, FL 33409, Phone: (561) 688-0330, Email:
FCC Registered Amateur Radio Licenses: 3
Call Sign: KQ1R, Previous Call Sign: N1CRY, Grant Date: 02/06/1990, Expiration Date: 02/06/2000, Cancellation Date: 03/07/2002, Registrant: Bruce E Hedendal, 3345 Oleander Way, Gulf Stream, FL 33483Call Sign: WA8PAF, Licensee ID: L01185241, Grant Date: 08/23/2006, Expiration Date: 11/05/2016, Cancellation Date: 03/07/2015, Certifier: Brent R Grover, Registrant: Brent R Grover, 3960 No Ocean Blvd Ste 3, Gulf Stream, FL 33483Call Sign: K8OOO, Previous Call Sign: WA8PAF, Licensee ID: L01185241, Grant Date: 03/07/2015, Expiration Date: 03/07/2025, Certifier: Brent R Grover, Registrant: Brent R Grover, 3960 No Ocean Blvd Ste 3, Gulf Stream, FL 33483
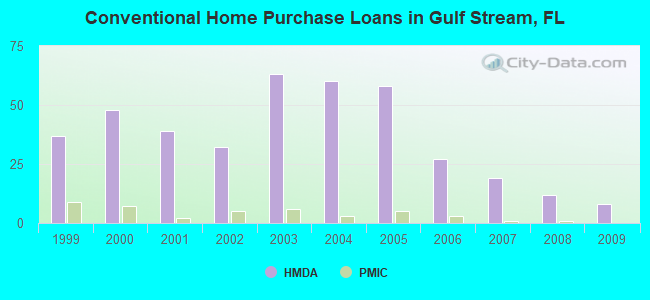
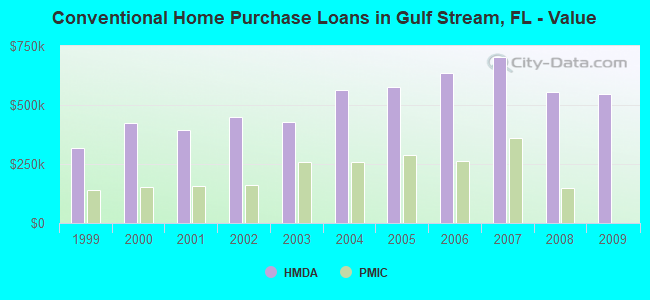
Home Mortgage Disclosure Act Aggregated Statistics For Year 2009(Based on 2 partial tracts) B) Conventional C) Refinancings D) Home Improvement Loans F) Non-occupant Loans on Number Average Value Number Average Value Number Average Value Number Average Value
LOANS ORIGINATED 8 $547,471 19 $539,027 0 $0 7 $627,339 APPLICATIONS APPROVED, NOT ACCEPTED 1 $814,770 2 $864,285 0 $0 1 $294,770 APPLICATIONS DENIED 2 $597,830 14 $562,551 1 $145,040 6 $470,947 APPLICATIONS WITHDRAWN 2 $801,400 6 $656,012 0 $0 3 $897,910 FILES CLOSED FOR INCOMPLETENESS 0 $0 2 $446,190 0 $0 1 $578,420
Aggregated Statistics For Year 2008(Based on 2 partial tracts) B) Conventional C) Refinancings D) Home Improvement Loans F) Non-occupant Loans on G) Loans On Manufactured Number Average Value Number Average Value Number Average Value Number Average Value Number Average Value
LOANS ORIGINATED 12 $556,821 14 $661,919 1 $260,770 8 $476,040 0 $0 APPLICATIONS APPROVED, NOT ACCEPTED 3 $498,197 6 $396,972 1 $150,770 1 $520,470 1 $147,300 APPLICATIONS DENIED 3 $400,913 17 $900,473 1 $1,052,420 5 $1,005,600 0 $0 APPLICATIONS WITHDRAWN 3 $301,453 5 $613,844 1 $221,490 3 $404,970 0 $0 FILES CLOSED FOR INCOMPLETENESS 1 $601,560 3 $766,207 0 $0 1 $1,172,930 0 $0
Aggregated Statistics For Year 2007(Based on 2 partial tracts) B) Conventional C) Refinancings D) Home Improvement Loans E) Loans on Dwellings For 5+ Families F) Non-occupant Loans on Number Average Value Number Average Value Number Average Value Number Average Value Number Average Value
LOANS ORIGINATED 19 $704,365 31 $610,729 3 $540,427 1 $713,180 19 $706,107 APPLICATIONS APPROVED, NOT ACCEPTED 3 $627,923 10 $397,288 1 $107,510 0 $0 4 $403,628 APPLICATIONS DENIED 4 $665,025 20 $597,822 1 $112,470 0 $0 6 $564,872 APPLICATIONS WITHDRAWN 3 $697,427 9 $598,867 0 $0 0 $0 3 $407,330 FILES CLOSED FOR INCOMPLETENESS 1 $665,430 1 $633,520 0 $0 0 $0 0 $0
Aggregated Statistics For Year 2006(Based on 2 partial tracts) B) Conventional C) Refinancings D) Home Improvement Loans F) Non-occupant Loans on Number Average Value Number Average Value Number Average Value Number Average Value
LOANS ORIGINATED 27 $637,222 38 $607,323 2 $238,860 26 $572,475 APPLICATIONS APPROVED, NOT ACCEPTED 7 $425,176 10 $607,068 1 $244,780 5 $605,362 APPLICATIONS DENIED 13 $468,118 16 $576,350 2 $99,360 10 $415,015 APPLICATIONS WITHDRAWN 5 $783,844 12 $848,703 1 $139,330 7 $702,904 FILES CLOSED FOR INCOMPLETENESS 3 $479,237 3 $721,327 0 $0 1 $367,340
Aggregated Statistics For Year 2005(Based on 2 partial tracts) B) Conventional C) Refinancings D) Home Improvement Loans E) Loans on Dwellings For 5+ Families F) Non-occupant Loans on Number Average Value Number Average Value Number Average Value Number Average Value Number Average Value
LOANS ORIGINATED 58 $575,874 37 $528,319 3 $407,350 2 $1,119,380 35 $457,203 APPLICATIONS APPROVED, NOT ACCEPTED 7 $529,980 8 $459,770 0 $0 0 $0 4 $468,345 APPLICATIONS DENIED 15 $759,166 17 $632,541 2 $387,075 0 $0 8 $552,350 APPLICATIONS WITHDRAWN 10 $473,408 13 $599,351 1 $200,240 0 $0 4 $435,700 FILES CLOSED FOR INCOMPLETENESS 2 $230,190 2 $628,875 1 $146,770 0 $0 1 $113,470
Aggregated Statistics For Year 2004(Based on 2 partial tracts) B) Conventional C) Refinancings D) Home Improvement Loans E) Loans on Dwellings For 5+ Families F) Non-occupant Loans on G) Loans On Manufactured Number Average Value Number Average Value Number Average Value Number Average Value Number Average Value Number Average Value
LOANS ORIGINATED 60 $564,765 40 $487,955 3 $133,030 2 $629,480 31 $514,795 1 $54,190 APPLICATIONS APPROVED, NOT ACCEPTED 5 $739,180 6 $267,238 1 $99,770 0 $0 3 $531,900 0 $0 APPLICATIONS DENIED 13 $531,550 16 $521,786 3 $126,220 0 $0 7 $472,323 0 $0 APPLICATIONS WITHDRAWN 7 $477,851 11 $502,910 0 $0 0 $0 5 $321,122 0 $0 FILES CLOSED FOR INCOMPLETENESS 3 $785,973 2 $454,230 0 $0 0 $0 1 $727,400 0 $0
Aggregated Statistics For Year 2003(Based on 2 partial tracts) B) Conventional C) Refinancings D) Home Improvement Loans E) Loans on Dwellings For 5+ Families F) Non-occupant Loans on Number Average Value Number Average Value Number Average Value Number Average Value Number Average Value
LOANS ORIGINATED 63 $426,212 102 $404,630 4 $54,058 2 $1,659,365 38 $356,414 APPLICATIONS APPROVED, NOT ACCEPTED 6 $502,097 14 $638,946 3 $69,590 0 $0 6 $373,740 APPLICATIONS DENIED 9 $338,793 25 $446,756 3 $46,013 0 $0 5 $438,900 APPLICATIONS WITHDRAWN 9 $300,332 14 $322,422 0 $0 1 $766,820 2 $255,460 FILES CLOSED FOR INCOMPLETENESS 1 $290,420 3 $265,217 0 $0 0 $0 0 $0
Aggregated Statistics For Year 2002(Based on 1 partial tract) B) Conventional C) Refinancings D) Home Improvement Loans F) Non-occupant Loans on Number Average Value Number Average Value Number Average Value Number Average Value
LOANS ORIGINATED 32 $448,851 48 $402,336 2 $179,670 20 $359,244 APPLICATIONS APPROVED, NOT ACCEPTED 4 $469,628 13 $810,044 1 $120,020 3 $601,923 APPLICATIONS DENIED 4 $484,085 12 $569,402 2 $68,010 2 $933,980 APPLICATIONS WITHDRAWN 4 $607,652 7 $560,410 0 $0 2 $647,205 FILES CLOSED FOR INCOMPLETENESS 0 $0 2 $639,930 0 $0 0 $0
Aggregated Statistics For Year 2001(Based on 1 partial tract) A) FHA, FSA/RHS & VA B) Conventional C) Refinancings D) Home Improvement Loans F) Non-occupant Loans on Number Average Value Number Average Value Number Average Value Number Average Value Number Average Value
LOANS ORIGINATED 1 $48,740 39 $393,449 37 $323,585 4 $181,032 21 $322,480 APPLICATIONS APPROVED, NOT ACCEPTED 0 $0 4 $548,188 8 $264,682 0 $0 1 $91,650 APPLICATIONS DENIED 0 $0 5 $832,000 12 $365,216 1 $18,910 2 $728,310 APPLICATIONS WITHDRAWN 0 $0 2 $358,065 7 $394,874 1 $365,520 0 $0 FILES CLOSED FOR INCOMPLETENESS 0 $0 1 $128,020 3 $406,010 0 $0 1 $519,360
Aggregated Statistics For Year 2000(Based on 1 partial tract) A) FHA, FSA/RHS & VA B) Conventional C) Refinancings D) Home Improvement Loans F) Non-occupant Loans on Number Average Value Number Average Value Number Average Value Number Average Value Number Average Value
LOANS ORIGINATED 1 $114,930 48 $421,945 6 $165,543 1 $84,380 10 $348,243 APPLICATIONS APPROVED, NOT ACCEPTED 0 $0 5 $263,174 4 $215,948 1 $23,640 2 $248,225 APPLICATIONS DENIED 0 $0 5 $409,672 5 $292,124 3 $131,173 1 $113,840 APPLICATIONS WITHDRAWN 0 $0 5 $462,262 4 $188,125 0 $0 0 $0 FILES CLOSED FOR INCOMPLETENESS 0 $0 3 $487,117 3 $289,383 0 $0 1 $147,660
Aggregated Statistics For Year 1999(Based on 1 partial tract) A) FHA, FSA/RHS & VA B) Conventional C) Refinancings D) Home Improvement Loans F) Non-occupant Loans on Number Average Value Number Average Value Number Average Value Number Average Value Number Average Value
LOANS ORIGINATED 1 $53,180 37 $318,651 19 $266,800 2 $55,200 9 $262,211 APPLICATIONS APPROVED, NOT ACCEPTED 0 $0 4 $241,680 5 $312,500 0 $0 1 $78,090 APPLICATIONS DENIED 0 $0 6 $1,036,167 5 $380,560 2 $27,770 0 $0 APPLICATIONS WITHDRAWN 0 $0 6 $248,692 5 $300,450 0 $0 1 $293,180 FILES CLOSED FOR INCOMPLETENESS 0 $0 2 $1,168,675 3 $155,847 0 $0 0 $0
Detailed HMDA statistics for the following Tracts:
0054.03
, 0064.01
Private Mortgage Insurance Companies Aggregated Statistics For Year 2008(Based on 2 partial tracts) A) Conventional Number Average Value
LOANS ORIGINATED 1 $147,380 APPLICATIONS APPROVED, NOT ACCEPTED 1 $126,940 APPLICATIONS DENIED 0 $0 APPLICATIONS WITHDRAWN 0 $0 FILES CLOSED FOR INCOMPLETENESS 0 $0
Aggregated Statistics For Year 2007(Based on 2 partial tracts) A) Conventional C) Non-occupant Loans on Number Average Value Number Average Value
LOANS ORIGINATED 1 $361,300 1 $213,740 APPLICATIONS APPROVED, NOT ACCEPTED 0 $0 0 $0 APPLICATIONS DENIED 0 $0 0 $0 APPLICATIONS WITHDRAWN 0 $0 0 $0 FILES CLOSED FOR INCOMPLETENESS 0 $0 0 $0
Aggregated Statistics For Year 2006(Based on 2 partial tracts) A) Conventional C) Non-occupant Loans on Number Average Value Number Average Value
LOANS ORIGINATED 3 $260,903 2 $193,080 APPLICATIONS APPROVED, NOT ACCEPTED 2 $257,970 1 $265,350 APPLICATIONS DENIED 0 $0 0 $0 APPLICATIONS WITHDRAWN 0 $0 0 $0 FILES CLOSED FOR INCOMPLETENESS 0 $0 0 $0
Aggregated Statistics For Year 2005(Based on 2 partial tracts) A) Conventional C) Non-occupant Loans on Number Average Value Number Average Value
LOANS ORIGINATED 5 $288,412 3 $274,673 APPLICATIONS APPROVED, NOT ACCEPTED 1 $319,690 1 $235,310 APPLICATIONS DENIED 0 $0 0 $0 APPLICATIONS WITHDRAWN 0 $0 0 $0 FILES CLOSED FOR INCOMPLETENESS 0 $0 0 $0
Aggregated Statistics For Year 2004(Based on 2 partial tracts) A) Conventional C) Non-occupant Loans on Number Average Value Number Average Value
LOANS ORIGINATED 3 $259,660 1 $162,560 APPLICATIONS APPROVED, NOT ACCEPTED 0 $0 0 $0 APPLICATIONS DENIED 1 $190,790 0 $0 APPLICATIONS WITHDRAWN 0 $0 0 $0 FILES CLOSED FOR INCOMPLETENESS 0 $0 0 $0
Aggregated Statistics For Year 2003(Based on 2 partial tracts) A) Conventional B) Refinancings C) Non-occupant Loans on Number Average Value Number Average Value Number Average Value
LOANS ORIGINATED 6 $256,958 1 $77,410 1 $59,230 APPLICATIONS APPROVED, NOT ACCEPTED 2 $175,245 0 $0 0 $0 APPLICATIONS DENIED 0 $0 0 $0 0 $0 APPLICATIONS WITHDRAWN 1 $407,860 0 $0 0 $0 FILES CLOSED FOR INCOMPLETENESS 0 $0 0 $0 0 $0
Aggregated Statistics For Year 2002(Based on 1 partial tract) A) Conventional B) Refinancings C) Non-occupant Loans on Number Average Value Number Average Value Number Average Value
LOANS ORIGINATED 5 $162,428 0 $0 1 $125,480 APPLICATIONS APPROVED, NOT ACCEPTED 1 $285,140 0 $0 0 $0 APPLICATIONS DENIED 0 $0 0 $0 0 $0 APPLICATIONS WITHDRAWN 0 $0 1 $75,650 0 $0 FILES CLOSED FOR INCOMPLETENESS 0 $0 0 $0 0 $0
Aggregated Statistics For Year 2001(Based on 1 partial tract) A) Conventional C) Non-occupant Loans on Number Average Value Number Average Value
LOANS ORIGINATED 2 $155,480 1 $208,040 APPLICATIONS APPROVED, NOT ACCEPTED 3 $168,877 0 $0 APPLICATIONS DENIED 0 $0 0 $0 APPLICATIONS WITHDRAWN 1 $44,370 1 $44,370 FILES CLOSED FOR INCOMPLETENESS 0 $0 0 $0
Aggregated Statistics For Year 2000(Based on 1 partial tract) A) Conventional C) Non-occupant Loans on Number Average Value Number Average Value
LOANS ORIGINATED 7 $151,091 1 $170,940 APPLICATIONS APPROVED, NOT ACCEPTED 1 $63,650 0 $0 APPLICATIONS DENIED 0 $0 0 $0 APPLICATIONS WITHDRAWN 1 $89,110 0 $0 FILES CLOSED FOR INCOMPLETENESS 0 $0 0 $0
Aggregated Statistics For Year 1999(Based on 1 partial tract) A) Conventional B) Refinancings C) Non-occupant Loans on Number Average Value Number Average Value Number Average Value
LOANS ORIGINATED 9 $138,118 2 $145,750 1 $170,660 APPLICATIONS APPROVED, NOT ACCEPTED 1 $117,140 0 $0 0 $0 APPLICATIONS DENIED 3 $232,367 0 $0 0 $0 APPLICATIONS WITHDRAWN 0 $0 0 $0 0 $0 FILES CLOSED FOR INCOMPLETENESS 0 $0 0 $0 0 $0
Detailed PMIC statistics for the following Tracts:
0054.03
, 0064.01 Gulf Stream compared to Florida state average:
Median household income significantly above state average. Median house value significantly above state average. Unemployed percentage significantly below state average. Black race population percentage significantly below state average. Hispanic race population percentage significantly below state average. Median age significantly above state average. Renting percentage significantly below state average. Length of stay since moving in significantly above state average. Number of rooms per house above state average. Percentage of population with a bachelor's degree or higher significantly above state average. Gulf Stream on our top lists :
#10 on the list of "Top 101 cities with the most residents born in Other Northern Europe (population 500+)"
#23 on the list of "Top 100 cities with highest median household income"
#43 on the list of "Top 101 cities with the most residents born in Other South America (population 500+)"
#61 on the list of "Top 101 cities with the most residents born in Sweden (population 500+)"
#68 (33483) on the list of "Top 101 zip codes with the highest 2012 average net capital gain/loss (pop 5,000+)"
#74 (33483) on the list of "Top 101 zip codes with the highest 2012 average taxable interest for individuals (pop 5,000+)"
#6 on the list of "Top 101 counties with the largest number of people without health insurance coverage in 2000 (pop. 50,000+)"
#8 on the list of "Top 101 counties with the lowest average weight of females"
#10 on the list of "Top 101 counties with the highest ground withdrawal of fresh water for public supply"
#28 on the list of "Top 101 counties with the highest total withdrawal of fresh water for public supply"
#35 on the list of "Top 101 counties with the most Evangelical Protestant congregations"
There are 3 pilots and no other airmen in this city.
Top Patent Applicants
Richard Viens (3)
David T. Green (2)
John Woolley (2)
Robert W. Ittmann (1)
Mark Templeton (1)
Safwat F. Fahmy (1)
John Hamann (1)
Total of 11 patent applications in 2008-2024.


 Recent articles from our blog. Our writers, many of them Ph.D. graduates or candidates, create easy-to-read articles on a wide variety of topics.

 (2.6 miles