Gurnee, Illinois Submit your own pictures of this village and show them to the world
OSM Map
General Map
Google Map
MSN Map
OSM Map
General Map
Google Map
MSN Map
OSM Map
General Map
Google Map
MSN Map
OSM Map
General Map
Google Map
MSN Map
Please wait while loading the map...
Population in 2022: 30,303 (100% urban, 0% rural). Population change since 2000: +5.1%Males: 14,797 Females: 15,506
March 2022 cost of living index in Gurnee: 97.4 (near average, U.S. average is 100) Percentage of residents living in poverty in 2022: 4.3%for White Non-Hispanic residents , 10.9% for Black residents , 7.4% for Hispanic or Latino residents , 6.6% for other race residents , 6.4% for two or more races residents )
Profiles of local businesses
Business Search - 14 Million verified businesses
Data:
Median household income ($)
Median household income (% change since 2000)
Household income diversity
Ratio of average income to average house value (%)
Ratio of average income to average rent
Median household income ($) - White
Median household income ($) - Black or African American
Median household income ($) - Asian
Median household income ($) - Hispanic or Latino
Median household income ($) - American Indian and Alaska Native
Median household income ($) - Multirace
Median household income ($) - Other Race
Median household income for houses/condos with a mortgage ($)
Median household income for apartments without a mortgage ($)
Races - White alone (%)
Races - White alone (% change since 2000)
Races - Black alone (%)
Races - Black alone (% change since 2000)
Races - American Indian alone (%)
Races - American Indian alone (% change since 2000)
Races - Asian alone (%)
Races - Asian alone (% change since 2000)
Races - Hispanic (%)
Races - Hispanic (% change since 2000)
Races - Native Hawaiian and Other Pacific Islander alone (%)
Races - Native Hawaiian and Other Pacific Islander alone (% change since 2000)
Races - Two or more races (%)
Races - Two or more races (% change since 2000)
Races - Other race alone (%)
Races - Other race alone (% change since 2000)
Racial diversity
Unemployment (%)
Unemployment (% change since 2000)
Unemployment (%) - White
Unemployment (%) - Black or African American
Unemployment (%) - Asian
Unemployment (%) - Hispanic or Latino
Unemployment (%) - American Indian and Alaska Native
Unemployment (%) - Multirace
Unemployment (%) - Other Race
Population density (people per square mile)
Population - Males (%)
Population - Females (%)
Population - Males (%) - White
Population - Males (%) - Black or African American
Population - Males (%) - Asian
Population - Males (%) - Hispanic or Latino
Population - Males (%) - American Indian and Alaska Native
Population - Males (%) - Multirace
Population - Males (%) - Other Race
Population - Females (%) - White
Population - Females (%) - Black or African American
Population - Females (%) - Asian
Population - Females (%) - Hispanic or Latino
Population - Females (%) - American Indian and Alaska Native
Population - Females (%) - Multirace
Population - Females (%) - Other Race
Coronavirus confirmed cases (Apr 19, 2024)
Deaths caused by coronavirus (Apr 19, 2024)
Coronavirus confirmed cases (per 100k population) (Apr 19, 2024)
Deaths caused by coronavirus (per 100k population) (Apr 19, 2024)
Daily increase in number of cases (Apr 19, 2024)
Weekly increase in number of cases (Apr 19, 2024)
Cases doubled (in days) (Apr 19, 2024)
Hospitalized patients (Apr 18, 2022)
Negative test results (Apr 18, 2022)
Total test results (Apr 18, 2022)
COVID Vaccine doses distributed (per 100k population) (Sep 19, 2023)
COVID Vaccine doses administered (per 100k population) (Sep 19, 2023)
COVID Vaccine doses distributed (Sep 19, 2023)
COVID Vaccine doses administered (Sep 19, 2023)
Likely homosexual households (%)
Likely homosexual households (% change since 2000)
Likely homosexual households - Lesbian couples (%)
Likely homosexual households - Lesbian couples (% change since 2000)
Likely homosexual households - Gay men (%)
Likely homosexual households - Gay men (% change since 2000)
Cost of living index
Median gross rent ($)
Median contract rent ($)
Median monthly housing costs ($)
Median house or condo value ($)
Median house or condo value ($ change since 2000)
Mean house or condo value by units in structure - 1, detached ($)
Mean house or condo value by units in structure - 1, attached ($)
Mean house or condo value by units in structure - 2 ($)
Mean house or condo value by units in structure by units in structure - 3 or 4 ($)
Mean house or condo value by units in structure - 5 or more ($)
Mean house or condo value by units in structure - Boat, RV, van, etc. ($)
Mean house or condo value by units in structure - Mobile home ($)
Median house or condo value ($) - White
Median house or condo value ($) - Black or African American
Median house or condo value ($) - Asian
Median house or condo value ($) - Hispanic or Latino
Median house or condo value ($) - American Indian and Alaska Native
Median house or condo value ($) - Multirace
Median house or condo value ($) - Other Race
Median resident age
Resident age diversity
Median resident age - Males
Median resident age - Females
Median resident age - White
Median resident age - Black or African American
Median resident age - Asian
Median resident age - Hispanic or Latino
Median resident age - American Indian and Alaska Native
Median resident age - Multirace
Median resident age - Other Race
Median resident age - Males - White
Median resident age - Males - Black or African American
Median resident age - Males - Asian
Median resident age - Males - Hispanic or Latino
Median resident age - Males - American Indian and Alaska Native
Median resident age - Males - Multirace
Median resident age - Males - Other Race
Median resident age - Females - White
Median resident age - Females - Black or African American
Median resident age - Females - Asian
Median resident age - Females - Hispanic or Latino
Median resident age - Females - American Indian and Alaska Native
Median resident age - Females - Multirace
Median resident age - Females - Other Race
Commute - mean travel time to work (minutes)
Travel time to work - Less than 5 minutes (%)
Travel time to work - Less than 5 minutes (% change since 2000)
Travel time to work - 5 to 9 minutes (%)
Travel time to work - 5 to 9 minutes (% change since 2000)
Travel time to work - 10 to 19 minutes (%)
Travel time to work - 10 to 19 minutes (% change since 2000)
Travel time to work - 20 to 29 minutes (%)
Travel time to work - 20 to 29 minutes (% change since 2000)
Travel time to work - 30 to 39 minutes (%)
Travel time to work - 30 to 39 minutes (% change since 2000)
Travel time to work - 40 to 59 minutes (%)
Travel time to work - 40 to 59 minutes (% change since 2000)
Travel time to work - 60 to 89 minutes (%)
Travel time to work - 60 to 89 minutes (% change since 2000)
Travel time to work - 90 or more minutes (%)
Travel time to work - 90 or more minutes (% change since 2000)
Marital status - Never married (%)
Marital status - Now married (%)
Marital status - Separated (%)
Marital status - Widowed (%)
Marital status - Divorced (%)
Median family income ($)
Median family income (% change since 2000)
Median non-family income ($)
Median non-family income (% change since 2000)
Median per capita income ($)
Median per capita income (% change since 2000)
Median family income ($) - White
Median family income ($) - Black or African American
Median family income ($) - Asian
Median family income ($) - Hispanic or Latino
Median family income ($) - American Indian and Alaska Native
Median family income ($) - Multirace
Median family income ($) - Other Race
Median year house/condo built
Median year apartment built
Year house built - Built 2005 or later (%)
Year house built - Built 2000 to 2004 (%)
Year house built - Built 1990 to 1999 (%)
Year house built - Built 1980 to 1989 (%)
Year house built - Built 1970 to 1979 (%)
Year house built - Built 1960 to 1969 (%)
Year house built - Built 1950 to 1959 (%)
Year house built - Built 1940 to 1949 (%)
Year house built - Built 1939 or earlier (%)
Average household size
Household density (households per square mile)
Average household size - White
Average household size - Black or African American
Average household size - Asian
Average household size - Hispanic or Latino
Average household size - American Indian and Alaska Native
Average household size - Multirace
Average household size - Other Race
Occupied housing units (%)
Vacant housing units (%)
Owner occupied housing units (%)
Renter occupied housing units (%)
Vacancy status - For rent (%)
Vacancy status - For sale only (%)
Vacancy status - Rented or sold, not occupied (%)
Vacancy status - For seasonal, recreational, or occasional use (%)
Vacancy status - For migrant workers (%)
Vacancy status - Other vacant (%)
Residents with income below the poverty level (%)
Residents with income below 50% of the poverty level (%)
Children below poverty level (%)
Poor families by family type - Married-couple family (%)
Poor families by family type - Male, no wife present (%)
Poor families by family type - Female, no husband present (%)
Poverty status for native-born residents (%)
Poverty status for foreign-born residents (%)
Poverty among high school graduates not in families (%)
Poverty among people who did not graduate high school not in families (%)
Residents with income below the poverty level (%) - White
Residents with income below the poverty level (%) - Black or African American
Residents with income below the poverty level (%) - Asian
Residents with income below the poverty level (%) - Hispanic or Latino
Residents with income below the poverty level (%) - American Indian and Alaska Native
Residents with income below the poverty level (%) - Multirace
Residents with income below the poverty level (%) - Other Race
Air pollution - Air Quality Index (AQI)
Air pollution - CO
Air pollution - NO2
Air pollution - SO2
Air pollution - Ozone
Air pollution - PM10
Air pollution - PM25
Air pollution - Pb
Crime - Murders per 100,000 population
Crime - Rapes per 100,000 population
Crime - Robberies per 100,000 population
Crime - Assaults per 100,000 population
Crime - Burglaries per 100,000 population
Crime - Thefts per 100,000 population
Crime - Auto thefts per 100,000 population
Crime - Arson per 100,000 population
Crime - City-data.com crime index
Crime - Violent crime index
Crime - Property crime index
Crime - Murders per 100,000 population (5 year average)
Crime - Rapes per 100,000 population (5 year average)
Crime - Robberies per 100,000 population (5 year average)
Crime - Assaults per 100,000 population (5 year average)
Crime - Burglaries per 100,000 population (5 year average)
Crime - Thefts per 100,000 population (5 year average)
Crime - Auto thefts per 100,000 population (5 year average)
Crime - Arson per 100,000 population (5 year average)
Crime - City-data.com crime index (5 year average)
Crime - Violent crime index (5 year average)
Crime - Property crime index (5 year average)
1996 Presidential Elections Results (%) - Democratic Party (Clinton)
1996 Presidential Elections Results (%) - Republican Party (Dole)
1996 Presidential Elections Results (%) - Other
2000 Presidential Elections Results (%) - Democratic Party (Gore)
2000 Presidential Elections Results (%) - Republican Party (Bush)
2000 Presidential Elections Results (%) - Other
2004 Presidential Elections Results (%) - Democratic Party (Kerry)
2004 Presidential Elections Results (%) - Republican Party (Bush)
2004 Presidential Elections Results (%) - Other
2008 Presidential Elections Results (%) - Democratic Party (Obama)
2008 Presidential Elections Results (%) - Republican Party (McCain)
2008 Presidential Elections Results (%) - Other
2012 Presidential Elections Results (%) - Democratic Party (Obama)
2012 Presidential Elections Results (%) - Republican Party (Romney)
2012 Presidential Elections Results (%) - Other
2016 Presidential Elections Results (%) - Democratic Party (Clinton)
2016 Presidential Elections Results (%) - Republican Party (Trump)
2016 Presidential Elections Results (%) - Other
2020 Presidential Elections Results (%) - Democratic Party (Biden)
2020 Presidential Elections Results (%) - Republican Party (Trump)
2020 Presidential Elections Results (%) - Other
Ancestries Reported - Arab (%)
Ancestries Reported - Czech (%)
Ancestries Reported - Danish (%)
Ancestries Reported - Dutch (%)
Ancestries Reported - English (%)
Ancestries Reported - French (%)
Ancestries Reported - French Canadian (%)
Ancestries Reported - German (%)
Ancestries Reported - Greek (%)
Ancestries Reported - Hungarian (%)
Ancestries Reported - Irish (%)
Ancestries Reported - Italian (%)
Ancestries Reported - Lithuanian (%)
Ancestries Reported - Norwegian (%)
Ancestries Reported - Polish (%)
Ancestries Reported - Portuguese (%)
Ancestries Reported - Russian (%)
Ancestries Reported - Scotch-Irish (%)
Ancestries Reported - Scottish (%)
Ancestries Reported - Slovak (%)
Ancestries Reported - Subsaharan African (%)
Ancestries Reported - Swedish (%)
Ancestries Reported - Swiss (%)
Ancestries Reported - Ukrainian (%)
Ancestries Reported - United States (%)
Ancestries Reported - Welsh (%)
Ancestries Reported - West Indian (%)
Ancestries Reported - Other (%)
Educational Attainment - No schooling completed (%)
Educational Attainment - Less than high school (%)
Educational Attainment - High school or equivalent (%)
Educational Attainment - Less than 1 year of college (%)
Educational Attainment - 1 or more years of college (%)
Educational Attainment - Associate degree (%)
Educational Attainment - Bachelor's degree (%)
Educational Attainment - Master's degree (%)
Educational Attainment - Professional school degree (%)
Educational Attainment - Doctorate degree (%)
School Enrollment - Nursery, preschool (%)
School Enrollment - Kindergarten (%)
School Enrollment - Grade 1 to 4 (%)
School Enrollment - Grade 5 to 8 (%)
School Enrollment - Grade 9 to 12 (%)
School Enrollment - College undergrad (%)
School Enrollment - Graduate or professional (%)
School Enrollment - Not enrolled in school (%)
School enrollment - Public schools (%)
School enrollment - Private schools (%)
School enrollment - Not enrolled (%)
Median number of rooms in houses and condos
Median number of rooms in apartments
Housing units lacking complete plumbing facilities (%)
Housing units lacking complete kitchen facilities (%)
Density of houses
Urban houses (%)
Rural houses (%)
Households with people 60 years and over (%)
Households with people 65 years and over (%)
Households with people 75 years and over (%)
Households with one or more nonrelatives (%)
Households with no nonrelatives (%)
Population in households (%)
Family households (%)
Nonfamily households (%)
Population in families (%)
Family households with own children (%)
Median number of bedrooms in owner occupied houses
Mean number of bedrooms in owner occupied houses
Median number of bedrooms in renter occupied houses
Mean number of bedrooms in renter occupied houses
Median number of vehichles in owner occupied houses
Mean number of vehichles in owner occupied houses
Median number of vehichles in renter occupied houses
Mean number of vehichles in renter occupied houses
Mortgage status - with mortgage (%)
Mortgage status - with second mortgage (%)
Mortgage status - with home equity loan (%)
Mortgage status - with both second mortgage and home equity loan (%)
Mortgage status - without a mortgage (%)
Average family size
Average family size - White
Average family size - Black or African American
Average family size - Asian
Average family size - Hispanic or Latino
Average family size - American Indian and Alaska Native
Average family size - Multirace
Average family size - Other Race
Geographical mobility - Same house 1 year ago (%)
Geographical mobility - Moved within same county (%)
Geographical mobility - Moved from different county within same state (%)
Geographical mobility - Moved from different state (%)
Geographical mobility - Moved from abroad (%)
Place of birth - Born in state of residence (%)
Place of birth - Born in other state (%)
Place of birth - Native, outside of US (%)
Place of birth - Foreign born (%)
Housing units in structures - 1, detached (%)
Housing units in structures - 1, attached (%)
Housing units in structures - 2 (%)
Housing units in structures - 3 or 4 (%)
Housing units in structures - 5 to 9 (%)
Housing units in structures - 10 to 19 (%)
Housing units in structures - 20 to 49 (%)
Housing units in structures - 50 or more (%)
Housing units in structures - Mobile home (%)
Housing units in structures - Boat, RV, van, etc. (%)
House/condo owner moved in on average (years ago)
Renter moved in on average (years ago)
Year householder moved into unit - Moved in 1999 to March 2000 (%)
Year householder moved into unit - Moved in 1995 to 1998 (%)
Year householder moved into unit - Moved in 1990 to 1994 (%)
Year householder moved into unit - Moved in 1980 to 1989 (%)
Year householder moved into unit - Moved in 1970 to 1979 (%)
Year householder moved into unit - Moved in 1969 or earlier (%)
Means of transportation to work - Drove car alone (%)
Means of transportation to work - Carpooled (%)
Means of transportation to work - Public transportation (%)
Means of transportation to work - Bus or trolley bus (%)
Means of transportation to work - Streetcar or trolley car (%)
Means of transportation to work - Subway or elevated (%)
Means of transportation to work - Railroad (%)
Means of transportation to work - Ferryboat (%)
Means of transportation to work - Taxicab (%)
Means of transportation to work - Motorcycle (%)
Means of transportation to work - Bicycle (%)
Means of transportation to work - Walked (%)
Means of transportation to work - Other means (%)
Working at home (%)
Industry diversity
Most Common Industries - Agriculture, forestry, fishing and hunting, and mining (%)
Most Common Industries - Agriculture, forestry, fishing and hunting (%)
Most Common Industries - Mining, quarrying, and oil and gas extraction (%)
Most Common Industries - Construction (%)
Most Common Industries - Manufacturing (%)
Most Common Industries - Wholesale trade (%)
Most Common Industries - Retail trade (%)
Most Common Industries - Transportation and warehousing, and utilities (%)
Most Common Industries - Transportation and warehousing (%)
Most Common Industries - Utilities (%)
Most Common Industries - Information (%)
Most Common Industries - Finance and insurance, and real estate and rental and leasing (%)
Most Common Industries - Finance and insurance (%)
Most Common Industries - Real estate and rental and leasing (%)
Most Common Industries - Professional, scientific, and management, and administrative and waste management services (%)
Most Common Industries - Professional, scientific, and technical services (%)
Most Common Industries - Management of companies and enterprises (%)
Most Common Industries - Administrative and support and waste management services (%)
Most Common Industries - Educational services, and health care and social assistance (%)
Most Common Industries - Educational services (%)
Most Common Industries - Health care and social assistance (%)
Most Common Industries - Arts, entertainment, and recreation, and accommodation and food services (%)
Most Common Industries - Arts, entertainment, and recreation (%)
Most Common Industries - Accommodation and food services (%)
Most Common Industries - Other services, except public administration (%)
Most Common Industries - Public administration (%)
Occupation diversity
Most Common Occupations - Management, business, science, and arts occupations (%)
Most Common Occupations - Management, business, and financial occupations (%)
Most Common Occupations - Management occupations (%)
Most Common Occupations - Business and financial operations occupations (%)
Most Common Occupations - Computer, engineering, and science occupations (%)
Most Common Occupations - Computer and mathematical occupations (%)
Most Common Occupations - Architecture and engineering occupations (%)
Most Common Occupations - Life, physical, and social science occupations (%)
Most Common Occupations - Education, legal, community service, arts, and media occupations (%)
Most Common Occupations - Community and social service occupations (%)
Most Common Occupations - Legal occupations (%)
Most Common Occupations - Education, training, and library occupations (%)
Most Common Occupations - Arts, design, entertainment, sports, and media occupations (%)
Most Common Occupations - Healthcare practitioners and technical occupations (%)
Most Common Occupations - Health diagnosing and treating practitioners and other technical occupations (%)
Most Common Occupations - Health technologists and technicians (%)
Most Common Occupations - Service occupations (%)
Most Common Occupations - Healthcare support occupations (%)
Most Common Occupations - Protective service occupations (%)
Most Common Occupations - Fire fighting and prevention, and other protective service workers including supervisors (%)
Most Common Occupations - Law enforcement workers including supervisors (%)
Most Common Occupations - Food preparation and serving related occupations (%)
Most Common Occupations - Building and grounds cleaning and maintenance occupations (%)
Most Common Occupations - Personal care and service occupations (%)
Most Common Occupations - Sales and office occupations (%)
Most Common Occupations - Sales and related occupations (%)
Most Common Occupations - Office and administrative support occupations (%)
Most Common Occupations - Natural resources, construction, and maintenance occupations (%)
Most Common Occupations - Farming, fishing, and forestry occupations (%)
Most Common Occupations - Construction and extraction occupations (%)
Most Common Occupations - Installation, maintenance, and repair occupations (%)
Most Common Occupations - Production, transportation, and material moving occupations (%)
Most Common Occupations - Production occupations (%)
Most Common Occupations - Transportation occupations (%)
Most Common Occupations - Material moving occupations (%)
People in Group quarters - Institutionalized population (%)
People in Group quarters - Correctional institutions (%)
People in Group quarters - Federal prisons and detention centers (%)
People in Group quarters - Halfway houses (%)
People in Group quarters - Local jails and other confinement facilities (including police lockups) (%)
People in Group quarters - Military disciplinary barracks (%)
People in Group quarters - State prisons (%)
People in Group quarters - Other types of correctional institutions (%)
People in Group quarters - Nursing homes (%)
People in Group quarters - Hospitals/wards, hospices, and schools for the handicapped (%)
People in Group quarters - Hospitals/wards and hospices for chronically ill (%)
People in Group quarters - Hospices or homes for chronically ill (%)
People in Group quarters - Military hospitals or wards for chronically ill (%)
People in Group quarters - Other hospitals or wards for chronically ill (%)
People in Group quarters - Hospitals or wards for drug/alcohol abuse (%)
People in Group quarters - Mental (Psychiatric) hospitals or wards (%)
People in Group quarters - Schools, hospitals, or wards for the mentally retarded (%)
People in Group quarters - Schools, hospitals, or wards for the physically handicapped (%)
People in Group quarters - Institutions for the deaf (%)
People in Group quarters - Institutions for the blind (%)
People in Group quarters - Orthopedic wards and institutions for the physically handicapped (%)
People in Group quarters - Wards in general hospitals for patients who have no usual home elsewhere (%)
People in Group quarters - Wards in military hospitals for patients who have no usual home elsewhere (%)
People in Group quarters - Juvenile institutions (%)
People in Group quarters - Long-term care (%)
People in Group quarters - Homes for abused, dependent, and neglected children (%)
People in Group quarters - Residential treatment centers for emotionally disturbed children (%)
People in Group quarters - Training schools for juvenile delinquents (%)
People in Group quarters - Short-term care, detention or diagnostic centers for delinquent children (%)
People in Group quarters - Type of juvenile institution unknown (%)
People in Group quarters - Noninstitutionalized population (%)
People in Group quarters - College dormitories (includes college quarters off campus) (%)
People in Group quarters - Military quarters (%)
People in Group quarters - On base (%)
People in Group quarters - Barracks, unaccompanied personnel housing (UPH), (Enlisted/Officer), ;and similar group living quarters for military personnel (%)
People in Group quarters - Transient quarters for temporary residents (%)
People in Group quarters - Military ships (%)
People in Group quarters - Group homes (%)
People in Group quarters - Homes or halfway houses for drug/alcohol abuse (%)
People in Group quarters - Homes for the mentally ill (%)
People in Group quarters - Homes for the mentally retarded (%)
People in Group quarters - Homes for the physically handicapped (%)
People in Group quarters - Other group homes (%)
People in Group quarters - Religious group quarters (%)
People in Group quarters - Dormitories (%)
People in Group quarters - Agriculture workers' dormitories on farms (%)
People in Group quarters - Job Corps and vocational training facilities (%)
People in Group quarters - Other workers' dormitories (%)
People in Group quarters - Crews of maritime vessels (%)
People in Group quarters - Other nonhousehold living situations (%)
People in Group quarters - Other noninstitutional group quarters (%)
Residents speaking English at home (%)
Residents speaking English at home - Born in the United States (%)
Residents speaking English at home - Native, born elsewhere (%)
Residents speaking English at home - Foreign born (%)
Residents speaking Spanish at home (%)
Residents speaking Spanish at home - Born in the United States (%)
Residents speaking Spanish at home - Native, born elsewhere (%)
Residents speaking Spanish at home - Foreign born (%)
Residents speaking other language at home (%)
Residents speaking other language at home - Born in the United States (%)
Residents speaking other language at home - Native, born elsewhere (%)
Residents speaking other language at home - Foreign born (%)
Class of Workers - Employee of private company (%)
Class of Workers - Self-employed in own incorporated business (%)
Class of Workers - Private not-for-profit wage and salary workers (%)
Class of Workers - Local government workers (%)
Class of Workers - State government workers (%)
Class of Workers - Federal government workers (%)
Class of Workers - Self-employed workers in own not incorporated business and Unpaid family workers (%)
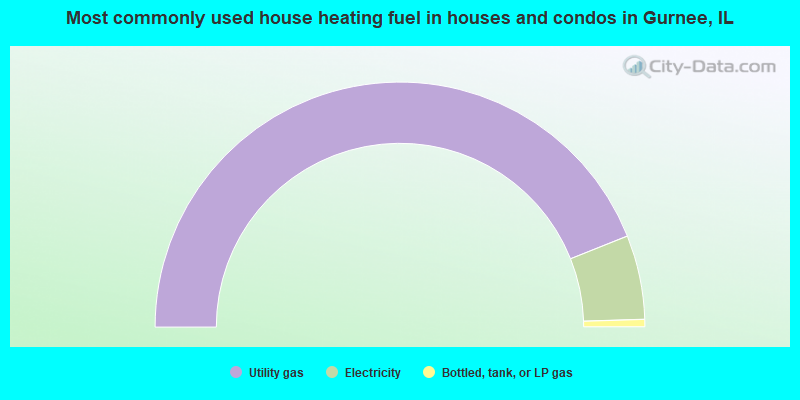
House heating fuel used in houses and condos - Utility gas (%)
House heating fuel used in houses and condos - Bottled, tank, or LP gas (%)
House heating fuel used in houses and condos - Electricity (%)
House heating fuel used in houses and condos - Fuel oil, kerosene, etc. (%)
House heating fuel used in houses and condos - Coal or coke (%)
House heating fuel used in houses and condos - Wood (%)
House heating fuel used in houses and condos - Solar energy (%)
House heating fuel used in houses and condos - Other fuel (%)
House heating fuel used in houses and condos - No fuel used (%)
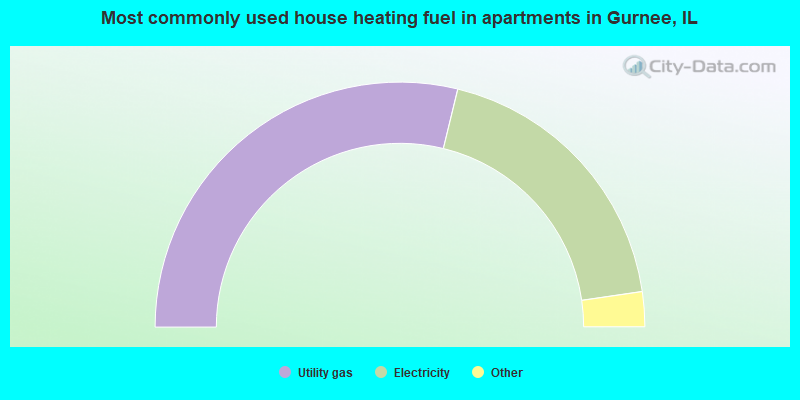
House heating fuel used in apartments - Utility gas (%)
House heating fuel used in apartments - Bottled, tank, or LP gas (%)
House heating fuel used in apartments - Electricity (%)
House heating fuel used in apartments - Fuel oil, kerosene, etc. (%)
House heating fuel used in apartments - Coal or coke (%)
House heating fuel used in apartments - Wood (%)
House heating fuel used in apartments - Solar energy (%)
House heating fuel used in apartments - Other fuel (%)
House heating fuel used in apartments - No fuel used (%)
Armed forces status - In Armed Forces (%)
Armed forces status - Civilian (%)
Armed forces status - Civilian - Veteran (%)
Armed forces status - Civilian - Nonveteran (%)
Fatal accidents locations in years 2005-2021
Fatal accidents locations in 2005
Fatal accidents locations in 2006
Fatal accidents locations in 2007
Fatal accidents locations in 2008
Fatal accidents locations in 2009
Fatal accidents locations in 2010
Fatal accidents locations in 2011
Fatal accidents locations in 2012
Fatal accidents locations in 2013
Fatal accidents locations in 2014
Fatal accidents locations in 2015
Fatal accidents locations in 2016
Fatal accidents locations in 2017
Fatal accidents locations in 2018
Fatal accidents locations in 2019
Fatal accidents locations in 2020
Fatal accidents locations in 2021
Alcohol use - People drinking some alcohol every month (%)
Alcohol use - People not drinking at all (%)
Alcohol use - Average days/month drinking alcohol
Alcohol use - Average drinks/week
Alcohol use - Average days/year people drink much
Audiometry - Average condition of hearing (%)
Audiometry - People that can hear a whisper from across a quiet room (%)
Audiometry - People that can hear normal voice from across a quiet room (%)
Audiometry - Ears ringing, roaring, buzzing (%)
Audiometry - Had a job exposure to loud noise (%)
Audiometry - Had off-work exposure to loud noise (%)
Blood Pressure & Cholesterol - Has high blood pressure (%)
Blood Pressure & Cholesterol - Checking blood pressure at home (%)
Blood Pressure & Cholesterol - Frequently checking blood cholesterol (%)
Blood Pressure & Cholesterol - Has high cholesterol level (%)
Consumer Behavior - Money monthly spent on food at supermarket/grocery store
Consumer Behavior - Money monthly spent on food at other stores
Consumer Behavior - Money monthly spent on eating out
Consumer Behavior - Money monthly spent on carryout/delivered foods
Consumer Behavior - Income spent on food at supermarket/grocery store (%)
Consumer Behavior - Income spent on food at other stores (%)
Consumer Behavior - Income spent on eating out (%)
Consumer Behavior - Income spent on carryout/delivered foods (%)
Current Health Status - General health condition (%)
Current Health Status - Blood donors (%)
Current Health Status - Has blood ever tested for HIV virus (%)
Current Health Status - Left-handed people (%)
Dermatology - People using sunscreen (%)
Diabetes - Diabetics (%)
Diabetes - Had a blood test for high blood sugar (%)
Diabetes - People taking insulin (%)
Diet Behavior & Nutrition - Diet health (%)
Diet Behavior & Nutrition - Milk product consumption (# of products/month)
Diet Behavior & Nutrition - Meals not home prepared (#/week)
Diet Behavior & Nutrition - Meals from fast food or pizza place (#/week)
Diet Behavior & Nutrition - Ready-to-eat foods (#/month)
Diet Behavior & Nutrition - Frozen meals/pizza (#/month)
Drug Use - People that ever used marijuana or hashish (%)
Drug Use - Ever used hard drugs (%)
Drug Use - Ever used any form of cocaine (%)
Drug Use - Ever used heroin (%)
Drug Use - Ever used methamphetamine (%)
Health Insurance - People covered by health insurance (%)
Kidney Conditions-Urology - Avg. # of times urinating at night
Medical Conditions - People with asthma (%)
Medical Conditions - People with anemia (%)
Medical Conditions - People with psoriasis (%)
Medical Conditions - People with overweight (%)
Medical Conditions - Elderly people having difficulties in thinking or remembering (%)
Medical Conditions - People who ever received blood transfusion (%)
Medical Conditions - People having trouble seeing even with glass/contacts (%)
Medical Conditions - People with arthritis (%)
Medical Conditions - People with gout (%)
Medical Conditions - People with congestive heart failure (%)
Medical Conditions - People with coronary heart disease (%)
Medical Conditions - People with angina pectoris (%)
Medical Conditions - People who ever had heart attack (%)
Medical Conditions - People who ever had stroke (%)
Medical Conditions - People with emphysema (%)
Medical Conditions - People with thyroid problem (%)
Medical Conditions - People with chronic bronchitis (%)
Medical Conditions - People with any liver condition (%)
Medical Conditions - People who ever had cancer or malignancy (%)
Mental Health - People who have little interest in doing things (%)
Mental Health - People feeling down, depressed, or hopeless (%)
Mental Health - People who have trouble sleeping or sleeping too much (%)
Mental Health - People feeling tired or having little energy (%)
Mental Health - People with poor appetite or overeating (%)
Mental Health - People feeling bad about themself (%)
Mental Health - People who have trouble concentrating on things (%)
Mental Health - People moving or speaking slowly or too fast (%)
Mental Health - People having thoughts they would be better off dead (%)
Oral Health - Average years since last visit a dentist
Oral Health - People embarrassed because of mouth (%)
Oral Health - People with gum disease (%)
Oral Health - General health of teeth and gums (%)
Oral Health - Average days a week using dental floss/device
Oral Health - Average days a week using mouthwash for dental problem
Oral Health - Average number of teeth
Pesticide Use - Households using pesticides to control insects (%)
Pesticide Use - Households using pesticides to kill weeds (%)
Physical Activity - People doing vigorous-intensity work activities (%)
Physical Activity - People doing moderate-intensity work activities (%)
Physical Activity - People walking or bicycling (%)
Physical Activity - People doing vigorous-intensity recreational activities (%)
Physical Activity - People doing moderate-intensity recreational activities (%)
Physical Activity - Average hours a day doing sedentary activities
Physical Activity - Average hours a day watching TV or videos
Physical Activity - Average hours a day using computer
Physical Functioning - People having limitations keeping them from working (%)
Physical Functioning - People limited in amount of work they can do (%)
Physical Functioning - People that need special equipment to walk (%)
Physical Functioning - People experiencing confusion/memory problems (%)
Physical Functioning - People requiring special healthcare equipment (%)
Prescription Medications - Average number of prescription medicines taking
Preventive Aspirin Use - Adults 40+ taking low-dose aspirin (%)
Reproductive Health - Vaginal deliveries (%)
Reproductive Health - Cesarean deliveries (%)
Reproductive Health - Deliveries resulted in a live birth (%)
Reproductive Health - Pregnancies resulted in a delivery (%)
Reproductive Health - Women breastfeeding newborns (%)
Reproductive Health - Women that had a hysterectomy (%)
Reproductive Health - Women that had both ovaries removed (%)
Reproductive Health - Women that have ever taken birth control pills (%)
Reproductive Health - Women taking birth control pills (%)
Reproductive Health - Women that have ever used Depo-Provera or injectables (%)
Reproductive Health - Women that have ever used female hormones (%)
Sexual Behavior - People 18+ that ever had sex (vaginal, anal, or oral) (%)
Sexual Behavior - Males 18+ that ever had vaginal sex with a woman (%)
Sexual Behavior - Males 18+ that ever performed oral sex on a woman (%)
Sexual Behavior - Males 18+ that ever had anal sex with a woman (%)
Sexual Behavior - Males 18+ that ever had any sex with a man (%)
Sexual Behavior - Females 18+ that ever had vaginal sex with a man (%)
Sexual Behavior - Females 18+ that ever performed oral sex on a man (%)
Sexual Behavior - Females 18+ that ever had anal sex with a man (%)
Sexual Behavior - Females 18+ that ever had any kind of sex with a woman (%)
Sexual Behavior - Average age people first had sex
Sexual Behavior - Average number of female sex partners in lifetime (males 18+)
Sexual Behavior - Average number of female vaginal sex partners in lifetime (males 18+)
Sexual Behavior - Average age people first performed oral sex on a woman (18+)
Sexual Behavior - Average number of woman performed oral sex on in lifetime (18+)
Sexual Behavior - Average number of male sex partners in lifetime (males 18+)
Sexual Behavior - Average number of male anal sex partners in lifetime (males 18+)
Sexual Behavior - Average age people first performed oral sex on a man (18+)
Sexual Behavior - Average number of male oral sex partners in lifetime (18+)
Sexual Behavior - People using protection when performing oral sex (%)
Sexual Behavior - Average number of times people have vaginal or anal sex a year
Sexual Behavior - People having sex without condom (%)
Sexual Behavior - Average number of male sex partners in lifetime (females 18+)
Sexual Behavior - Average number of male vaginal sex partners in lifetime (females 18+)
Sexual Behavior - Average number of female sex partners in lifetime (females 18+)
Sexual Behavior - Circumcised males 18+ (%)
Sleep Disorders - Average hours sleeping at night
Sleep Disorders - People that has trouble sleeping (%)
Smoking-Cigarette Use - People smoking cigarettes (%)
Taste & Smell - People 40+ having problems with smell (%)
Taste & Smell - People 40+ having problems with taste (%)
Taste & Smell - People 40+ that ever had wisdom teeth removed (%)
Taste & Smell - People 40+ that ever had tonsils teeth removed (%)
Taste & Smell - People 40+ that ever had a loss of consciousness because of a head injury (%)
Taste & Smell - People 40+ that ever had a broken nose or other serious injury to face or skull (%)
Taste & Smell - People 40+ that ever had two or more sinus infections (%)
Weight - Average height (inches)
Weight - Average weight (pounds)
Weight - Average BMI
Weight - People that are obese (%)
Weight - People that ever were obese (%)
Weight - People trying to lose weight (%)
According to our research of Illinois and other state lists, there were 23 registered sex offenders living in Gurnee, Illinois as of April 19, 2024 . The ratio of all residents to sex offenders in Gurnee is 1,351 to 1.The ratio of registered sex offenders to all residents in this city is lower than the state average.
Officers per 1,000 residents here:
1.90Illinois average:
2.84
Latest news from Gurnee, IL collected exclusively by city-data.com from local newspapers, TV, and radio stations
Ancestries: German (8.3%), American (7.4%), Polish (6.7%), Italian (5.4%), English (4.2%), Irish (3.3%).
Current Local Time:
Incorporated on 06/21/1929
Land area: 13.4 square miles.
Population density: 2,261 people per square mile (low).
4,919 residents are foreign born (8.9% Asia , 3.6% Latin America , 2.8% Europe ).
This village:
16.2%Illinois:
14.1%
Median real estate property taxes paid for housing units with mortgages in 2022: $8,069 (2.4%)Median real estate property taxes paid for housing units with no mortgage in 2022: $7,155 (2.2%)
Nearest city with pop. 50,000+: Waukegan, IL
Nearest city with pop. 200,000+: Chicago, IL
Nearest cities:
Latitude: 42.37 N, Longitude: 87.93 W
Daytime population change due to commuting: +5,373 (+17.6%)Workers who live and work in this village: 5,509 (32.5%)
Property values in Gurnee, IL
Gurnee tourist attractions:
Single-family new house construction building permits:
2022: 2 buildings , average cost: $314,1002021: 1 building , cost: $675,0002020: 3 buildings , average cost: $160,6002019: 1 building , cost: $230,2002018: 22 buildings , average cost: $160,1002017: 47 buildings , average cost: $152,0002016: 3 buildings , average cost: $283,9002015: 1 building , cost: $175,0002014: 4 buildings , average cost: $338,3002013: 4 buildings , average cost: $340,4002012: 2 buildings , average cost: $340,4002011: 3 buildings , average cost: $340,4002010: 1 building , cost: $341,2002009: 3 buildings , average cost: $349,5002008: 7 buildings , average cost: $370,6002007: 59 buildings , average cost: $342,4002006: 96 buildings , average cost: $341,0002005: 71 buildings , average cost: $312,3002004: 61 buildings , average cost: $174,3002003: 46 buildings , average cost: $172,8002002: 125 buildings , average cost: $168,1002001: 135 buildings , average cost: $190,2002000: 150 buildings , average cost: $179,8001999: 226 buildings , average cost: $155,9001998: 317 buildings , average cost: $156,0001997: 275 buildings , average cost: $155,200Unemployment in December 2023:
Population change in the 1990s: +14,900 (+106.9%).
Most common occupations in Gurnee, IL (%)
Both Males Females
Other management occupations, except farmers and farm managers (7.1%)
Sales representatives, services, wholesale and manufacturing (5.5%)
Other sales and related occupations, including supervisors (4.3%)
Computer specialists (4.2%)
Other office and administrative support workers, including supervisors (3.4%)
Top executives (3.2%)
Engineers (3.1%)
Other management occupations, except farmers and farm managers (9.2%)
Sales representatives, services, wholesale and manufacturing (6.9%)
Top executives (5.1%)
Other sales and related occupations, including supervisors (4.8%)
Computer specialists (4.7%)
Engineers (4.6%)
Other production occupations, including supervisors (3.7%)
Secretaries and administrative assistants (5.8%)
Preschool, kindergarten, elementary, and middle school teachers (5.0%)
Other management occupations, except farmers and farm managers (4.8%)
Registered nurses (4.7%)
Information and record clerks, except customer service representatives (4.7%)
Other office and administrative support workers, including supervisors (4.7%)
Sales representatives, services, wholesale and manufacturing (3.9%)
Tornado activity:
Gurnee-area historical tornado activity is slightly below Illinois state average. It is 27% greater than the overall U.S. average.
On 9/28/1972, a category F4 (max. wind speeds 207-260 mph) tornado 5.3 miles away from the Gurnee village center injured 20 people and caused between $500,000 and $5,000,000 in damages.
On 4/21/1967, a category F4 tornado 13.6 miles away from the village center killed one person and injured 100 people and caused between $500,000 and $5,000,000 in damages.
Earthquake activity:
Gurnee-area historical earthquake activity is significantly above Illinois state average. It is 27% greater than the overall U.S. average. On 4/18/2008 at 09:36:59, a magnitude 5.4 (5.1 MB, 4.8 MS, 5.4 MW, 5.2 MW, Class: Moderate, Intensity: VI - VII) earthquake occurred 271.3 miles away from the city center On 6/10/1987 at 23:48:54, a magnitude 5.1 (4.9 MB, 4.4 MS, 4.6 MS, 5.1 LG) earthquake occurred 245.7 miles away from the city center On 4/18/2008 at 09:36:59, a magnitude 5.2 (5.2 MW, Depth: 8.9 mi) earthquake occurred 271.3 miles away from the city center On 6/28/2004 at 06:10:52, a magnitude 4.2 (4.2 MW, Depth: 6.2 mi, Class: Light, Intensity: IV - V) earthquake occurred 80.4 miles away from Gurnee center On 2/10/2010 at 09:59:35, a magnitude 3.8 (3.8 MW, Depth: 6.2 mi, Class: Light, Intensity: II - III) earthquake occurred 40.2 miles away from Gurnee center On 5/2/2015 at 16:23:07, a magnitude 4.2 (4.2 MW, Depth: 2.8 mi) earthquake occurred 128.5 miles away from the city center Magnitude types: regional Lg-wave magnitude (LG), body-wave magnitude (MB), surface-wave magnitude (MS), moment magnitude (MW) Natural disasters: The number of natural disasters in Lake County (16) is near the US average (15).Major Disasters (Presidential) Declared: 10Emergencies Declared: 5Storms: 9, Floods: 7, Tornadoes: 3, Snows: 2, Snowstorms: 2, Winter Storms: 2, Blizzard: 1, Hurricane: 1, Wind: 1, Other: 1 (Note: some incidents may be assigned to more than one category). Main business address for: ESSENTIAL GROUP INC SERVICES-OFFICES & CLINICS OF DOCTORS OF MEDICINE ).
Hospitals and medical centers in Gurnee: CLEARBROOK-WRIGHT HOME (34377 NORTH ALMOND ROAD) FMC - NEOMEDICA - GURNEE (101 S. GREENLEAF , STE B)
ADVANCE LIFECARE HOME HEALTH (1800 NATIONS DR, STE 216)
LAKE FOREST HOSPITAL (36100 BROOKSIDE DRIVE, LL70)
PROVENA HOME CARE (222 SOUTH GREENLEAF AVE, SUITE 103)
Heliports located in Gurnee: Colleges/universities with over 2000 students nearest to Gurnee:
College of Lake County (about 5 miles; Grayslake, IL ; Full-time enrollment: 11,041)
Gateway Technical College (about 17 miles; Kenosha, WI ; FT enrollment: 5,089)
Carthage College (about 19 miles; Kenosha, WI ; FT enrollment: 3,130)
University of Wisconsin-Parkside (about 20 miles; Kenosha, WI ; FT enrollment: 3,843)
Harper College (about 22 miles; Palatine, IL ; FT enrollment: 10,800)
Oakton Community College (about 22 miles; Des Plaines, IL ; FT enrollment: 7,271)
McHenry County College (about 24 miles; Crystal Lake, IL ; FT enrollment: 4,886)
Public high school in Gurnee:
Public elementary/middle schools in Gurnee: WOODLAND MIDDLE SCHOOL Students: 2,522, Location: 7000 WASHINGTON ST, Grades: 6-8)WOODLAND INTERMEDIATE SCH Students: 1,580, Location: 1115 N HUNT CLUB RD, Grades: 4-5)VIKING SCHOOL Students: 643, Location: 4460 OLD GRAND AVE, Grades: 6-8)SPAULDING ELEMENTARY SCHOOL Students: 609, Location: 2000 BELLE PLAINE AVE, Grades: PK-2)RIVER TRAIL SCHOOL Location: 333 N OPLAINE RD, Grades: KG-8)
Private elementary/middle schools in Gurnee: COUNTRY MEADOWS MONTESSORI SCHOOL Students: 178, Location: 6151 WASHINGTON ST, Grades: PK-6)
GURNEE CHRISTIAN SCHOOL Students: 61, Location: 2190 FULLER RD, Grades: PK-7)
LIFEPOINTE Students: 22, Location: 5501 STEARNS SCHOOL RD, Grades: PK-1)
See full list of schools located in Gurnee Library in Gurnee: WARREN-NEWPORT PUBLIC LIBRARY DISTRICT Operating income: $5,428,830; Location: 224 NORTH O'PLAINE ROAD; 220,791 books ; 1,376 e-books ; 19,060 audio materials ; 19,678 video materials ; 26 local licensed databases ; 14 state licensed databases ; 3 other licensed databases ; 387 print serial subscriptions ; 1 electronic serial subscriptions )
Notable locations in Gurnee: (A) , Dillys Corners (B) , Heather Ridge Golf Course (C) , Merit Club Golf Course (D) , Grand Tri State Business Park (E) , Gurney Mills (F) , Gurnee Village Hall (G) , Warren - Newport Public Library (H) , Gurnee Fire Department Station 2 (I) , Gurnee Fire Department Station 1 (J) . Display/hide their locations on the map
Main business address in Gurnee: (A) . Display/hide its location on the map
Churches in Gurnee include: (A) , Village Church of Gurnee (B) . Display/hide their locations on the map
Cemetery: (1) . Display/hide its location on the map
Parks in Gurnee include: (1) , Prairie Oaks Park (2) , Gowe Park (3) , Six Flags Great America (4) , South Park (5) , University Park (6) , Woodlawn Park (7) , Viking Park (8) . Display/hide their locations on the map
Hotels: (1) , Comfort Inn Gurnee (6080 Gurnee Mills Circle East) (2) , El Rancho Motel (36355 North US Highway 41) (3) , Baymont Inn & Suites - Chicago/Gurnee (5688 Northridge Dr) (4) , Extended Stayamerica (5724 Northrdg Drive) (5) , Gurnee Grand Hotel (5520 Route 132) (6) , Holiday Inn (6161 Grand Avenue Lbby 1) (7) , Comfort Suites (5430 Route 132) (8) , Comfort Inn (6080 Gurnee Mills Cir E) (9) . Display/hide their approximate locations on the map
Court: (1) . Display/hide its approximate location on the map
Birthplace of: Greg Rallo - Ice hockey player, Kevin Anderson (actor) - Actor.
Lake County has a predicted average indoor radon screening level between 2 and 4 pCi/L (pico curies per liter) - Moderate Potential Drinking water stations with addresses in Gurnee and their reported violations in the past:
OTTER LAKE CAMPGROUND (Serves MI, Population served: 25, Groundwater):
Past monitoring violations:
2 routine major monitoring violations
Drinking water stations with addresses in Gurnee that have no violations reported:
POINT PANCAKE HOUSE (Population served: 300, Primary Water Source Type: Groundwater)
Average household size: This village:
2.7 peopleIllinois:
2.6 people
Percentage of family households: This village:
71.8%Whole state:
65.8%
Percentage of households with unmarried partners: This village:
4.3%Whole state:
6.3%
Likely homosexual households (counted as self-reported same-sex unmarried-partner households)
Lesbian couples: 0.3% of all households Gay men: 0.2% of all households
People in group quarters in Gurnee in 2010:
61 people in nursing facilities/skilled-nursing facilities
26 people in emergency and transitional shelters (with sleeping facilities) for people experiencing homelessness
2 people in other noninstitutional facilities
People in group quarters in Gurnee in 2000:
20 people in other noninstitutional group quarters
8 people in agriculture workers' dormitories on farms
2 people in religious group quarters
Banks with most branches in Gurnee (2011 data):
JPMorgan Chase Bank, National Association: Gurnee Branch, Gurnee Mills Mall, Gurnee Dominicks Branch. Info updated 2011/11/10: Bank assets: $1,811,678.0 mil, Deposits: $1,190,738.0 mil, headquarters in Columbus, OH, positive income , International Specialization, 5577 total offices , Holding Company: Jpmorgan Chase & Co.
Fifth Third Bank: Hutchins Branch at 7500 West Grand Avenue, branch established on 1991/04/15; Gurnee Branch at 4840 Grand Avenue, branch established on 1958/06/02. Info updated 2009/10/05: Bank assets: $114,540.4 mil, Deposits: $89,689.1 mil, headquarters in Cincinnati, OH, positive income , Commercial Lending Specialization, 1378 total offices , Holding Company: Fifth Third Bancorp
Woodforest National Bank: Il Gurnee Walmart Branch at 6590 Grand Avenue, branch established on 2009/08/26. Info updated 2011/05/10: Bank assets: $3,488.9 mil, Deposits: $3,097.6 mil, headquarters in Houston, TX, positive income , Commercial Lending Specialization, 766 total offices , Holding Company: Woodforest Financial Group Employee Stock Ownership Plan (With 401(K) Provisions)
PNC Bank, National Association: Gurnee Branch at 6495 Washington Street, branch established on 1994/06/17. Info updated 2012/03/20: Bank assets: $263,309.6 mil, Deposits: $197,343.0 mil, headquarters in Wilmington, DE, positive income , Commercial Lending Specialization, 3085 total offices , Holding Company: Pnc Financial Services Group, Inc., The
Associated Bank, National Association: Gurnee Branch at 1313 Delany Road, branch established on 1985/06/10. Info updated 2008/09/12: Bank assets: $21,715.0 mil, Deposits: $15,244.4 mil, headquarters in Green Bay, WI, positive income , Commercial Lending Specialization, 282 total offices , Holding Company: Associated Banc-Corp
First American Bank: Gurnee Branch at 7005 Grand Avenue, branch established on 2001/10/18. Info updated 2010/01/19: Bank assets: $2,710.6 mil, Deposits: $2,213.4 mil, headquarters in Elk Grove Village, IL, negative income in the last year , Commercial Lending Specialization, 50 total offices , Holding Company: First American Bank Corporation
Norstates Bank: Gurnee Branch at 5384 Grand Avenue, branch established on 1991/03/01. Info updated 2008/09/29: Bank assets: $463.3 mil, Deposits: $399.4 mil, headquarters in Waukegan, IL, negative income in the last year , Commercial Lending Specialization, 8 total offices , Holding Company: Northern States Financial Corporation
Northside Community Bank: at 5101 West Washington Street, branch established on 1997/07/07. Info updated 2006/11/03: Bank assets: $378.4 mil, Deposits: $297.7 mil, local headquarters , negative income in the last year , Commercial Lending Specialization, 5 total offices , Holding Company: Alikat Investments, Inc.
BMO Harris Bank National Association: 6547 Grand Avenue Branch at 6547 Grand Avenue, branch established on 1996/07/26. Info updated 2011/07/14: Bank assets: $97,264.0 mil, Deposits: $75,624.6 mil, headquarters in Chicago, IL, positive income , 717 total offices , Holding Company: Bank Of Montreal
5 other banks with 5 local branches
For population 15 years and over in Gurnee:
Never married: 31.2%Now married: 57.0%Separated: 1.1%Widowed: 4.3%Divorced: 6.3% For population 25 years and over in Gurnee:
High school or higher: 96.2%Bachelor's degree or higher: 55.5%Graduate or professional degree: 21.5%Unemployed: 2.3%Mean travel time to work (commute): 21.9 minutes
Education Gini index (Inequality in education) Here:
10.2Illinois average:
12.5
Religion statistics for Gurnee, IL (based on Lake County data)
Religion Adherents Congregations Catholic 211,380 29 Evangelical Protestant 84,501 211 Mainline Protestant 36,967 76 Other 33,822 62 Black Protestant 7,824 16 Orthodox 4,610 8 None 324,358 -
Source: Clifford Grammich, Kirk Hadaway, Richard Houseal, Dale E.Jones, Alexei Krindatch, Richie Stanley and Richard H.Taylor. 2012. 2010 U.S.Religion Census: Religious Congregations & Membership Study. Association of Statisticians of American Religious Bodies. Jones, Dale E., et al. 2002. Congregations and Membership in the United States 2000. Nashville, TN: Glenmary Research Center. Graphs represent county-level data
Food Environment Statistics: Number of grocery stores : 121Lake County :
1.71 / 10,000 pop.Illinois :
2.24 / 10,000 pop.
Number of supercenters and club stores : 4This county :
0.06 / 10,000 pop.Illinois :
0.08 / 10,000 pop.
Number of convenience stores (no gas) : 38Here :
0.54 / 10,000 pop.Illinois :
0.75 / 10,000 pop.
Number of convenience stores (with gas) : 174This county :
2.46 / 10,000 pop.Illinois :
2.61 / 10,000 pop.
Number of full-service restaurants : 457Lake County :
6.47 / 10,000 pop.State :
6.86 / 10,000 pop.
Adult diabetes rate : Lake County :
7.3%Illinois :
8.3%
Low-income preschool obesity rate : Lake County :
16.3%Illinois :
14.5%
Health and Nutrition:
Average overall health of teeth and gums : Gurnee:
50.6%Illinois:
47.2%
People feeling badly about themselves : Gurnee:
19.8%Illinois:
20.5%
People not drinking alcohol at all : Gurnee:
10.2%Illinois:
10.8%
Average hours sleeping at night : Overweight people : Gurnee:
32.8%Illinois:
33.4%
General health condition : This city:
59.3%Illinois:
56.4%
Average condition of hearing : This city:
81.5%Illinois:
79.9%
More about Health and Nutrition of Gurnee, IL Residents
Local government employment and payroll (March 2022)
Function
Full-time employees
Monthly full-time payroll
Average yearly full-time wage
Part-time employees
Monthly part-time payroll
Police Protection - Officers
60 $575,685 $115,137 0 $0 Firefighters
55 $531,283 $115,916 0 $0 Police - Other
37 $280,992 $91,133 7 $12,997 Streets and Highways
18 $135,338 $90,225 0 $0 Other and Unallocable
12 $99,192 $99,192 1 $1,439 Sewerage
11 $66,710 $72,775 0 $0 Financial Administration
8 $75,675 $113,513 2 $8,804 Other Government Administration
7 $71,387 $122,378 17 $8,233 Fire - Other
5 $48,490 $116,376 0 $0
Totals for Government
213 $1,884,753 $106,183 27 $31,472
Gurnee government finances - Expenditure in 2018 (per resident):
Current Operations - Police Protection: $14,037,000 ($463.22)
Local Fire Protection: $10,040,000 ($331.32)Water Utilities: $7,069,000 ($233.28)Central Staff Services: $5,761,000 ($190.11)Regular Highways: $4,776,000 ($157.61)General - Other: $3,004,000 ($99.13)General Public Buildings: $85,000 ($2.81)General - Interest on Debt: $2,098,000 ($69.23)
Other Capital Outlay - Water Utilities: $2,586,000 ($85.34)
Central Staff Services: $1,570,000 ($51.81)Total Salaries and Wages: $21,458,000 ($708.11)
Gurnee government finances - Revenue in 2018 (per resident):
Charges - Other: $3,758,000 ($124.01)
Local Intergovernmental - Other: $3,038,000 ($100.25)
Miscellaneous - Fines and Forfeits: $1,988,000 ($65.60)
Interest Earnings: $178,000 ($5.87)General Revenue - Other: $89,000 ($2.94)Revenue - Water Utilities: $8,937,000 ($294.92)
State Intergovernmental - General Local Government Support: $23,037,000 ($760.22)
Highways: $821,000 ($27.09)Tax - Other Selective Sales: $4,974,000 ($164.14)
General Sales and Gross Receipts: $4,602,000 ($151.87)Other License: $1,363,000 ($44.98)Public Utilities Sales: $962,000 ($31.75)
Gurnee government finances - Debt in 2018 (per resident):
Long Term Debt - Beginning Outstanding - Unspecified Public Purpose: $52,445,000 ($1730.69)
Outstanding Unspecified Public Purpose: $43,630,000 ($1439.79)Retired Unspecified Public Purpose: $9,509,000 ($313.80)Issue, Unspecified Public Purpose: $694,000 ($22.90)
Gurnee government finances - Cash and Securities in 2018 (per resident):
Other Funds - Cash and Securities: $31,461,000 ($1038.21)
6.06% of this county's 2021 resident taxpayers lived in other counties in 2020 ($110,528 average adjusted gross income )
Here:
6.06%Illinois average:
5.09%
0.03% of residents moved from foreign countries ($301 average AGI )Lake County:
0.03%Illinois average:
0.01%
Top counties from which taxpayers relocated into this county between 2020 and 2021:
6.71% of this county's 2020 resident taxpayers moved to other counties in 2021 ($163,220 average adjusted gross income )
Here:
6.71%Illinois average:
6.10%
0.04% of residents moved to foreign countries ($308 average AGI )Lake County:
0.04%Illinois average:
0.01%
Top counties to which taxpayers relocated from this county between 2020 and 2021:
Businesses in Gurnee, IL
Name Count Name Count
AT&T 2 KFC 1 Ace Hardware 1 Kohl's 1 Aeropostale 1 La Quinta 1 American Eagle Outfitters 2 La-Z-Boy 1 Applebee's 1 Lane Bryant 1 AutoZone 1 Levi Strauss & Co. 1 Avenue 1 Long John Silver's 1 Bakers 1 Lowe's 1 Bakers Square 1 Marriott 1 Banana Republic 1 Marshalls 1 Baskin-Robbins 1 MasterBrand Cabinets 9 Bath & Body Works 2 McDonald's 5 Bed Bath & Beyond 1 Men's Wearhouse 1 Ben & Jerry's 2 Menards 1 Best Western 1 Motherhood Maternity 1 Blockbuster 1 Nike 7 Burger King 1 Nissan 1 Burlington Coat Factory 1 OfficeMax 1 Caribou Coffee 1 Old Navy 1 Charlotte Russe 1 Olive Garden 1 Chipotle 1 Outback 1 Chuck E. Cheese's 1 Outback Steakhouse 1 Cinnabon 1 Pac Sun 1 Circle K 1 Panda Express 2 Cold Stone Creamery 2 Panera Bread 1 Comfort Inn 1 Payless 1 Cracker Barrel 1 PetSmart 1 Cricket Wireless 1 Pier 1 Imports 1 DHL 1 Pizza Hut 1 Dairy Queen 1 RadioShack 2 Deb 1 Red Lobster 1 Decora Cabinetry 2 Red Robin 1 Dennys 1 Ruby Tuesday 1 Domino's Pizza 1 Rue21 2 DressBarn 2 Safeway 1 Dressbarn 1 Sam's Club 1 Dunkin Donuts 1 Sears 2 Econo Lodge 1 Shoe Carnival 1 Express 1 Skechers USA 1 Extended Stay America 1 Spencer Gifts 1 Famous Footwear 1 Sprint Nextel 3 FedEx 7 Starbucks 5 Finish Line 1 Steak 'n Shake 1 Foot Locker 1 Subway 6 Forever 21 1 T-Mobile 1 GNC 1 T.G.I. Driday's 1 GameStop 2 Taco Bell 1 Gap 1 Target 1 Gymboree 1 The Athlete's Foot 1 H&M 1 Torrid 1 H&R Block 1 Toys"R"Us 2 Hilton 1 U-Haul 2 Home Depot 1 UPS 9 Honda 1 Value City Furniture 1 Hot Topic 1 Vans 2 Hyundai 1 Verizon Wireless 3 IHOP 1 Victoria's Secret 1 Jamba Juice 1 Volkswagen 1 Jewel-Osco 1 Vons 1 JoS. A. Bank 1 Walgreens 2 Johnny Rockets 2 Walmart 1 Jones New York 2 Wendy's 2 Journeys 1 White Castle 1 Justice 1
Strongest AM radio stations in Gurnee:
WTMJ (620 AM; 50 kW; MILWAUKEE, WI; Owner: JOURNAL BROADCAST CORPORATION)
WGN (720 AM; 50 kW; CHICAGO, IL; Owner: WGN CONTINENTAL BROADCASTING CO.)
WBBM (780 AM; 50 kW; CHICAGO, IL; Owner: INFINITY BROADCASTING OPERATIONS, INC.)
WKRS (1220 AM; 1 kW; WAUKEGAN, IL; Owner: NM LICENSING, LLC)
WSCR (670 AM; 50 kW; CHICAGO, IL; Owner: INFINITY BROADCASTING OPERATIONS, INC.)
WISN (1130 AM; 50 kW; MILWAUKEE, WI; Owner: CAPSTAR TX LIMITED PARTNERSHIP)
WMVP (1000 AM; 50 kW; CHICAGO, IL; Owner: ABC, INC.)
WLS (890 AM; 50 kW; CHICAGO, IL; Owner: WLS, INC.)
WKTA (1330 AM; 5 kW; EVANSTON, IL; Owner: POLNET COMMUNICATIONS, LTD.)
WYLL (1160 AM; 50 kW; CHICAGO, IL; Owner: SCA LICENSE CORPORATION)
WNVR (1030 AM; 5 kW; VERNON HILLS, IL; Owner: POLNET COMMUNICATIONS, LTD.)
WVIV (1200 AM; 20 kW; CHICAGO, IL; Owner: WLXX-AM LICENSE CORP.)
WCSN (820 AM; 5 kW; CHICAGO, IL; Owner: WYPA, INC.)
Strongest FM radio stations in Gurnee:
WXLC (102.3 FM; WAUKEGAN, IL; Owner: NM LICENSING, LLC)
WWDV (96.9 FM; ZION, IL; Owner: BONNEVILLE HOLDING COMPANY)
WIIL (95.1 FM; KENOSHA, WI; Owner: NM LICENSING, LLC)
WCKG (105.9 FM; ELMWOOD PARK, IL; Owner: INFINITY HOLDINGS CORPORATION OF ORLANDO)
WLIT-FM (93.9 FM; CHICAGO, IL; Owner: AMFM RADIO LICENSES, L.L.C.)
WJMK (104.3 FM; CHICAGO, IL; Owner: INFINITY BROADCASTING CORP. OF ILLINOIS)
WNUA (95.5 FM; CHICAGO, IL; Owner: AMFM RADIO LICENSES, L.L.C.)
WGCI-FM (107.5 FM; CHICAGO, IL; Owner: AMFM RADIO LICENSES, L.L.C.)
WTMX (101.9 FM; SKOKIE, IL; Owner: BONNEVILLE HOLDING COMPANY)
WBBM-FM (96.3 FM; CHICAGO, IL; Owner: INFINITY BROADCASTING OPERATIONS, INC.)
WKSC-FM (103.5 FM; CHICAGO, IL; Owner: AMFM RADIO LICENSES, L.L.C.)
WFMT (98.7 FM; CHICAGO, IL; Owner: WINDOW TO THE WORLD COMMUNICATIONS)
WZZN (94.7 FM; CHICAGO, IL; Owner: ABC CHICAGO FM RADIO,INC.)
WBEZ (91.5 FM; CHICAGO, IL; Owner: THE WBEZ ALLIANCE, INC.)
WKQX (101.1 FM; CHICAGO, IL; Owner: EMMIS RADIO LICENSE CORPORATION)
WLUP-FM (97.9 FM; CHICAGO, IL; Owner: BONNEVILLE HOLDING COMPANY)
WNND (100.3 FM; CHICAGO, IL; Owner: BONNEVILLE HOLDING COMPANY)
WOJO (105.1 FM; EVANSTON, IL; Owner: TICHENOR LICENSE CORPORATION ("TLC"))
WUSN (99.5 FM; CHICAGO, IL; Owner: INFINITY BROADCASTING CORPORATION OF CHICAGO)
WVAZ (102.7 FM; OAK PARK, IL; Owner: AMFM RADIO LICENSES, L.L.C.)
TV broadcast stations around Gurnee:
W64CQ (Channel 64; ARLINGTON HEIGHTS, IL; Owner: TRINITY BROADCASTING NETWORK)
W34CK (Channel 34; ARLINGTON HEIGHTS, IL; Owner: FIRST UNITED, INC.)
WLS-TV (Channel 7; CHICAGO, IL; Owner: WLS TELEVISION, INC.)
WMAQ-TV (Channel 5; CHICAGO, IL; Owner: NBC SUBSIDIARY (WMAQ-TV), INC.)
WTTW (Channel 11; CHICAGO, IL; Owner: WINDOW TO THE WORLD COMMUNICATIONS, INC.)
WGBO-TV (Channel 66; JOLIET, IL; Owner: WGBO LICENSE PARTNERSHIP, G.P.)
WGN-TV (Channel 9; CHICAGO, IL; Owner: WGN CONTINENTAL BROADCASTING COMPANY)
WBBM-TV (Channel 2; CHICAGO, IL; Owner: CBS BROADCASTING INC.)
WPWR-TV (Channel 50; GARY, IN; Owner: FOX TELEVISION STATIONS, INC.)
WXFT (Channel 60; AURORA, IL; Owner: TELEFUTURA CHICAGO LLC)
WCIU-TV (Channel 26; CHICAGO, IL; Owner: WCIU-TV LIMITED PARTNERSHIP)
WCPX (Channel 38; CHICAGO, IL; Owner: PAXSON CHICAGO LICENSE, INC.)
WSNS-TV (Channel 44; CHICAGO, IL; Owner: TELEMUNDO OF CHICAGO, INC.)
WFLD (Channel 32; CHICAGO, IL; Owner: FOX TELEVISION STATIONS, INC.)
W68DO (Channel 68; PALATINE, IL; Owner: TRINITY BROADCASTING NETWORK)
WFBT-CA (Channel 23; CHICAGO, IL; Owner: CHANNEL 23 LIMITED PARTNERSHIP)
WJYS (Channel 62; HAMMOND, IN; Owner: JOVON BROADCASTING CORPORATION)
WOCH-LP (Channel 28; CHICAGO, IL; Owner: KM LPTV OF CHICAGO-28, L.L.C.)
WYCC (Channel 20; CHICAGO, IL; Owner: COLLEGE DIST. #508, COUNTY OF COOK)
WOCK-CA (Channel 13; CHICAGO, IL; Owner: KM LPTV OF CHICAGO-13, L.L.C.)
WJJA (Channel 49; RACINE, WI; Owner: TV-49, INC.)
W57DN (Channel 57; ELGIN, IL; Owner: TRINITY BROADCASTING NETWORK)
National Bridge Inventory (NBI) Statistics 41 Number of bridges466ft / 142m Total length $5,825,000 Total costs1,230,400 Total average daily traffic84,124 Total average daily truck traffic
New bridges - historical statistics
1 1900-1909 2 1930-1939 13 1950-1959 8 1960-1969 3 1970-1979 2 1990-1999 12 2000-2009
See full National Bridge Inventory statistics for Gurnee, IL
Home Mortgage Disclosure Act Aggregated Statistics For Year 2009(Based on 1 full and 7 partial tracts) A) FHA, FSA/RHS & VA B) Conventional C) Refinancings D) Home Improvement Loans E) Loans on Dwellings For 5+ Families F) Non-occupant Loans on G) Loans On Manufactured Number Average Value Number Average Value Number Average Value Number Average Value Number Average Value Number Average Value Number Average Value
LOANS ORIGINATED 71 $205,188 99 $207,586 854 $218,157 28 $124,288 5 $3,343,638 20 $189,122 6 $246,683 APPLICATIONS APPROVED, NOT ACCEPTED 4 $234,280 6 $240,300 88 $228,407 4 $104,480 0 $0 2 $129,505 0 $0 APPLICATIONS DENIED 12 $189,968 17 $169,691 203 $240,904 10 $136,938 0 $0 9 $153,843 1 $138,890 APPLICATIONS WITHDRAWN 7 $182,917 15 $213,239 140 $237,638 6 $204,153 0 $0 4 $146,350 0 $0 FILES CLOSED FOR INCOMPLETENESS 2 $203,010 3 $180,797 51 $232,198 2 $198,635 0 $0 1 $64,000 0 $0
Aggregated Statistics For Year 2008(Based on 1 full and 7 partial tracts) A) FHA, FSA/RHS & VA B) Conventional C) Refinancings D) Home Improvement Loans E) Loans on Dwellings For 5+ Families F) Non-occupant Loans on G) Loans On Manufactured Number Average Value Number Average Value Number Average Value Number Average Value Number Average Value Number Average Value Number Average Value
LOANS ORIGINATED 47 $208,830 181 $240,850 469 $231,001 21 $88,770 1 $1,215,220 23 $170,973 0 $0 APPLICATIONS APPROVED, NOT ACCEPTED 3 $149,353 20 $300,090 63 $259,373 4 $137,155 0 $0 3 $238,473 0 $0 APPLICATIONS DENIED 12 $236,368 30 $214,776 190 $236,354 23 $76,569 0 $0 11 $146,755 5 $36,274 APPLICATIONS WITHDRAWN 3 $300,613 26 $252,542 88 $252,735 4 $109,322 0 $0 2 $354,810 0 $0 FILES CLOSED FOR INCOMPLETENESS 3 $211,213 4 $384,678 37 $235,821 2 $45,770 0 $0 2 $226,285 0 $0
Aggregated Statistics For Year 2007(Based on 1 full and 7 partial tracts) A) FHA, FSA/RHS & VA B) Conventional C) Refinancings D) Home Improvement Loans E) Loans on Dwellings For 5+ Families F) Non-occupant Loans on Number Average Value Number Average Value Number Average Value Number Average Value Number Average Value Number Average Value
LOANS ORIGINATED 16 $204,499 354 $228,902 485 $207,061 53 $70,542 1 $1,626,040 35 $180,466 APPLICATIONS APPROVED, NOT ACCEPTED 1 $117,470 51 $204,232 75 $234,838 11 $83,597 0 $0 7 $119,236 APPLICATIONS DENIED 3 $181,293 63 $231,140 253 $222,841 22 $56,871 0 $0 9 $216,027 APPLICATIONS WITHDRAWN 1 $211,390 24 $296,234 101 $206,761 12 $112,015 0 $0 3 $154,337 FILES CLOSED FOR INCOMPLETENESS 0 $0 16 $243,846 29 $211,919 3 $95,233 0 $0 2 $198,405
Aggregated Statistics For Year 2006(Based on 1 full and 7 partial tracts) A) FHA, FSA/RHS & VA B) Conventional C) Refinancings D) Home Improvement Loans E) Loans on Dwellings For 5+ Families F) Non-occupant Loans on G) Loans On Manufactured Number Average Value Number Average Value Number Average Value Number Average Value Number Average Value Number Average Value Number Average Value
LOANS ORIGINATED 15 $221,034 566 $202,902 538 $204,749 61 $94,592 3 $2,997,500 58 $156,880 0 $0 APPLICATIONS APPROVED, NOT ACCEPTED 1 $225,360 75 $202,519 87 $180,665 18 $91,568 0 $0 3 $182,857 0 $0 APPLICATIONS DENIED 2 $206,815 79 $184,018 247 $208,606 34 $52,806 0 $0 10 $177,730 2 $10,000 APPLICATIONS WITHDRAWN 2 $306,010 65 $190,601 158 $229,429 7 $97,090 0 $0 9 $203,224 0 $0 FILES CLOSED FOR INCOMPLETENESS 0 $0 22 $170,204 51 $204,128 3 $66,250 0 $0 1 $112,000 0 $0
Aggregated Statistics For Year 2005(Based on 1 full and 7 partial tracts) A) FHA, FSA/RHS & VA B) Conventional C) Refinancings D) Home Improvement Loans E) Loans on Dwellings For 5+ Families F) Non-occupant Loans on G) Loans On Manufactured Number Average Value Number Average Value Number Average Value Number Average Value Number Average Value Number Average Value Number Average Value
LOANS ORIGINATED 17 $187,406 657 $199,656 694 $204,377 49 $101,235 3 $386,667 87 $151,438 1 $24,690 APPLICATIONS APPROVED, NOT ACCEPTED 0 $0 69 $213,840 79 $196,598 13 $103,388 0 $0 5 $245,748 0 $0 APPLICATIONS DENIED 2 $178,650 96 $173,861 255 $215,803 26 $94,146 0 $0 23 $131,835 1 $261,030 APPLICATIONS WITHDRAWN 1 $128,000 63 $190,846 227 $231,345 22 $197,880 0 $0 19 $136,866 0 $0 FILES CLOSED FOR INCOMPLETENESS 1 $138,000 22 $209,671 54 $210,946 3 $103,897 0 $0 3 $101,813 0 $0
Aggregated Statistics For Year 2004(Based on 1 full and 7 partial tracts) A) FHA, FSA/RHS & VA B) Conventional C) Refinancings D) Home Improvement Loans E) Loans on Dwellings For 5+ Families F) Non-occupant Loans on G) Loans On Manufactured Number Average Value Number Average Value Number Average Value Number Average Value Number Average Value Number Average Value Number Average Value
LOANS ORIGINATED 36 $171,089 528 $199,850 884 $200,017 52 $86,325 1 $81,840 60 $146,327 1 $92,800 APPLICATIONS APPROVED, NOT ACCEPTED 0 $0 50 $212,600 107 $182,207 8 $67,432 0 $0 6 $144,455 0 $0 APPLICATIONS DENIED 1 $105,560 53 $191,129 268 $180,369 36 $52,653 0 $0 7 $155,656 1 $7,560 APPLICATIONS WITHDRAWN 4 $131,812 57 $201,391 181 $204,012 17 $113,829 0 $0 3 $152,087 1 $194,740 FILES CLOSED FOR INCOMPLETENESS 3 $137,937 22 $232,928 100 $211,911 9 $86,084 0 $0 3 $140,150 0 $0
Aggregated Statistics For Year 2003(Based on 1 full and 7 partial tracts) A) FHA, FSA/RHS & VA B) Conventional C) Refinancings D) Home Improvement Loans E) Loans on Dwellings For 5+ Families F) Non-occupant Loans on Number Average Value Number Average Value Number Average Value Number Average Value Number Average Value Number Average Value
LOANS ORIGINATED 45 $169,599 538 $200,379 2,648 $181,664 39 $56,863 5 $1,575,524 62 $157,446 APPLICATIONS APPROVED, NOT ACCEPTED 3 $194,990 45 $202,028 232 $175,880 11 $44,443 0 $0 9 $154,574 APPLICATIONS DENIED 1 $184,670 51 $242,355 312 $174,337 22 $19,538 0 $0 8 $162,294 APPLICATIONS WITHDRAWN 6 $168,615 50 $197,230 318 $193,488 9 $52,577 0 $0 7 $174,360 FILES CLOSED FOR INCOMPLETENESS 3 $157,617 9 $195,538 58 $189,879 2 $44,745 0 $0 3 $120,677
Aggregated Statistics For Year 2002(Based on 1 partial tract) A) FHA, FSA/RHS & VA B) Conventional C) Refinancings D) Home Improvement Loans F) Non-occupant Loans on Number Average Value Number Average Value Number Average Value Number Average Value Number Average Value
LOANS ORIGINATED 3 $174,923 76 $172,719 210 $181,926 2 $43,320 4 $111,268 APPLICATIONS APPROVED, NOT ACCEPTED 0 $0 6 $199,037 18 $160,142 0 $0 0 $0 APPLICATIONS DENIED 0 $0 3 $317,150 21 $176,208 1 $61,710 0 $0 APPLICATIONS WITHDRAWN 0 $0 7 $257,364 25 $184,732 0 $0 0 $0 FILES CLOSED FOR INCOMPLETENESS 0 $0 1 $157,760 7 $208,320 1 $18,390 0 $0
Aggregated Statistics For Year 2001(Based on 1 partial tract) A) FHA, FSA/RHS & VA B) Conventional C) Refinancings D) Home Improvement Loans F) Non-occupant Loans on Number Average Value Number Average Value Number Average Value Number Average Value Number Average Value
LOANS ORIGINATED 7 $152,094 78 $175,149 148 $168,257 9 $40,189 4 $68,662 APPLICATIONS APPROVED, NOT ACCEPTED 0 $0 4 $128,128 13 $119,183 1 $47,000 0 $0 APPLICATIONS DENIED 0 $0 4 $204,758 20 $125,920 4 $19,005 0 $0 APPLICATIONS WITHDRAWN 0 $0 3 $151,083 18 $139,798 1 $39,240 0 $0 FILES CLOSED FOR INCOMPLETENESS 0 $0 1 $409,930 3 $110,213 0 $0 0 $0
Aggregated Statistics For Year 2000(Based on 1 partial tract) A) FHA, FSA/RHS & VA B) Conventional C) Refinancings D) Home Improvement Loans Number Average Value Number Average Value Number Average Value Number Average Value
LOANS ORIGINATED 6 $104,695 66 $161,461 31 $152,379 7 $25,106 APPLICATIONS APPROVED, NOT ACCEPTED 0 $0 6 $168,657 7 $98,613 2 $26,565 APPLICATIONS DENIED 2 $104,220 6 $134,938 11 $99,797 4 $41,585 APPLICATIONS WITHDRAWN 0 $0 3 $232,140 9 $82,284 0 $0 FILES CLOSED FOR INCOMPLETENESS 0 $0 0 $0 1 $148,360 0 $0
Aggregated Statistics For Year 1999(Based on 4 partial tracts) A) FHA, FSA/RHS & VA B) Conventional C) Refinancings D) Home Improvement Loans E) Loans on Dwellings For 5+ Families F) Non-occupant Loans on Number Average Value Number Average Value Number Average Value Number Average Value Number Average Value Number Average Value
LOANS ORIGINATED 72 $133,016 479 $163,762 445 $138,098 67 $27,111 2 $260,015 13 $93,547 APPLICATIONS APPROVED, NOT ACCEPTED 3 $114,047 47 $166,220 63 $132,672 11 $22,136 0 $0 3 $84,653 APPLICATIONS DENIED 3 $172,413 35 $135,267 129 $129,441 17 $17,329 0 $0 3 $90,327 APPLICATIONS WITHDRAWN 3 $139,040 43 $155,097 98 $116,141 12 $71,294 0 $0 2 $92,465 FILES CLOSED FOR INCOMPLETENESS 0 $0 9 $192,927 20 $146,868 3 $24,507 0 $0 1 $108,470
Detailed HMDA statistics for the following Tracts:
8615.05
, 8615.07 , 8615.08 , 8615.09 , 8615.10 , 8616.03 , 8616.04 , 8616.05
Private Mortgage Insurance Companies Aggregated Statistics For Year 2009(Based on 1 full and 7 partial tracts) A) Conventional B) Refinancings Number Average Value Number Average Value
LOANS ORIGINATED 16 $253,694 21 $275,193 APPLICATIONS APPROVED, NOT ACCEPTED 5 $267,774 11 $252,477 APPLICATIONS DENIED 0 $0 5 $265,170 APPLICATIONS WITHDRAWN 2 $232,800 3 $250,257 FILES CLOSED FOR INCOMPLETENESS 0 $0 2 $228,695
Aggregated Statistics For Year 2008(Based on 1 full and 7 partial tracts) A) Conventional B) Refinancings C) Non-occupant Loans on Number Average Value Number Average Value Number Average Value
LOANS ORIGINATED 55 $240,666 41 $271,319 0 $0 APPLICATIONS APPROVED, NOT ACCEPTED 10 $237,131 18 $249,534 1 $168,590 APPLICATIONS DENIED 4 $214,485 6 $192,237 4 $152,065 APPLICATIONS WITHDRAWN 1 $155,410 8 $232,771 1 $125,000 FILES CLOSED FOR INCOMPLETENESS 0 $0 0 $0 0 $0
Aggregated Statistics For Year 2007(Based on 1 full and 7 partial tracts) A) Conventional B) Refinancings C) Non-occupant Loans on Number Average Value Number Average Value Number Average Value
LOANS ORIGINATED 86 $228,683 50 $248,270 5 $163,132 APPLICATIONS APPROVED, NOT ACCEPTED 21 $231,573 14 $261,884 1 $302,230 APPLICATIONS DENIED 1 $246,540 1 $264,710 0 $0 APPLICATIONS WITHDRAWN 7 $175,771 2 $271,110 0 $0 FILES CLOSED FOR INCOMPLETENESS 2 $146,530 0 $0 0 $0
Aggregated Statistics For Year 2006(Based on 1 full and 7 partial tracts) A) Conventional B) Refinancings C) Non-occupant Loans on Number Average Value Number Average Value Number Average Value
LOANS ORIGINATED 66 $207,713 27 $238,460 6 $142,250 APPLICATIONS APPROVED, NOT ACCEPTED 12 $211,469 13 $229,572 0 $0 APPLICATIONS DENIED 0 $0 1 $439,180 0 $0 APPLICATIONS WITHDRAWN 3 $178,490 4 $266,988 0 $0 FILES CLOSED FOR INCOMPLETENESS 0 $0 0 $0 0 $0
Aggregated Statistics For Year 2005(Based on 1 full and 7 partial tracts) A) Conventional B) Refinancings C) Non-occupant Loans on Number Average Value Number Average Value Number Average Value
LOANS ORIGINATED 66 $209,586 34 $217,939 6 $152,770 APPLICATIONS APPROVED, NOT ACCEPTED 13 $230,085 11 $182,015 1 $147,870 APPLICATIONS DENIED 0 $0 0 $0 0 $0 APPLICATIONS WITHDRAWN 1 $102,930 2 $165,895 0 $0 FILES CLOSED FOR INCOMPLETENESS 0 $0 0 $0 0 $0
Aggregated Statistics For Year 2004(Based on 1 full and 7 partial tracts) A) Conventional B) Refinancings C) Non-occupant Loans on D) Loans On Manufactured Number Average Value Number Average Value Number Average Value Number Average Value
LOANS ORIGINATED 81 $208,551 51 $216,672 5 $137,668 1 $136,320 APPLICATIONS APPROVED, NOT ACCEPTED 13 $219,166 13 $234,052 0 $0 0 $0 APPLICATIONS DENIED 1 $217,500 1 $156,610 0 $0 0 $0 APPLICATIONS WITHDRAWN 8 $241,356 4 $236,580 1 $280,550 0 $0 FILES CLOSED FOR INCOMPLETENESS 2 $97,135 2 $185,515 0 $0 1 $114,990
Aggregated Statistics For Year 2003(Based on 1 full and 7 partial tracts) A) Conventional B) Refinancings C) Non-occupant Loans on Number Average Value Number Average Value Number Average Value
LOANS ORIGINATED 117 $203,670 131 $196,396 6 $146,002 APPLICATIONS APPROVED, NOT ACCEPTED 17 $207,886 50 $204,552 2 $162,505 APPLICATIONS DENIED 2 $179,345 0 $0 0 $0 APPLICATIONS WITHDRAWN 1 $219,130 10 $189,164 2 $170,000 FILES CLOSED FOR INCOMPLETENESS 0 $0 0 $0 0 $0
Aggregated Statistics For Year 2002(Based on 1 partial tract) A) Conventional B) Refinancings Number Average Value Number Average Value
LOANS ORIGINATED 17 $153,335 12 $167,873 APPLICATIONS APPROVED, NOT ACCEPTED 2 $201,285 4 $192,702 APPLICATIONS DENIED 0 $0 0 $0 APPLICATIONS WITHDRAWN 0 $0 0 $0 FILES CLOSED FOR INCOMPLETENESS 0 $0 0 $0
Aggregated Statistics For Year 2001(Based on 1 partial tract) A) Conventional B) Refinancings Number Average Value Number Average Value
LOANS ORIGINATED 21 $152,542 11 $163,145 APPLICATIONS APPROVED, NOT ACCEPTED 2 $223,765 3 $267,970 APPLICATIONS DENIED 1 $123,840 0 $0 APPLICATIONS WITHDRAWN 0 $0 0 $0 FILES CLOSED FOR INCOMPLETENESS 0 $0 0 $0
Aggregated Statistics For Year 2000(Based on 1 partial tract) A) Conventional B) Refinancings Number Average Value Number Average Value
LOANS ORIGINATED 25 $154,145 5 $170,428 APPLICATIONS APPROVED, NOT ACCEPTED 2 $168,385 0 $0 APPLICATIONS DENIED 0 $0 0 $0 APPLICATIONS WITHDRAWN 1 $150,400 0 $0 FILES CLOSED FOR INCOMPLETENESS 0 $0 0 $0
Aggregated Statistics For Year 1999(Based on 4 partial tracts) A) Conventional B) Refinancings C) Non-occupant Loans on Number Average Value Number Average Value Number Average Value
LOANS ORIGINATED 166 $174,106 66 $162,800 1 $50,890 APPLICATIONS APPROVED, NOT ACCEPTED 20 $173,788 16 $187,522 0 $0 APPLICATIONS DENIED 6 $138,102 5 $151,716 1 $96,440 APPLICATIONS WITHDRAWN 4 $178,700 1 $168,800 0 $0 FILES CLOSED FOR INCOMPLETENESS 2 $220,955 1 $118,590 0 $0
Detailed PMIC statistics for the following Tracts:
8615.05
, 8615.07 , 8615.08 , 8615.09 , 8615.10 , 8616.03 , 8616.04 , 8616.05 Fire-safe hotels and motels in Gurnee, Illinois:
Adventure Inn & Suites, 3740 Grand, Gurnee, Illinois 60031 Phone: (847) 623-7777, Fax: (847) 623-3606
Hampton Inn-gurnee, 5550 Grand Ave, Gurnee, Illinois 60031 Phone: (847) 662-1100, Fax: (847) 662-2556
Sweet Basil Hill Farm, 15937 W Washington, Gurnee, Illinois 60031 Phone: (847) 244-3333
Comfort Inn Gurnee, 6080 Gurnee Mls Blvd E, Gurnee, Illinois 60031 Phone: (847) 855-8866, Fax: (847) 855-8866
Fairfield Inn Gurnee, 6090 Gurnee Mls Circle E, Gurnee, Illinois 60031 Phone: (847) 855-8868
Extended Stay America - Chicago - Gurnee, 5724 Northridge Dr, Gurnee, Illinois 60031 Phone: (847) 662-3060, Fax: (847) 662-3317
Jail Inn, 3803 Grandview, Gurnee, Illinois 60031 Phone: (800) 321-5555
El Rancho Motel, 36355 N Us Hwy 41, Gurnee, Illinois 60031 Phone: (847) 623-5237, Fax: (847) 623-5238
5 other hotels and motels
All 13 fire-safe hotels and motels in Gurnee, Illinois Gurnee compared to Illinois state average:
Unemployed percentage significantly below state average. Black race population percentage below state average. Length of stay since moving in above state average. House age significantly below state average. Percentage of population with a bachelor's degree or higher above state average.
Top Patent Applicants
Ravi Kuchibhotla (86)
Warren M. Kati (42)
Zhi-Fu Tao (35)
Allan C. Krueger (34)
Hong Ding (28)
Maciej Adamczyk (25)
Timothy L. Ruchti (25)
Kent D. Stewart (21)
Vincent L. Giranda (20)
Naveen Aerrabotu (20)
Total of 1453 patent applications in 2008-2024.

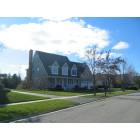
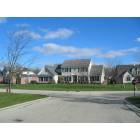
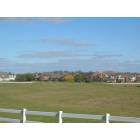
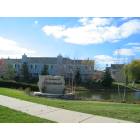
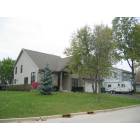
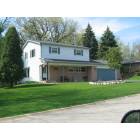
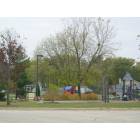
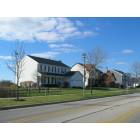
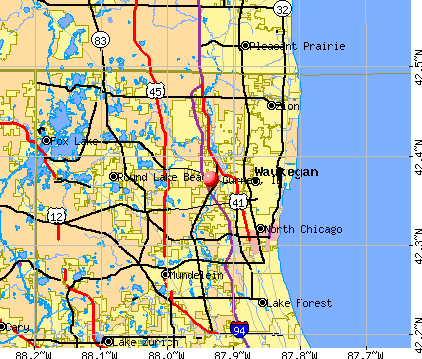


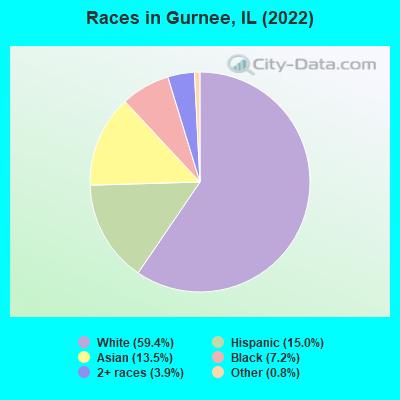
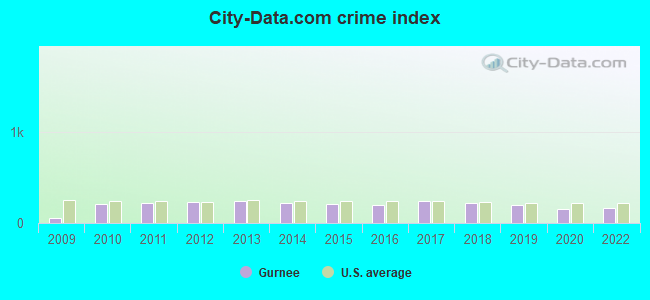
 Recent articles from our blog. Our writers, many of them Ph.D. graduates or candidates, create easy-to-read articles on a wide variety of topics.

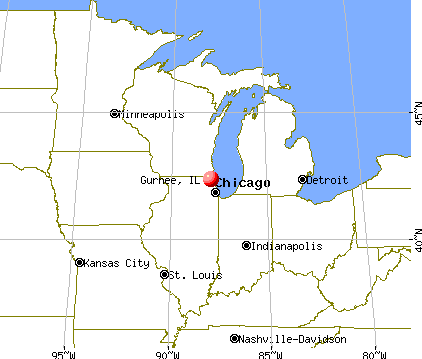
 (3.7 miles
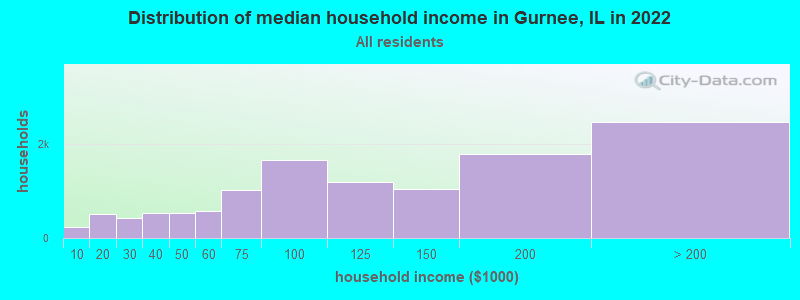
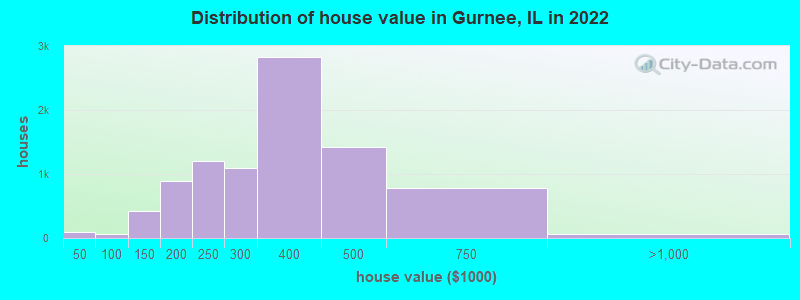

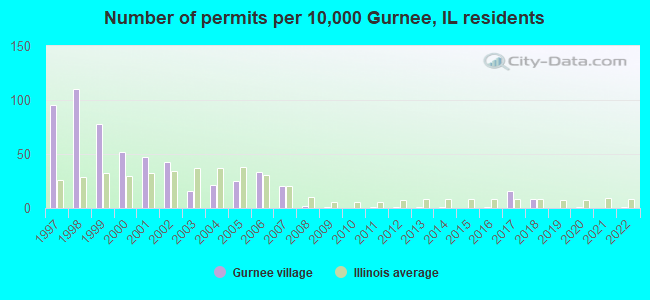
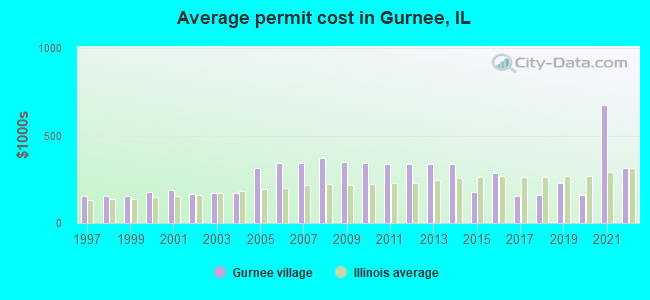
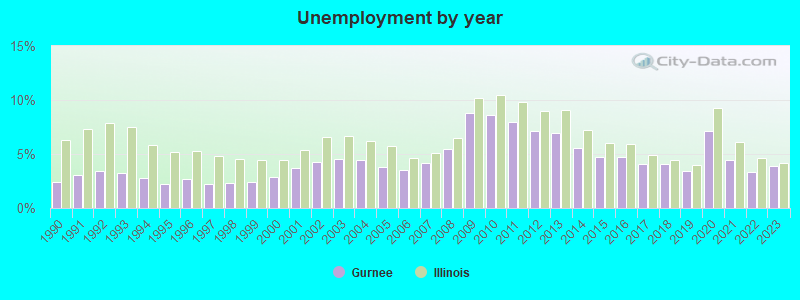
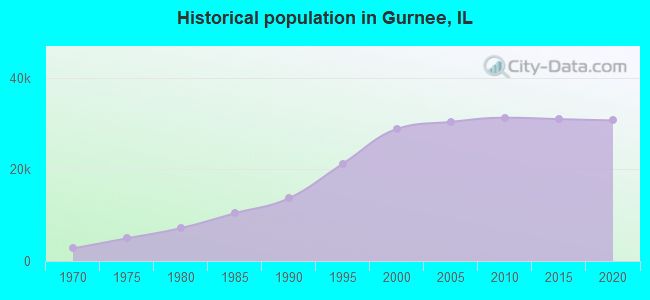
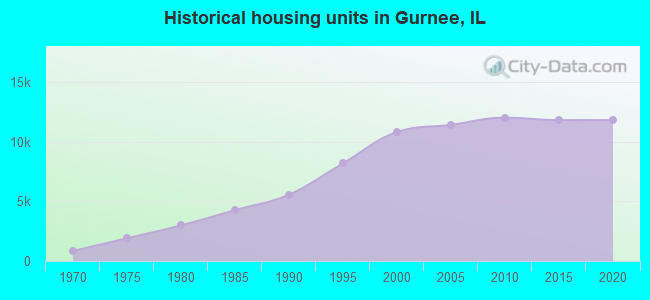
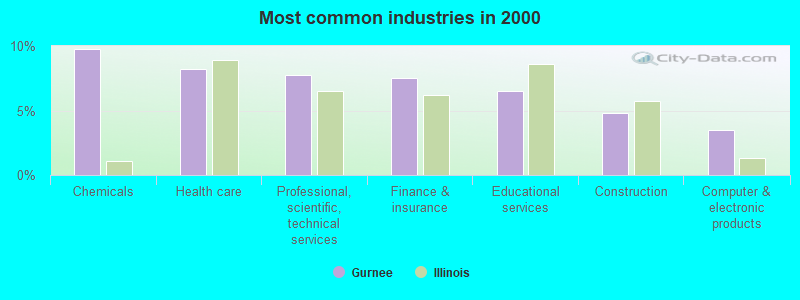
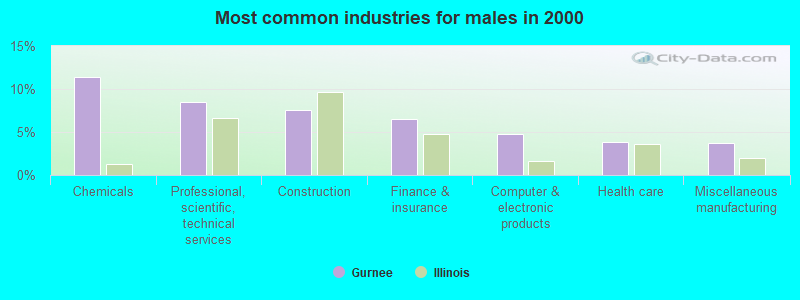
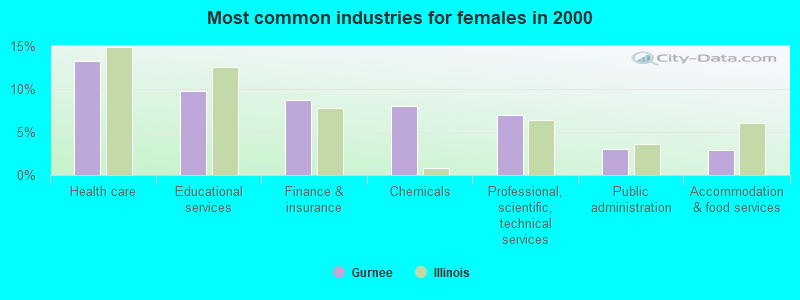
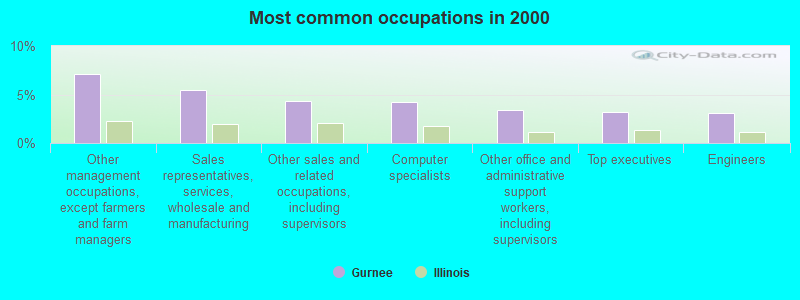
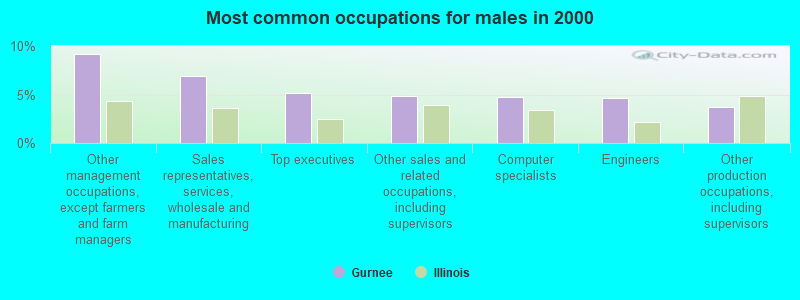
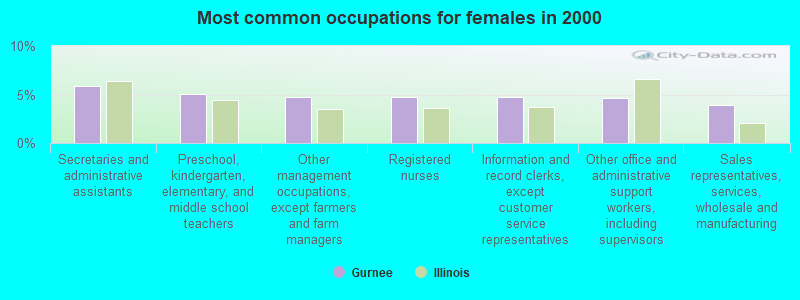
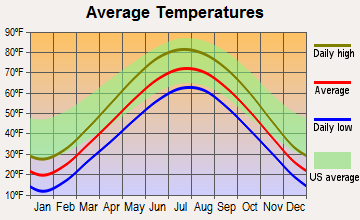
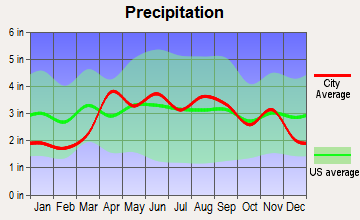
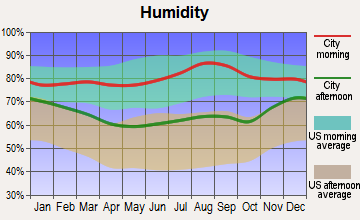
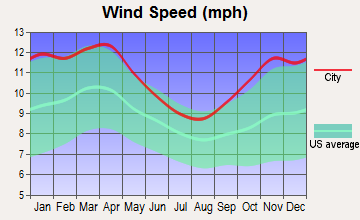
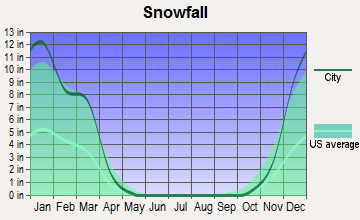
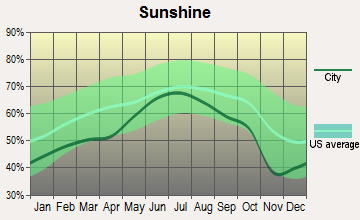
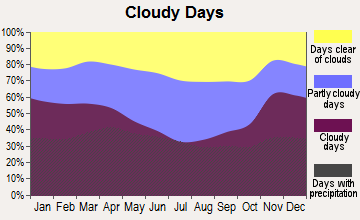
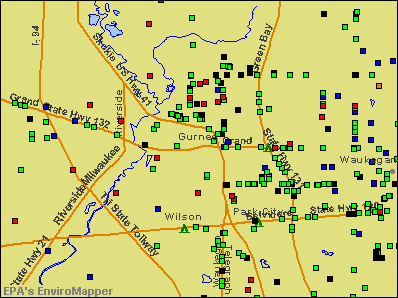

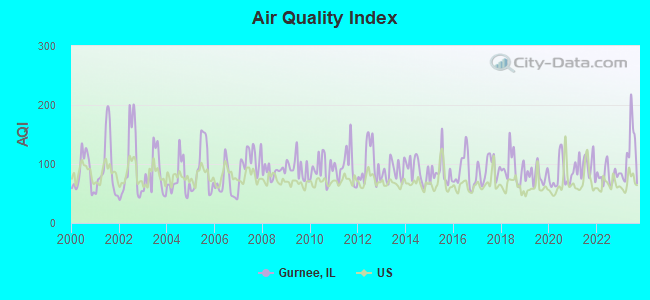
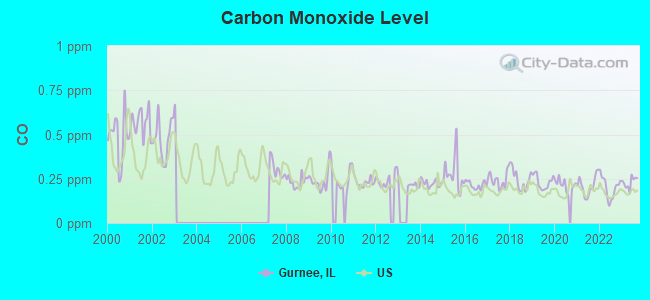
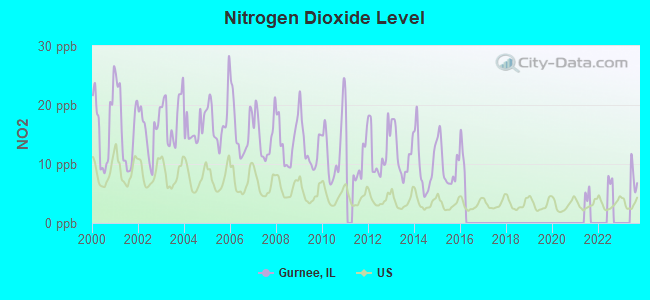
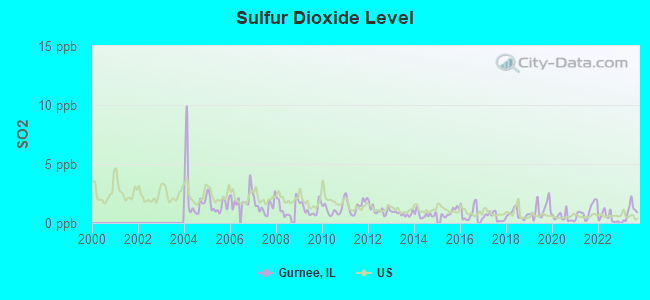
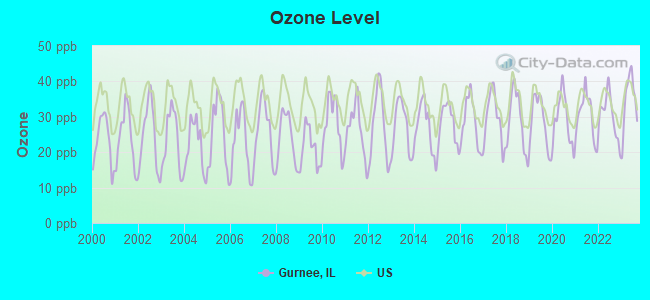

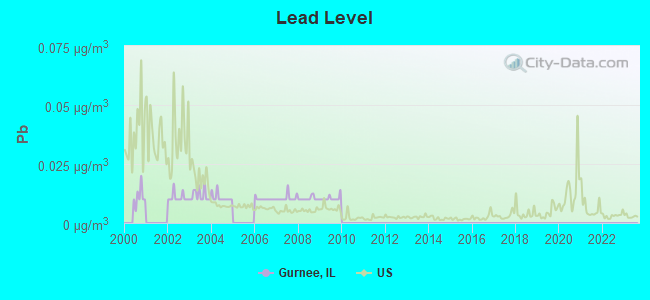

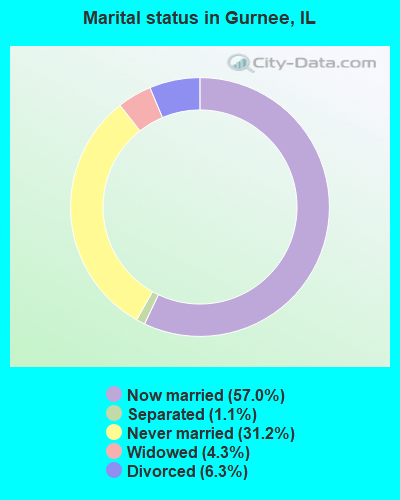
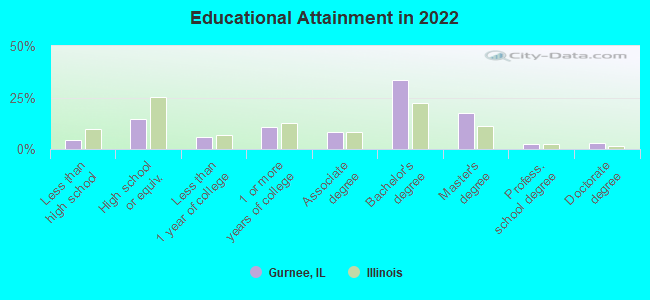
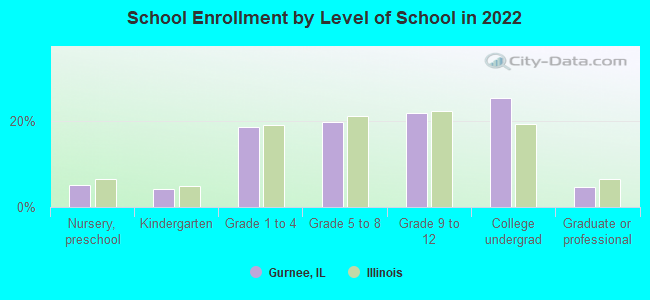
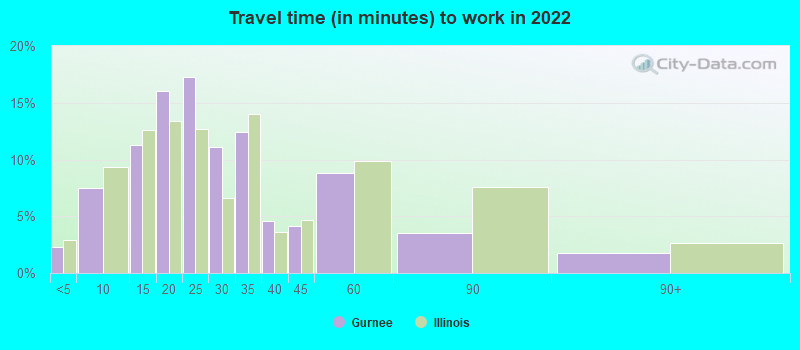
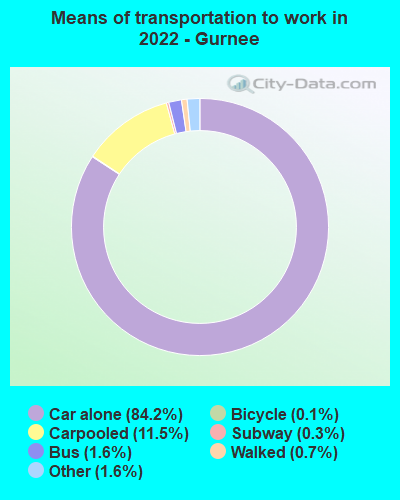
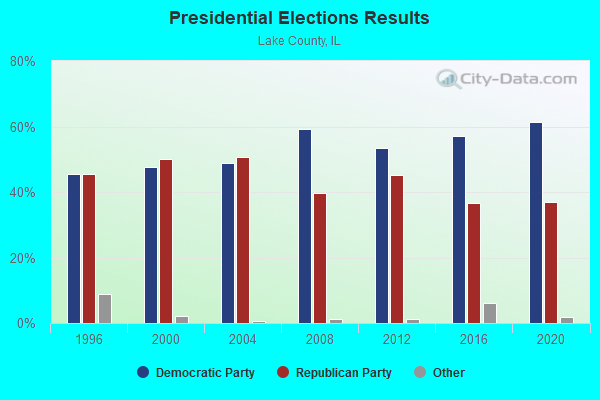
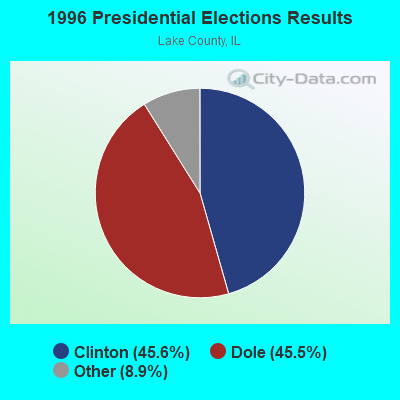
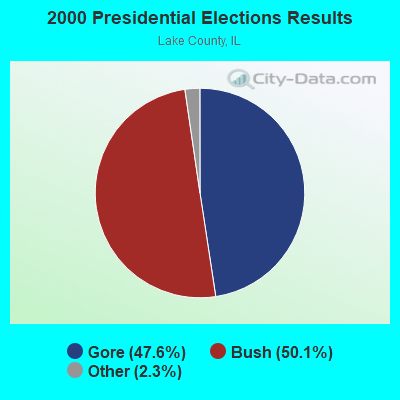
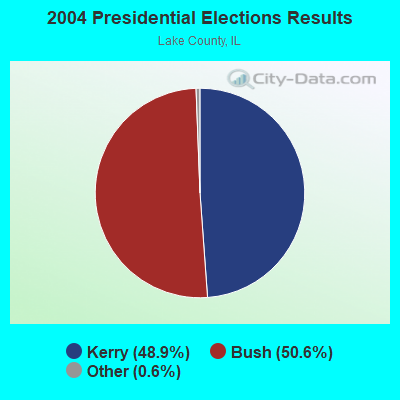
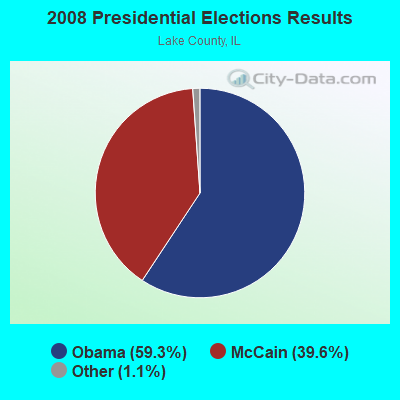
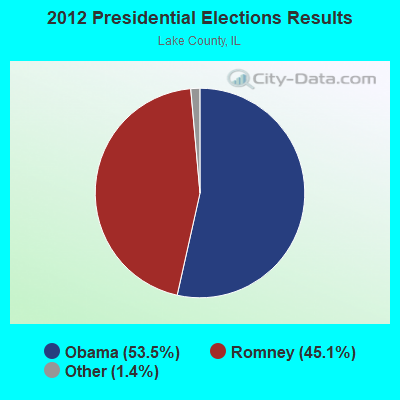
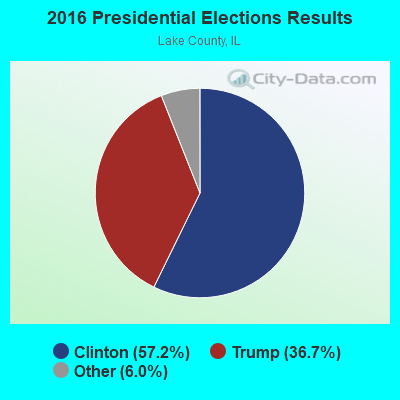
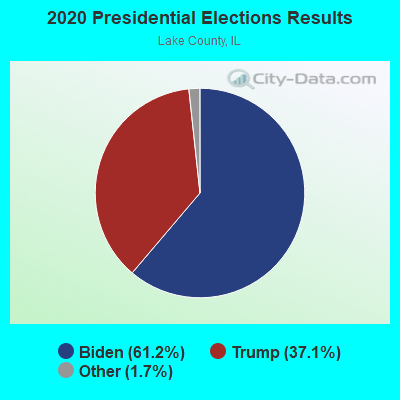

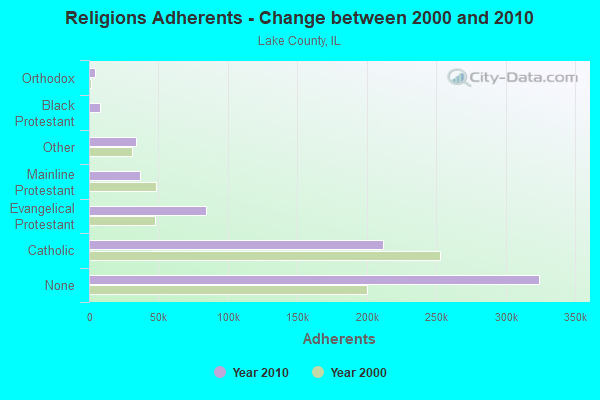
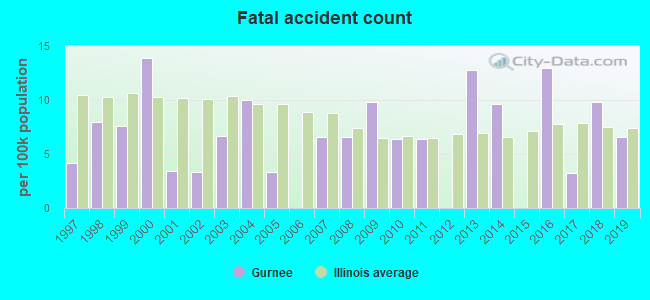
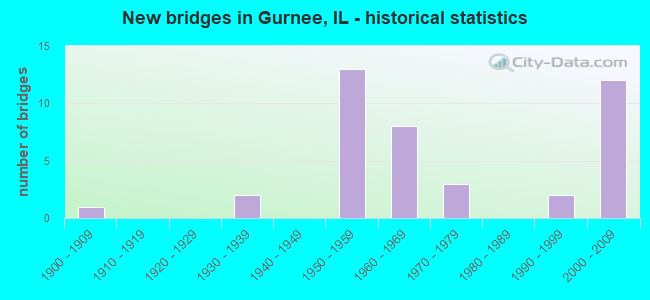
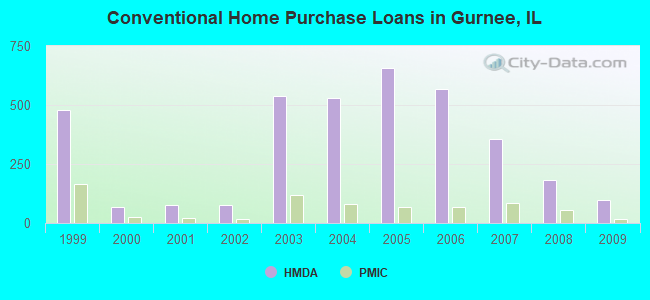
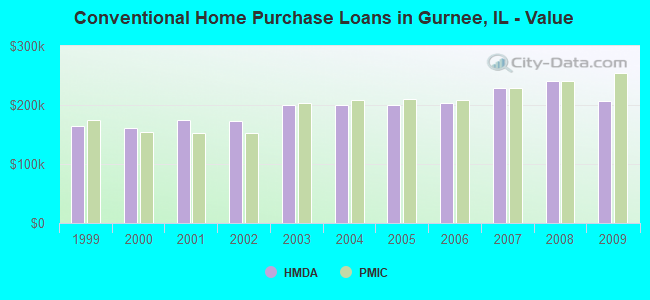
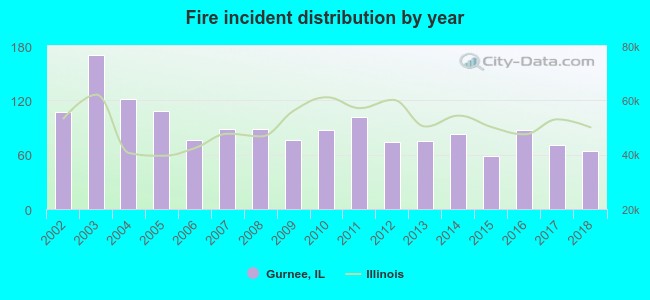 According to the data from the years 2002 - 2018 the average number of fires per year is 90. The highest number of reported fires - 170 took place in 2003, and the least - 59 in 2015. The data has a dropping trend.
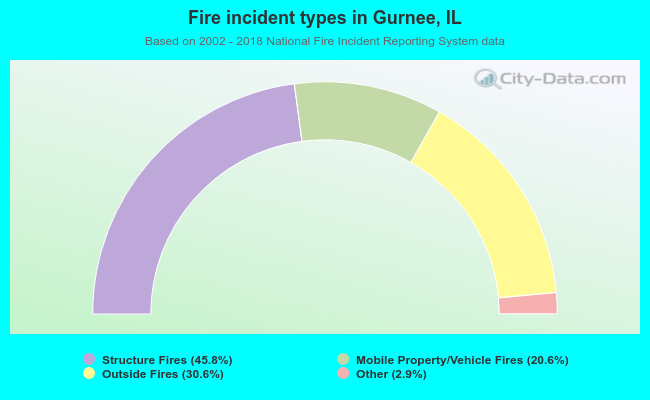 When looking into fire subcategories, the most reports belonged to: Structure Fires (45.8%), and Outside Fires (30.6%).