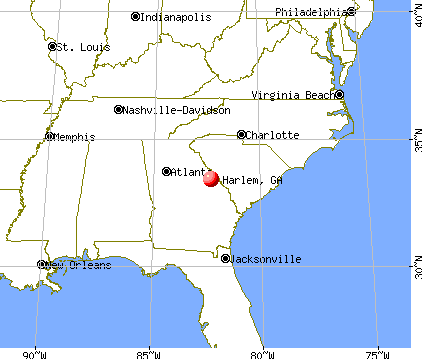
Harlem, Georgia
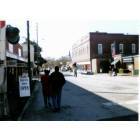
Submit your own pictures of this city and show them to the world
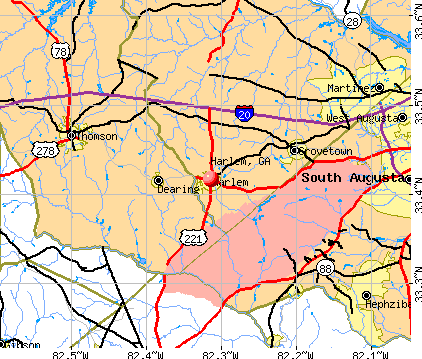
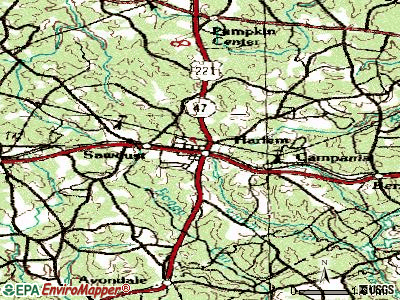
- OSM Map
- General Map
- Google Map
- MSN Map
Population change since 2000: +118.2%
| Males: 1,616 | |
| Females: 2,342 |
| Median resident age: | 29.7 years |
| Georgia median age: | 37.6 years |
Zip codes: 30814.
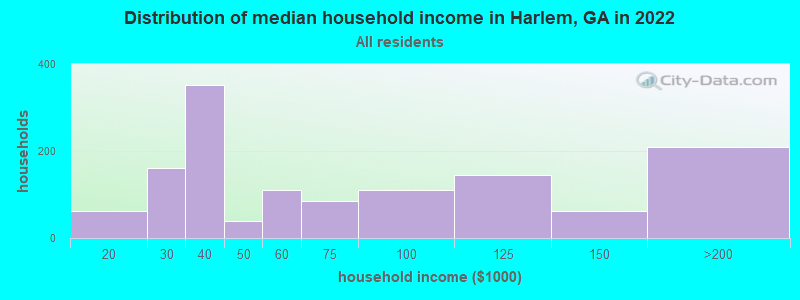
| Harlem: | $52,267 |
| GA: | $72,837 |
Estimated per capita income in 2022: $30,847 (it was $15,439 in 2000)
Harlem city income, earnings, and wages data
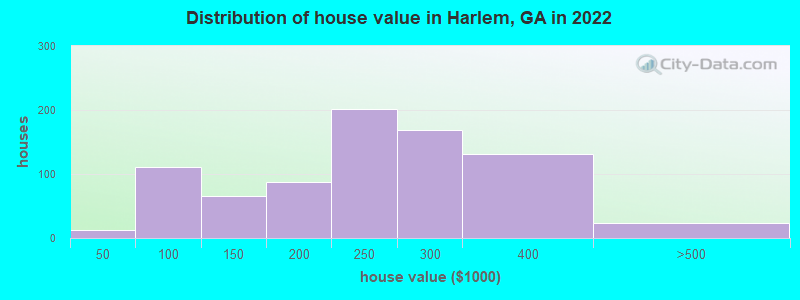
Estimated median house or condo value in 2022: $237,938 (it was $75,500 in 2000)
| Harlem: | $237,938 |
| GA: | $297,400 |
Mean prices in 2022: all housing units: $349,490; detached houses: $364,780; townhouses or other attached units: $179,347; in 2-unit structures: $400,631; in 3-to-4-unit structures: $541,270; in 5-or-more-unit structures: $204,308; mobile homes: $115,515
(3.1% for White Non-Hispanic residents, 0.4% for Black residents)
Detailed information about poverty and poor residents in Harlem, GA

Compare current foreclosures near Harlem, GA:
| Photo | Address | Area | Beds / Baths | Price | Details |
|---|---|---|---|---|---|

|
#1
Huntley Trl
Harlem, GA 30814
|
- sq. feet
|
3 baths 4 beds |
show details | |

|
#2
Oakwood Dr
Harlem, GA 30814
|
1,731 sq. feet
|
2 baths 4 beds |
show details | |

|
#3
Louisville Rd
Harlem, GA 30814
|
1,498 sq. feet
|
2 baths 3 beds |
show details | |

|
#4
Canterbury Ct
Harlem, GA 30814
|
2,460 sq. feet
|
2 baths 4 beds |
show details | |

|
#5
Oliver Hardy Ct
Harlem, GA 30814
|
2,033 sq. feet
|
2 baths 3 beds |
show details | |

|
#6
Pebble Lane Lane
Harlem, GA 30814
|
- sq. feet
|
3 baths 5 beds |
show details | |

|
#7
Kangaroo Ct
Harlem, GA 30814
|
2,408 sq. feet
|
3 baths 6 beds |
show details | |

|
#8
Haverhill Dr
Harlem, GA 30814
|
1,296 sq. feet
|
1 baths 3 beds |
show details | |

|
#9
Peachtree St
Harlem, GA 30814
|
1,025 sq. feet
|
2 baths 2 beds |
show details | |

|
#10
Louisville Rd
Harlem, GA 30814
|
900 sq. feet
|
1 baths 1 beds |
show details |
| Photo | Address | Area | Beds / Baths | Price | Details |
|---|---|---|---|---|---|

|
#11
Collins Rd
Harlem, GA 30814
|
1,025 sq. feet
|
1 baths 2 beds |
show details | |

|
#12
Paschal St
Harlem, GA 30814
|
964 sq. feet
|
1 baths 3 beds |
show details | |

|
#13
Wells Dr
Harlem, GA 30814
|
2,650 sq. feet
|
3 baths 5 beds |
show details | |

|
#14
Gordon Hwy
Harlem, GA 30814
|
1,036 sq. feet
|
1 baths 2 beds |
show details | |

|
#15
Otis Way
Harlem, GA 30814
|
2,356 sq. feet
|
2 baths 3 beds |
show details | |

|
#16
Paschal St
Harlem, GA 30814
|
- sq. feet
|
- baths - beds |
show details | |

|
#17
Oliver Hardy Ct
Harlem, GA 30814
|
- sq. feet
|
- baths - beds |
show details | |

|
#18
Norwich Dr
Harlem, GA 30814
|
- sq. feet
|
- baths - beds |
show details | |

|
#19
S Fairview Dr
Harlem, GA 30814
|
- sq. feet
|
- baths - beds |
show details | |

|
#20
County Line Rd
Harlem, GA 30814
|
1,860 sq. feet
|
- baths - beds |
show details |
| Photo | Address | Area | Beds / Baths | Price | Details |
|---|---|---|---|---|---|

|
#21
Gordon Highway
Harlem, GA 30814
|
- sq. feet
|
- baths - beds |
show details | |

|
#22
E Milledgeville Ct
Harlem, GA 30814
|
- sq. feet
|
- baths - beds |
show details | |

|
#23
Dove Rd
Harlem, GA 30814
|
- sq. feet
|
- baths - beds |
show details | |

|
#24
Goldfinch Dr
Augusta, GA 30906
|
1,318 sq. feet
|
2 baths 4 beds |
$180,000
|
show details |

|
#25
Blanchard Rd
Evans, GA 30809
|
2,343 sq. feet
|
3 baths 4 beds |
$420,000
|
show details |

|
#26
Old Augusta Hwy
Harlem, GA 30814
|
- sq. feet
|
- baths - beds |
show details | |

|
#27
Brighton Dr
Evans, GA 30809
|
2,321 sq. feet
|
2 baths 4 beds |
show details | |

|
#28
N Thompson St
Wrens, GA 30833
|
1,493 sq. feet
|
2 baths 3 beds |
show details | |

|
#29
Martinique Dr
Augusta, GA 30909
|
2,816 sq. feet
|
3 baths 5 beds |
show details | |

|
#30
Cobb Rd
Evans, GA 30809
|
1,803 sq. feet
|
2 baths 4 beds |
show details |
| Photo | Address | Area | Beds / Baths | Price | Details |
|---|---|---|---|---|---|

|
#31
Grove Landing Ln
Grovetown, GA 30813
|
2,436 sq. feet
|
3 baths 4 beds |
show details | |

|
#32
Patiller Rd
Hephzibah, GA 30815
|
1,736 sq. feet
|
2 baths 3 beds |
show details | |

|
#33
Oxford Dr
Hephzibah, GA 30815
|
1,445 sq. feet
|
2 baths 3 beds |
show details | |

|
#34
Scarlett Ct
Evans, GA 30809
|
1,327 sq. feet
|
2 baths 3 beds |
show details | |

|
#35
Crane Ferry Rd
Augusta, GA 30907
|
1,096 sq. feet
|
1 baths 3 beds |
show details | |

|
#36
Ridgeview Dr
Augusta, GA 30909
|
1,485 sq. feet
|
2 baths 3 beds |
show details | |

|
#37
Braswell Rd
Blythe, GA 30805
|
2,387 sq. feet
|
3 baths 3 beds |
show details | |

|
#38
Faircrest Ave
Augusta, GA 30906
|
1,704 sq. feet
|
2 baths 3 beds |
show details | |

|
#39
Victoria Fls
Grovetown, GA 30813
|
2,294 sq. feet
|
2 baths 4 beds |
show details | |

|
#40
Fieldcrest Rd
Augusta, GA 30906
|
1,441 sq. feet
|
2 baths 3 beds |
show details |
| Photo | Address | Area | Beds / Baths | Price | Details |
|---|---|---|---|---|---|

|
#41
Neville St
Grovetown, GA 30813
|
- sq. feet
|
2 baths 4 beds |
show details | |

|
#42
Bassford Dr
Hephzibah, GA 30815
|
1,287 sq. feet
|
2 baths 3 beds |
show details | |

|
#43
Madison Ln
Augusta, GA 30909
|
3,633 sq. feet
|
3 baths 5 beds |
show details | |

|
#44
Ravenwood Dr
Augusta, GA 30907
|
2,118 sq. feet
|
2 baths 3 beds |
show details | |

|
#45
Essex Pl
Hephzibah, GA 30815
|
1,865 sq. feet
|
2 baths 3 beds |
show details | |

|
#46
Turner Dr
Evans, GA 30809
|
1,675 sq. feet
|
2 baths 3 beds |
show details | |

|
#47
Apache Trl
Hephzibah, GA 30815
|
1,698 sq. feet
|
2 baths 3 beds |
show details | |

|
#48
Burdette Dr
Augusta, GA 30909
|
1,542 sq. feet
|
2 baths 3 beds |
show details | |

|
#49
Pleasant Home Rd
Augusta, GA 30907
|
1,740 sq. feet
|
2 baths 4 beds |
show details | |

|
Check over 1 million property listings on Foreclosure.com!
|
browse all offers | |||


- 2,49565.5%White alone
- 1,13229.7%Black alone
- 1233.2%Two or more races
- 721.9%Hispanic
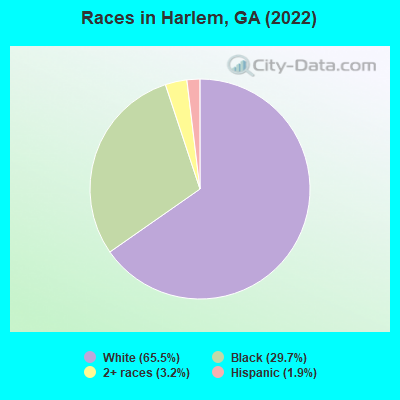
Races in Harlem detailed stats: ancestries, foreign born residents, place of birth
According to our research of Georgia and other state lists, there were 25 registered sex offenders living in Harlem, Georgia as of April 16, 2024.
The ratio of all residents to sex offenders in Harlem is 119 to 1.
Type |
2009 |
2010 |
2011 |
2012 |
2013 |
2014 |
2015 |
2016 |
2017 |
2018 |
2019 |
2020 |
2021 |
2022 |
|---|---|---|---|---|---|---|---|---|---|---|---|---|---|---|
| Murders (per 100,000) | 0 (0.0) | 0 (0.0) | 0 (0.0) | 0 (0.0) | 0 (0.0) | 0 (0.0) | 0 (0.0) | 0 (0.0) | 0 (0.0) | 0 (0.0) | 0 (0.0) | 0 (0.0) | 0 (0.0) | 0 (0.0) |
| Rapes (per 100,000) | 0 (0.0) | 3 (112.5) | 2 (74.0) | 0 (0.0) | 1 (35.6) | 1 (34.6) | 0 (0.0) | 0 (0.0) | 0 (0.0) | 0 (0.0) | 0 (0.0) | 1 (28.9) | 1 (27.4) | 0 (0.0) |
| Robberies (per 100,000) | 0 (0.0) | 2 (75.0) | 0 (0.0) | 0 (0.0) | 0 (0.0) | 0 (0.0) | 0 (0.0) | 0 (0.0) | 0 (0.0) | 5 (155.6) | 0 (0.0) | 0 (0.0) | 0 (0.0) | 0 (0.0) |
| Assaults (per 100,000) | 2 (96.6) | 8 (300.1) | 2 (74.0) | 2 (71.9) | 2 (71.1) | 0 (0.0) | 2 (67.6) | 0 (0.0) | 0 (0.0) | 3 (93.3) | 0 (0.0) | 0 (0.0) | 0 (0.0) | 1 (24.2) |
| Burglaries (per 100,000) | 20 (965.7) | 14 (525.1) | 8 (296.2) | 4 (143.8) | 7 (249.0) | 6 (207.6) | 11 (371.6) | 4 (132.2) | 0 (0.0) | 11 (342.3) | 0 (0.0) | 1 (28.9) | 0 (0.0) | 0 (0.0) |
| Thefts (per 100,000) | 0 (0.0) | 27 (1,013) | 43 (1,592) | 35 (1,258) | 28 (996.1) | 28 (968.9) | 38 (1,284) | 22 (727.0) | 27 (877.5) | 21 (653.4) | 0 (0.0) | 6 (173.5) | 13 (356.4) | 8 (193.7) |
| Auto thefts (per 100,000) | 1 (48.3) | 0 (0.0) | 2 (74.0) | 2 (71.9) | 3 (106.7) | 2 (69.2) | 4 (135.1) | 2 (66.1) | 1 (32.5) | 0 (0.0) | 1 (29.8) | 0 (0.0) | 0 (0.0) | 0 (0.0) |
| Arson (per 100,000) | 0 (0.0) | 0 (0.0) | 0 (0.0) | 0 (0.0) | 0 (0.0) | 0 (0.0) | 0 (0.0) | 0 (0.0) | 0 (0.0) | 0 (0.0) | 0 (0.0) | 0 (0.0) | 0 (0.0) | 0 (0.0) |
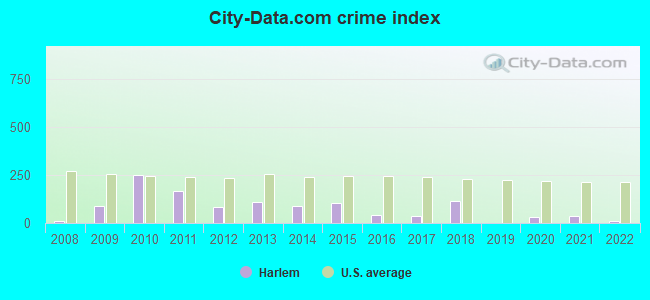
| City-Data.com crime index | 90.8 | 249.8 | 164.4 | 80.5 | 108.5 | 86.5 | 101.7 | 43.6 | 37.7 | 115.4 | 2.4 | 32.1 | 36.2 | 12.6 |
The City-Data.com crime index weighs serious crimes and violent crimes more heavily. Higher means more crime, U.S. average is 246.1. It adjusts for the number of visitors and daily workers commuting into cities.
Crime rate in Harlem detailed stats: murders, rapes, robberies, assaults, burglaries, thefts, arson
Full-time law enforcement employees in 2021, including police officers: 7 (6 officers - 6 male; 0 female).
| Officers per 1,000 residents here: | 1.64 |
| Georgia average: | 2.45 |
 Recent articles from our blog. Our writers, many of them Ph.D. graduates or candidates, create easy-to-read articles on a wide variety of topics.

 | Is The Atlanta (ITP) Boom Over? (339 replies) |
| Songs about the A... (155 replies) |
| Will Atlanta ever lose its title as the Black Mecca? (89 replies) |
| Harlem City limits may double in size if GA governor signs bill (1 reply) |
| Harlem grapples with transportation issues (1 reply) |
| $10 million 5th street pedestrian bridge (21 replies) |
Latest news from Harlem, GA collected exclusively by city-data.com from local newspapers, TV, and radio stations
Ancestries: American (17.1%), English (6.6%), German (5.0%), Irish (2.4%), European (2.1%), Scottish (1.8%).
Current Local Time: EST time zone
Elevation: 540 feet
Land area: 2.52 square miles.
Population density: 1,571 people per square mile (low).
40 residents are foreign born
| This city: | 1.0% |
| Georgia: | 10.4% |
| Harlem city: | 0.9% ($717) |
| Georgia: | 0.9% ($919) |
Nearest city with pop. 50,000+: Augusta-Richmond County, GA  (16.9 miles , pop. 195,182).
Nearest city with pop. 200,000+: Atlanta, GA (122.7 miles , pop. 416,474).
Nearest city with pop. 1,000,000+: Philadelphia, PA (603.9 miles , pop. 1,517,550).
Nearest cities:
), ), )Latitude: 33.42 N, Longitude: 82.31 W
Area code: 706
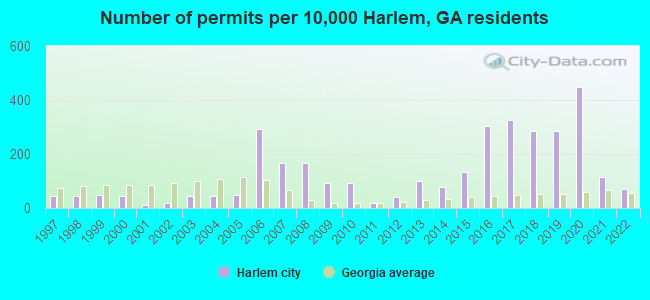
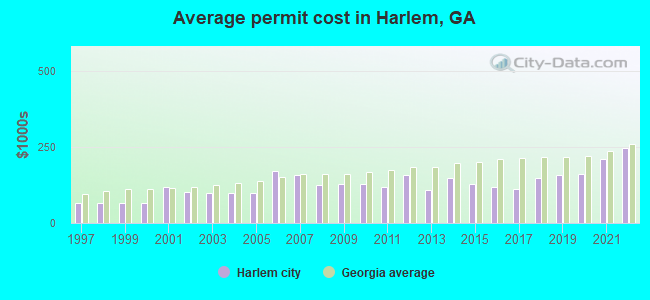
Single-family new house construction building permits:
- 2022: 13 buildings, average cost: $247,100
- 2021: 21 buildings, average cost: $211,100
- 2020: 81 buildings, average cost: $159,500
- 2019: 52 buildings, average cost: $158,000
- 2018: 52 buildings, average cost: $147,100
- 2017: 59 buildings, average cost: $112,500
- 2016: 55 buildings, average cost: $117,400
- 2015: 24 buildings, average cost: $129,300
- 2014: 14 buildings, average cost: $148,200
- 2013: 18 buildings, average cost: $108,900
- 2012: 7 buildings, average cost: $158,300
- 2011: 3 buildings, average cost: $119,000
- 2010: 17 buildings, average cost: $126,500
- 2009: 17 buildings, average cost: $126,500
- 2008: 30 buildings, average cost: $124,200
- 2007: 30 buildings, average cost: $158,900
- 2006: 53 buildings, average cost: $169,500
- 2005: 9 buildings, average cost: $99,900
- 2004: 8 buildings, average cost: $99,900
- 2003: 8 buildings, average cost: $99,900
- 2002: 3 buildings, average cost: $102,600
- 2001: 2 buildings, average cost: $116,500
- 2000: 8 buildings, average cost: $65,100
- 1999: 9 buildings, average cost: $65,100
- 1998: 8 buildings, average cost: $65,100
- 1997: 8 buildings, average cost: $65,100
| Here: | 2.7% |
| Georgia: | 2.9% |
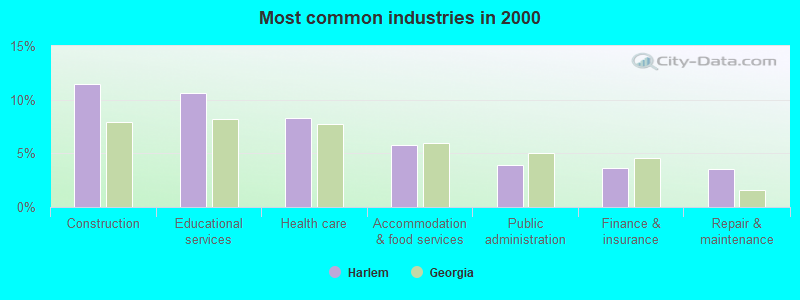
- Construction (11.4%)
- Educational services (10.6%)
- Health care (8.3%)
- Accommodation & food services (5.8%)
- Public administration (3.9%)
- Finance & insurance (3.7%)
- Repair & maintenance (3.5%)
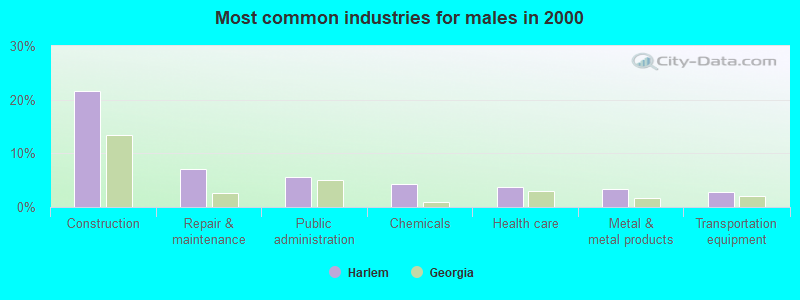
- Construction (21.6%)
- Repair & maintenance (7.0%)
- Public administration (5.6%)
- Chemicals (4.2%)
- Health care (3.6%)
- Metal & metal products (3.4%)
- Transportation equipment (2.8%)
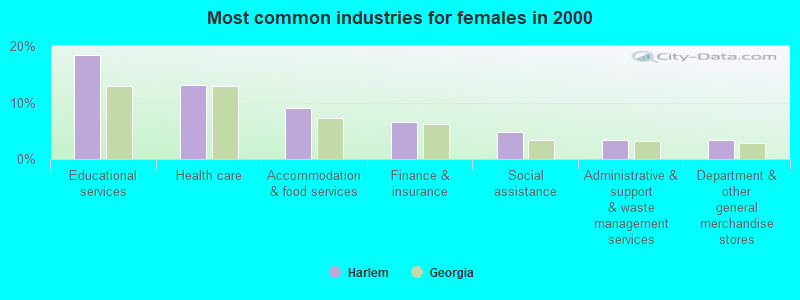
- Educational services (18.5%)
- Health care (13.1%)
- Accommodation & food services (9.1%)
- Finance & insurance (6.5%)
- Social assistance (4.8%)
- Administrative & support & waste management services (3.4%)
- Department & other general merchandise stores (3.4%)
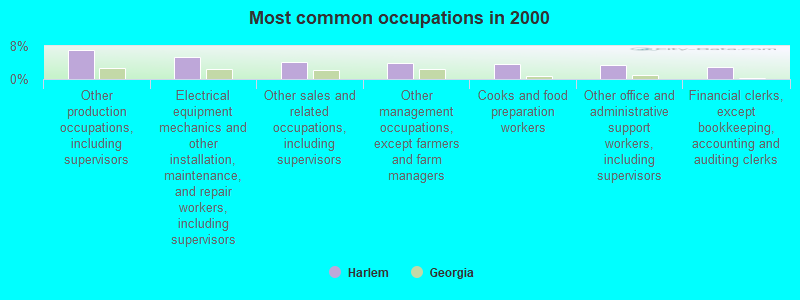
- Other production occupations, including supervisors (6.9%)
- Electrical equipment mechanics and other installation, maintenance, and repair workers, including supervisors (5.2%)
- Other sales and related occupations, including supervisors (4.2%)
- Other management occupations, except farmers and farm managers (3.9%)
- Cooks and food preparation workers (3.7%)
- Other office and administrative support workers, including supervisors (3.4%)
- Financial clerks, except bookkeeping, accounting and auditing clerks (3.0%)
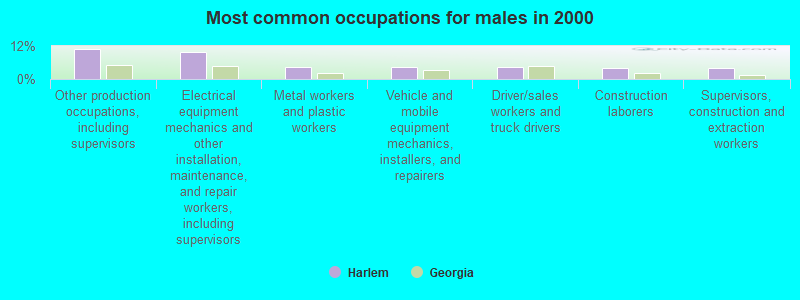
- Other production occupations, including supervisors (10.9%)
- Electrical equipment mechanics and other installation, maintenance, and repair workers, including supervisors (9.8%)
- Metal workers and plastic workers (4.5%)
- Vehicle and mobile equipment mechanics, installers, and repairers (4.5%)
- Driver/sales workers and truck drivers (4.2%)
- Construction laborers (3.9%)
- Supervisors, construction and extraction workers (3.9%)
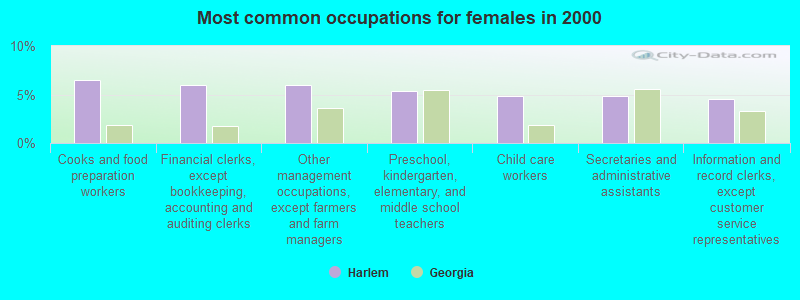
- Cooks and food preparation workers (6.5%)
- Financial clerks, except bookkeeping, accounting and auditing clerks (6.0%)
- Other management occupations, except farmers and farm managers (6.0%)
- Preschool, kindergarten, elementary, and middle school teachers (5.4%)
- Child care workers (4.8%)
- Secretaries and administrative assistants (4.8%)
- Information and record clerks, except customer service representatives (4.5%)
Average climate in Harlem, Georgia
Based on data reported by over 4,000 weather stations


(lower is better)
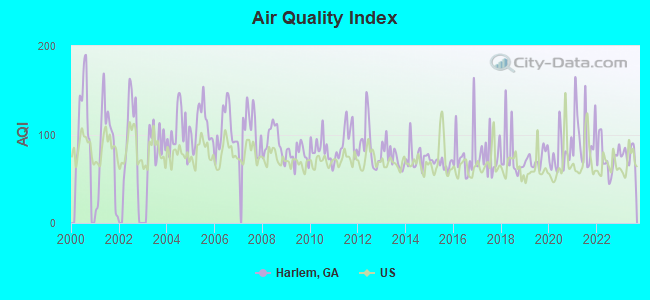
Air Quality Index (AQI) level in 2023 was 77.3. This is about average.
| City: | 77.3 |
| U.S.: | 72.6 |
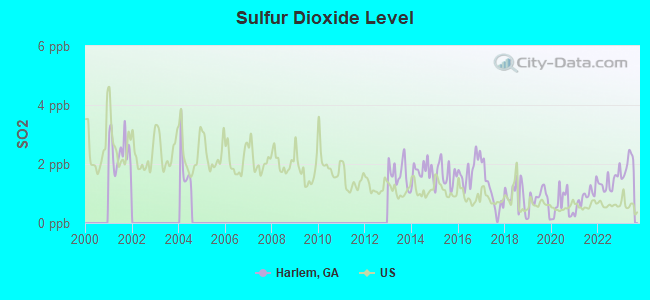
Sulfur Dioxide (SO2) [ppb] level in 2023 was 1.97. This is worse than average. Closest monitor was 16.9 miles away from the city center.
| City: | 1.97 |
| U.S.: | 1.51 |
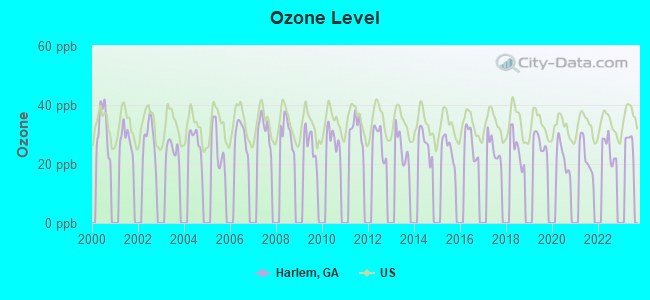
Ozone [ppb] level in 2022 was 25.0. This is better than average. Closest monitor was 15.5 miles away from the city center.
| City: | 25.0 |
| U.S.: | 33.3 |
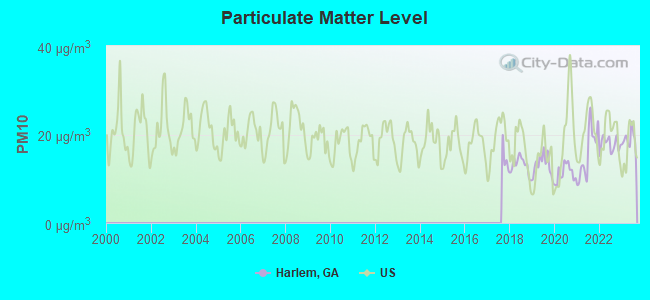
Particulate Matter (PM10) [µg/m3] level in 2023 was 19.0. This is about average. Closest monitor was 16.9 miles away from the city center.
| City: | 19.0 |
| U.S.: | 19.2 |
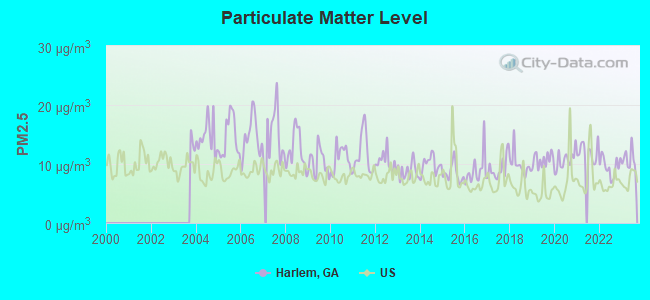
Particulate Matter (PM2.5) [µg/m3] level in 2023 was 10.8. This is worse than average. Closest monitor was 16.9 miles away from the city center.
| City: | 10.8 |
| U.S.: | 8.1 |
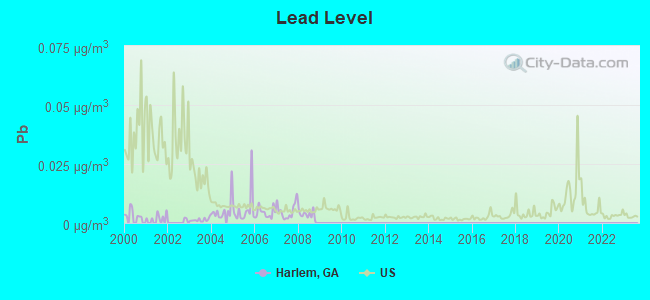
Lead (Pb) [µg/m3] level in 2008 was 0.00372. This is significantly better than average. Closest monitor was 18.6 miles away from the city center.
| City: | 0.00372 |
| U.S.: | 0.00931 |
Tornado activity:
Harlem-area historical tornado activity is slightly below Georgia state average. It is 3% smaller than the overall U.S. average.
On 11/22/1992, a category F3 (max. wind speeds 158-206 mph) tornado 20.6 miles away from the Harlem city center killed one person and injured 9 people and caused between $500,000 and $5,000,000 in damages.
On 11/22/1992, a category F4 (max. wind speeds 207-260 mph) tornado 41.5 miles away from the city center killed 5 people and injured 86 people and caused between $5,000,000 and $50,000,000 in damages.
Earthquake activity:
Harlem-area historical earthquake activity is significantly above Georgia state average. It is 8% smaller than the overall U.S. average.On 8/2/1974 at 08:52:09, a magnitude 4.9 (4.3 MB, 4.9 LG, Class: Light, Intensity: IV - V) earthquake occurred 33.0 miles away from the city center
On 11/22/1974 at 05:25:55, a magnitude 4.7 (4.7 MB) earthquake occurred 130.6 miles away from Harlem center
On 8/9/2020 at 12:07:37, a magnitude 5.1 (5.1 MW, Depth: 4.7 mi, Class: Moderate, Intensity: VI - VII) earthquake occurred 222.6 miles away from the city center
On 2/15/2014 at 03:23:38, a magnitude 4.1 (4.1 MW, Depth: 3.2 mi) earthquake occurred 30.5 miles away from Harlem center
On 4/29/2003 at 08:59:39, a magnitude 4.9 (4.4 MB, 4.6 MW, 4.9 LG) earthquake occurred 204.3 miles away from the city center
On 8/21/1992 at 16:31:55, a magnitude 4.4 (4.1 MB, 4.1 LG, 4.4 LG, Depth: 6.2 mi) earthquake occurred 129.7 miles away from Harlem center
Magnitude types: regional Lg-wave magnitude (LG), body-wave magnitude (MB), moment magnitude (MW)
Natural disasters:
The number of natural disasters in Columbia County (7) is smaller than the US average (15).Major Disasters (Presidential) Declared: 3
Emergencies Declared: 3
Causes of natural disasters: Floods: 2, Storms: 2, Winter Storms: 2, Drought: 1, Hurricane: 1, Tornado: 1, Other: 1 (Note: some incidents may be assigned to more than one category).
Hospitals and medical centers near Harlem:
- FMC THOMSON DIALYSIS (Dialysis Facility, about 11 miles away; THOMSON, GA)
- CSRA HOME HEALTH AGENCY COLUMBIA (Home Health Center, about 12 miles away; THOMSON, GA)
- HEARTLAND HOSPICE SERVICES ( AUGUSTA ) (Hospital, about 14 miles away; AUGUSTA, GA)
- UNIVERSITY EXTENDED CARE/WESTW (Nursing Home, about 14 miles away; EVANS, GA)
- KENTWOOD NURSING FACILITY (Nursing Home, about 14 miles away; AUGUSTA, GA)
- BRANDON WILDE PAVILION (Nursing Home, about 14 miles away; EVANS, GA)
- DOCTORS HOSPITAL Acute Care Hospitals (about 14 miles away; AUGUSTA, GA)
Colleges/universities with over 2000 students nearest to Harlem:
- Augusta Technical College (about 16 miles; Augusta, GA; Full-time enrollment: 3,494)
- Georgia Regents University (about 19 miles; Augusta, GA; FT enrollment: 6,862)
- Aiken Technical College (about 29 miles; Graniteville, SC; FT enrollment: 2,107)
- University of South Carolina-Aiken (about 34 miles; Aiken, SC; FT enrollment: 2,815)
- Lander University (about 55 miles; Greenwood, SC; FT enrollment: 2,870)
- Piedmont Technical College (about 56 miles; Greenwood, SC; FT enrollment: 4,831)
- East Georgia State College (about 57 miles; Swainsboro, GA; FT enrollment: 2,345)
Public high school in Harlem:
- HARLEM HIGH SCHOOL (Students: 1,168, Location: 1070 APPLING HARLEM RD, Grades: 9-12)
Public elementary/middle schools in Harlem:
- NORTH HARLEM ELEMENTARY SCHOOL (Students: 630, Location: 525 FAIRVIEW DR, Grades: PK-5)
- HARLEM MIDDLE SCHOOL (Students: 423, Location: 375 W FORREST ST, Grades: 6-8)
Points of interest:
Notable locations in Harlem: Harlem Department of Public Safety Station 1 (A), Harlem Department of Public Safety Station 2 (B). Display/hide their locations on the map
Tourist attraction: Columbia County Libraries (Cultural Attractions- Events- & Facilities; 5907 Euchee Creek Drive).
Birthplace of: Oliver Hardy - Silent film comedian.
| This city: | 2.6 people |
| Georgia: | 2.6 people |
| This city: | 70.8% |
| Whole state: | 68.5% |
| This city: | 5.4% |
| Whole state: | 5.9% |
Likely homosexual households (counted as self-reported same-sex unmarried-partner households)
- Lesbian couples: 0.2% of all households
- Gay men: 0.1% of all households
Banks with branches in Harlem (2011 data):
- Regions Bank: Harlem Branch at 255 North Louisville Street, branch established on 1909/12/13. Info updated 2011/02/24: Bank assets: $123,368.2 mil, Deposits: $98,301.3 mil, headquarters in Birmingham, AL, positive income, Commercial Lending Specialization, 1778 total offices, Holding Company: Regions Financial Corporation
For population 15 years and over in Harlem:
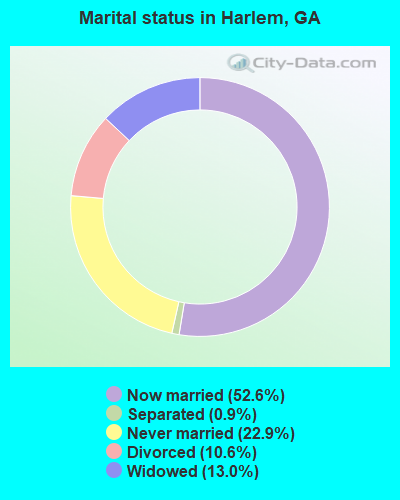
- Never married: 22.9%
- Now married: 52.6%
- Separated: 0.9%
- Widowed: 13.0%
- Divorced: 10.6%
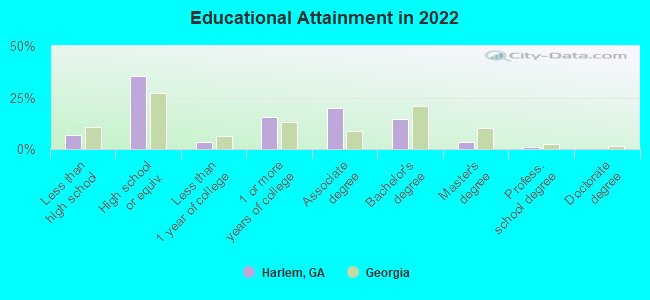
For population 25 years and over in Harlem:
- High school or higher: 93.8%
- Bachelor's degree or higher: 19.2%
- Graduate or professional degree: 3.7%
- Unemployed: 4.3%
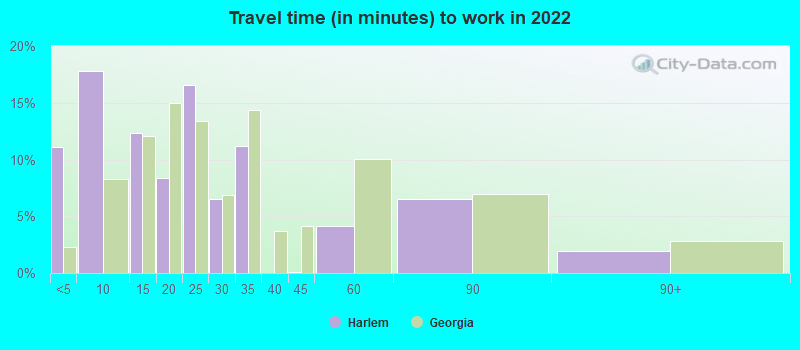
- Mean travel time to work (commute): 22.6 minutes
| Here: | 7.4 |
| Georgia average: | 12.2 |
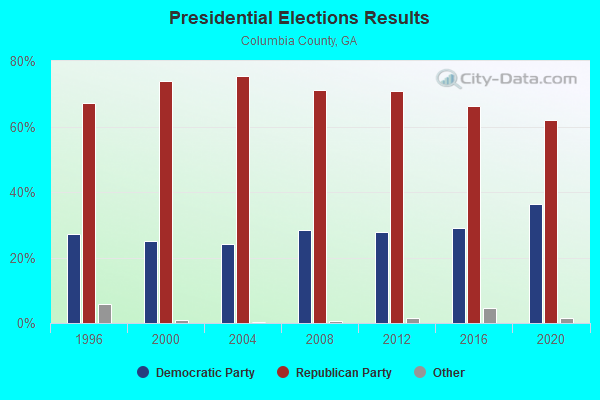
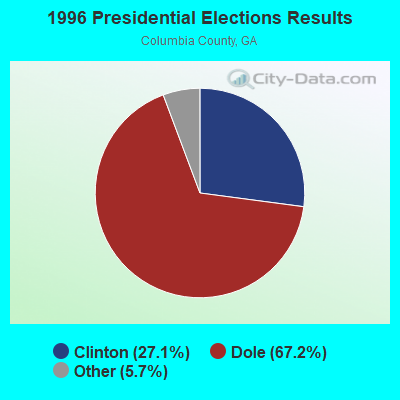
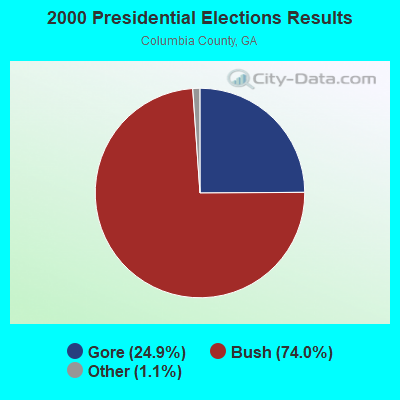
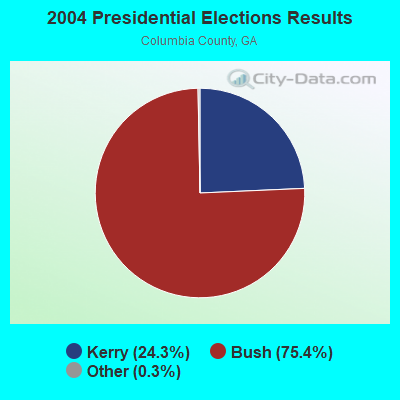
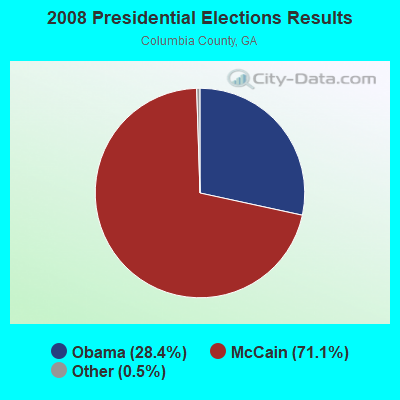

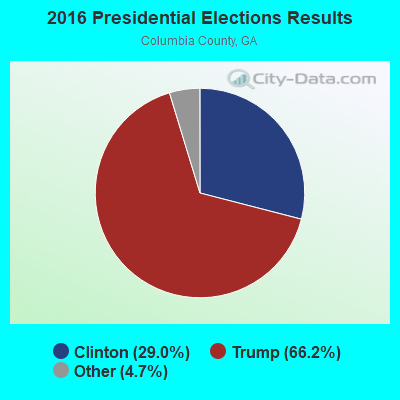

Graphs represent county-level data. Detailed 2008 Election Results
Religion statistics for Harlem, GA (based on Columbia County data)
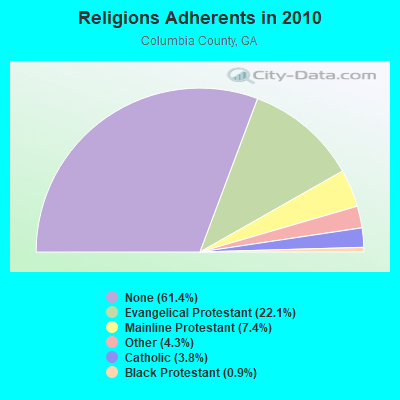
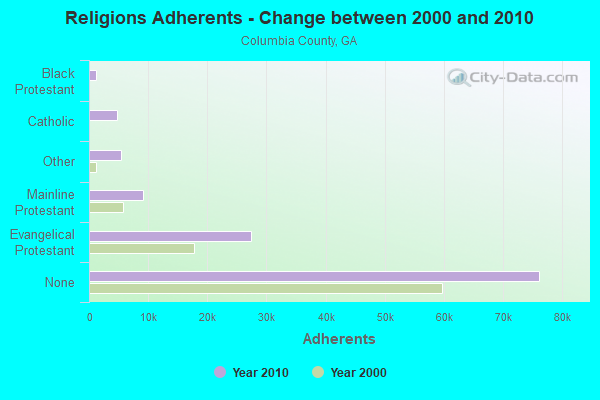
| Religion | Adherents | Congregations |
|---|---|---|
| Evangelical Protestant | 27,407 | 65 |
| Mainline Protestant | 9,211 | 17 |
| Other | 5,385 | 13 |
| Catholic | 4,666 | 1 |
| Black Protestant | 1,172 | 5 |
| Orthodox | 50 | 2 |
| None | 76,162 | - |
Food Environment Statistics:
| Columbia County: | 1.20 / 10,000 pop. |
| State: | 1.91 / 10,000 pop. |
| This county: | 0.09 / 10,000 pop. |
| Georgia: | 0.15 / 10,000 pop. |
| Here: | 0.28 / 10,000 pop. |
| Georgia: | 0.86 / 10,000 pop. |
| Columbia County: | 3.13 / 10,000 pop. |
| Georgia: | 5.12 / 10,000 pop. |
| This county: | 6.34 / 10,000 pop. |
| Georgia: | 7.41 / 10,000 pop. |
| Columbia County: | 9.5% |
| State: | 10.4% |
| Columbia County: | 26.7% |
| Georgia: | 27.8% |
| This county: | 10.2% |
| Georgia: | 14.6% |
Health and Nutrition:
| Harlem: | 45.9% |
| Georgia: | 48.9% |
| Here: | 41.9% |
| State: | 46.5% |
| Harlem: | 29.5 |
| Georgia: | 28.9 |
| Here: | 24.8% |
| State: | 20.4% |
| This city: | 12.1% |
| Georgia: | 10.8% |
| Here: | 6.8 |
| State: | 6.7 |
| Harlem: | 35.2% |
| Georgia: | 33.5% |
| This city: | 52.2% |
| Georgia: | 56.2% |
| Harlem: | 78.3% |
| State: | 80.8% |
More about Health and Nutrition of Harlem, GA Residents
| Local government employment and payroll (March 2022) | |||||
| Function | Full-time employees | Monthly full-time payroll | Average yearly full-time wage | Part-time employees | Monthly part-time payroll |
|---|---|---|---|---|---|
| Other Government Administration | 8 | $18,530 | $27,795 | 0 | $0 |
| Police Protection - Officers | 6 | $24,966 | $49,932 | 1 | $204 |
| Solid Waste Management | 6 | $19,858 | $39,716 | 0 | $0 |
| Firefighters | 5 | $12,616 | $30,278 | 0 | $0 |
| Other and Unallocable | 2 | $9,360 | $56,160 | 0 | $0 |
| Financial Administration | 2 | $5,819 | $34,914 | 0 | $0 |
| Judicial and Legal | 1 | $5,314 | $63,768 | 0 | $0 |
| Streets and Highways | 1 | $5,817 | $69,804 | 0 | $0 |
| Parks and Recreation | 1 | $3,375 | $40,500 | 1 | $1,012 |
| Welfare | 0 | $0 | 1 | $765 | |
| Totals for Government | 32 | $105,655 | $39,621 | 3 | $1,981 |
Harlem government finances - Expenditure in 2021 (per resident):
- Current Operations - Water Utilities: $1,302,000 ($328.95)
Police Protection: $683,000 ($172.56)
Central Staff Services: $633,000 ($159.93)
Sewerage: $618,000 ($156.14)
Regular Highways: $403,000 ($101.82)
Solid Waste Management: $320,000 ($80.85)
General - Other: $292,000 ($73.77)
Local Fire Protection: $236,000 ($59.63)
Parks and Recreation: $129,000 ($32.59)
Judicial and Legal Services: $64,000 ($16.17)
Public Welfare - Other: $49,000 ($12.38)
- General - Interest on Debt: $92,000 ($23.24)
- Other Capital Outlay - Local Fire Protection: $173,000 ($43.71)
Police Protection: $48,000 ($12.13)
Public Welfare - Other: $8,000 ($2.02)
Parks and Recreation: $7,000 ($1.77)
- Water Utilities - Interest on Debt: $15,000 ($3.79)
Harlem government finances - Revenue in 2021 (per resident):
- Charges - Sewerage: $1,157,000 ($292.32)
Parks and Recreation: $26,000 ($6.57)
Other: $8,000 ($2.02)
- Federal Intergovernmental - Public Welfare: $177,000 ($44.72)
- Local Intergovernmental - General Local Government Support: $825,000 ($208.44)
Other: $516,000 ($130.37)
- Miscellaneous - General Revenue - Other: $529,000 ($133.65)
Fines and Forfeits: $63,000 ($15.92)
Rents: $18,000 ($4.55)
Donations From Private Sources: $11,000 ($2.78)
Interest Earnings: $10,000 ($2.53)
- Revenue - Water Utilities: $793,000 ($200.35)
- State Intergovernmental - General Local Government Support: $9,000 ($2.27)
Other: $4,000 ($1.01)
- Tax - Property: $913,000 ($230.67)
Insurance Premiums Sales: $213,000 ($53.82)
Public Utilities Sales: $150,000 ($37.90)
Other License: $112,000 ($28.30)
Alcoholic Beverage Sales: $59,000 ($14.91)
Occupation and Business License - Other: $28,000 ($7.07)
Alcoholic Beverage License: $10,000 ($2.53)
Other: $3,000 ($0.76)
Other Selective Sales: $1,000 ($0.25)
Harlem government finances - Debt in 2021 (per resident):
- Long Term Debt - Beginning Outstanding - Unspecified Public Purpose: $3,321,000 ($839.06)
Outstanding Unspecified Public Purpose: $3,106,000 ($784.74)
Retired Unspecified Public Purpose: $371,000 ($93.73)
Issue, Unspecified Public Purpose: $156,000 ($39.41)
Harlem government finances - Cash and Securities in 2021 (per resident):
- Other Funds - Cash and Securities: $4,838,000 ($1222.33)
11.22% of this county's 2021 resident taxpayers lived in other counties in 2020 ($64,237 average adjusted gross income)
| Here: | 11.22% |
| Georgia average: | 10.21% |
0.27% of residents moved from foreign countries ($1,816 average AGI)
Columbia County: 0.27% Georgia average: 0.04%
Top counties from which taxpayers relocated into this county between 2020 and 2021:
| from Richmond County, GA | |
| from Aiken County, SC | |
| from McDuffie County, GA |
9.91% of this county's 2020 resident taxpayers moved to other counties in 2021 ($69,202 average adjusted gross income)
| Here: | 9.91% |
| Georgia average: | 9.60% |
0.19% of residents moved to foreign countries ($1,602 average AGI)
Columbia County: 0.19% Georgia average: 0.03%
Top counties to which taxpayers relocated from this county between 2020 and 2021:
| to Richmond County, GA | |
| to Aiken County, SC | |
| to McDuffie County, GA |
Businesses in Harlem, GA
- H&R Block: 1
Strongest AM radio stations in Harlem:
- WGAC (580 AM; 5 kW; AUGUSTA, GA; Owner: WGAC LICENSE, LLC)
- WRDW (1480 AM; 10 kW; AUGUSTA, GA; Owner: WCHZ LICENSE, LLC)
- WTEL (1630 AM; 10 kW; AUGUSTA, GA; Owner: WCHZ LICENSE, LLC)
- WFAM (1050 AM; 5 kW; AUGUSTA, GA; Owner: J.J. & B. BROADCASTING, INC.)
- WBAJ (890 AM; daytime; 50 kW; BLYTHEWOOD, SC; Owner: FAMILY FIRST)
- WLFJ (660 AM; daytime; 50 kW; GREENVILLE, SC; Owner: CLEAR CHANNEL BROADCASTING LICENSES, INC.)
- WMAC (940 AM; 50 kW; MACON, GA; Owner: CUMULUS LICENSING CORP.)
- WTHB (1550 AM; 5 kW; AUGUSTA, GA)
- WPCH (1380 AM; 4 kW; NORTH AUGUSTA, SC; Owner: CAPSTAR TX LIMITED PARTNERSHIP)
- WCEO (840 AM; daytime; 50 kW; COLUMBIA, SC; Owner: EASTERN BROADCASTING GROUP, INC.)
- WTWA (1240 AM; 1 kW; THOMSON, GA; Owner: CAMELLIA CITY COMMUNICATIONS, INC.)
- WCNN (680 AM; 50 kW; NORTH ATLANTA, GA; Owner: DICKEY BROADCASTING COMPANY)
- WSB (750 AM; 50 kW; ATLANTA, GA; Owner: CXR HOLDINGS, INC.)
Strongest FM radio stations in Harlem:
- WAKB (96.9 FM; WRENS, GA; Owner: RADIO ONE OF AUGUSTA, LLC)
- WCHZ (95.1 FM; HARLEM, GA; Owner: WCHZ LICENSE,LLC)
- WAFJ (88.3 FM; BELVEDERE, SC; Owner: RADIO TRAINING NETWORK, INC.)
- WGOR (93.9 FM; MARTINEZ, GA; Owner: WGOR LICENSE, LLC)
- WPRW-FM (107.7 FM; MARTINEZ, GA; Owner: CAPSTAR TX LIMITED PARTNERSHIP)
- WZNY (105.7 FM; AUGUSTA, GA; Owner: CAPSTAR TX LIMITED PARTNERSHIP)
- WBBQ-FM (104.3 FM; AUGUSTA, GA; Owner: CAPSTAR TX LIMITED PARTNERSHIP)
- WTHO-FM (101.7 FM; THOMSON, GA; Owner: CAMELLIA CITY COMMUNICATIONS, INC.)
- WEKL (102.3 FM; AUGUSTA, GA; Owner: CAPSTAR TX LIMITED PARTNERSHIP)
- WAEG (92.3 FM; EVANS, GA; Owner: RADIO ONE OF AUGUSTA, LLC)
- WKSP (96.3 FM; AIKEN, SC; Owner: CAPSTAR TX LIMITED PARTNERSHIP)
- WKXC-FM (99.5 FM; AIKEN, SC; Owner: WGAC LICENSE, LLC)
- WRFN (93.1 FM; WARRENTON, GA; Owner: WCHZ LICENSE, LLC)
- WLPE (91.7 FM; AUGUSTA, GA; Owner: AUGUSTA RADIO FELLOWSHIP INSTITUTE, INC.)
- WSLT (98.3 FM; CLEARWATER, SC; Owner: WGAC LICENSE, LLC)
- WTHB-FM (100.9 FM; WAYNESBORO, GA; Owner: RADIO ONE OF AUGUSTA, LLC)
- WACG-FM (90.7 FM; AUGUSTA, GA; Owner: GEORGIA PUBLIC TELECOMMUNICATIONS COMMISSION)
- WFXA-FM (103.1 FM; AUGUSTA, GA; Owner: RADIO ONE OF AUGUSTA, LLC)
- WYFA (107.1 FM; WAYNESBORO, GA; Owner: BIBLE BROADCASTING NETWORK, INC.)
TV broadcast stations around Harlem:
- WCES-TV (Channel 20; WRENS, GA; Owner: GEORGIA PUBLIC TELECOMMUNICATIONS COMMISSION)
- WJBF (Channel 6; AUGUSTA, GA; Owner: MEDIA GENERAL BROADCASTING OF SO. CAROLINA HOLDINGS, INC.)
- WAGT (Channel 26; AUGUSTA, GA; Owner: WAGT TELEVISION, INC.)
- WRDW-TV (Channel 12; AUGUSTA, GA; Owner: WRDW LICENSEE CORP.)
- WAAU-LP (Channel 18; AUGUSTA, GA; Owner: THOMAS J. PIPER)
- WFXG (Channel 54; AUGUSTA, GA; Owner: FISHER BROADCASTING - GEORGIA, L.L.C.)
- WBPI-LP (Channel 49; AUGUSTA, GA; Owner: WATCHMAN BROADCASTING PRODUCTIONS INTERNATIONAL, INC.)
- W58CZ (Channel 58; AUGUSTA, GA; Owner: TRINITY BROADCASTING NETWORK)
- W56EE (Channel 56; JOHNSTON, SC; Owner: DOVE BROADCASTING, INC.)
- Harlem, Georgia
- Fatal accident count12
- Vehicles involved in fatal accidents17
- Fatal accidents involving drunk persons:4
- Fatalities12
- Persons involved in fatal accidents28
- Pedestrians involved in fatal accidents0
- Georgia average
- Fatal accident count13735
- Vehicles involved in fatal accidents21103
- Fatal accidents involving drunk persons3442
- Fatalities15316
- Persons involved in fatal accidents35625
- Pedestrians involved in fatal accidents1668
- National Bridge Inventory (NBI) Statistics
- 2Number of bridges
- 7ft / 1.8mTotal length
- $346,000Total costs
- 4,100Total average daily traffic
- 40Total average daily truck traffic
- 6,150Total future (year 2032) average daily traffic
FCC Registered Antenna Towers:
95 (See the full list of FCC Registered Antenna Towers in Harlem)FCC Registered Broadcast Land Mobile Towers:
2- 5887 Wrightsboro Rd (Lat: 33.475500 Lon: -82.265333), Type: Tower, Structure height: 30.4 m, Overall height: 33.5 m, Call Sign: KIJ810,
Assigned Frequencies: 151.145 MHz, 159.360 MHz, 159.390 MHz, 159.285 MHz, 158.925 MHz, 154.280 MHz, 159.277 MHz, 151.280 MHz, 151.100 MHz, 151.115 MHz, Grant Date: 11/29/2022, Expiration Date: 12/21/2032, Registrant: Gta Gfc Columbia Unit, 5645 Riggins Mill Rd, Dry Branch, GA 31020, Phone: (478) 751-3494, Email:
- 701 Sawdust Road (Lat: 33.419750 Lon: -82.330583), Type: Tank, Structure height: 38.4 m, Overall height: 42.9 m, Call Sign: WRPX330,
Assigned Frequencies: 9200.00 MHz, Grant Date: 03/30/2022, Expiration Date: 03/30/2032, Certifier: Tara Goode, Registrant: Climavision Operating, LLC, 552 E. Market Street, Louisville, KY 40202, Phone: (859) 473-4433, Email:
FCC Registered Microwave Towers:
3- AUGGA0013, 5886 Old Augusta Road (Lat: 33.405222 Lon: -82.257972), Type: Ltower, Structure height: 76.2 m, Overall height: 80.7 m, Call Sign: WQNJ503,
Assigned Frequencies: 11015.0 MHz, 11015.0 MHz, Grant Date: 02/23/2011, Expiration Date: 02/23/2021, Cancellation Date: 05/01/2021, Certifier: Jeffrey R Strenkowski, Registrant: Southern Light, LLC, 107 St. Francis Street, Suite 1800, Mobile, AL 36602, Phone: (877) 652-2321, Email:
- AUGGA0036, 6211 Old Wrightsboro Rd (Lat: 33.484722 Lon: -82.303333), Type: Gtower, Structure height: 76.2 m, Overall height: 80.7 m, Call Sign: WQNJ509,
Assigned Frequencies: 11345.0 MHz, Grant Date: 02/23/2011, Expiration Date: 02/23/2021, Cancellation Date: 04/11/2017, Certifier: Patricia Morrison, Registrant: Radyn, Inc, Silver Spring, MD 20914, Phone: (301) 493-5171, Fax: (301) 576-4553
- HARLEM, 5886 Old Augusta Road (303249 / Campania) (Lat: 33.405056 Lon: -82.258222), Type: Ltower, Structure height: 76.2 m, Overall height: 81.7 m, Call Sign: WQZB500,
Assigned Frequencies: 10775.0 MHz, 10815.0 MHz, 11135.0 MHz, 11175.0 MHz, 10775.0 MHz, 10815.0 MHz, 11135.0 MHz, 11175.0 MHz, 10775.0 MHz, 10815.0 MHz... (+22 more), Grant Date: 03/28/2017, Expiration Date: 03/28/2027, Certifier: Larry F Butts, Registrant: Southern Company Services, 600 N. 18th St / Bin 5n-5409, Birmingham, AL 35203, Phone: (205) 257-7600, Fax: (205) 257-2134, Email:
FCC Registered Paging Towers:
1- Int Ga 47 & Ga 275 (Lat: 33.396528 Lon: -82.312056), Overall height: 83.8 m, Call Sign: KNKG715,
Assigned Frequencies: 931.087 MHz, Grant Date: 04/27/1999, Expiration Date: 04/01/2009, Cancellation Date: 05/23/2009, Registrant: Dettra Communications, Inc., Washington, DC 20036-8864, Phone: (202) 965-4664
FCC Registered Amateur Radio Licenses:
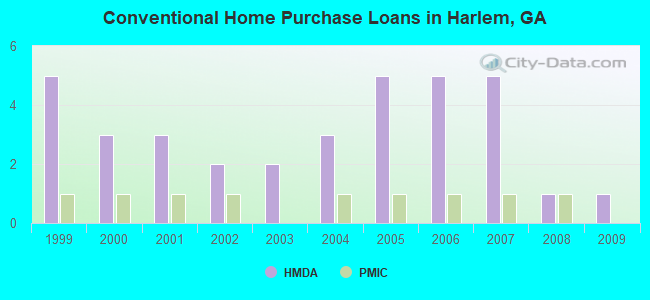
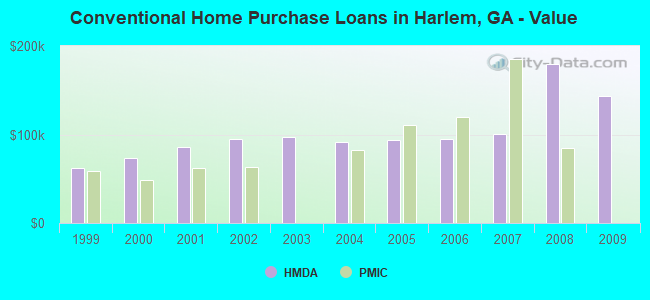
40 (See the full list of FCC Registered Amateur Radio Licenses in Harlem)| Home Mortgage Disclosure Act Aggregated Statistics For Year 2009 (Based on 1 partial tract) | ||||||||||
| A) FHA, FSA/RHS & VA Home Purchase Loans | B) Conventional Home Purchase Loans | C) Refinancings | D) Home Improvement Loans | G) Loans On Manufactured Home Dwelling (A B C & D) | ||||||
|---|---|---|---|---|---|---|---|---|---|---|
| Number | Average Value | Number | Average Value | Number | Average Value | Number | Average Value | Number | Average Value | |
| LOANS ORIGINATED | 5 | $158,424 | 1 | $143,940 | 7 | $133,630 | 1 | $34,260 | 1 | $94,390 |
| APPLICATIONS APPROVED, NOT ACCEPTED | 0 | $0 | 0 | $0 | 1 | $78,490 | 0 | $0 | 0 | $0 |
| APPLICATIONS DENIED | 1 | $57,630 | 0 | $0 | 3 | $108,000 | 1 | $9,720 | 1 | $81,390 |
| APPLICATIONS WITHDRAWN | 0 | $0 | 0 | $0 | 2 | $164,460 | 0 | $0 | 0 | $0 |
| FILES CLOSED FOR INCOMPLETENESS | 0 | $0 | 0 | $0 | 1 | $75,730 | 0 | $0 | 0 | $0 |
Detailed HMDA statistics for the following Tracts: 0305.01
| Private Mortgage Insurance Companies Aggregated Statistics For Year 2008 (Based on 1 partial tract) | ||
| A) Conventional Home Purchase Loans | ||
|---|---|---|
| Number | Average Value | |
| LOANS ORIGINATED | 1 | $84,630 |
| APPLICATIONS APPROVED, NOT ACCEPTED | 0 | $0 |
| APPLICATIONS DENIED | 0 | $0 |
| APPLICATIONS WITHDRAWN | 0 | $0 |
| FILES CLOSED FOR INCOMPLETENESS | 0 | $0 |
Detailed PMIC statistics for the following Tracts: 0305.01
2002 - 2018 National Fire Incident Reporting System (NFIRS) incidents
- Fire incident types reported to NFIRS in Harlem, GA
- 21756.8%Outside Fires
- 10226.7%Structure Fires
- 4812.6%Mobile Property/Vehicle Fires
- 153.9%Other
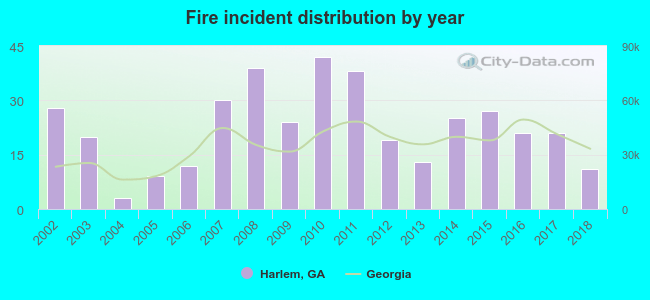 Based on the data from the years 2002 - 2018 the average number of fire incidents per year is 22. The highest number of reported fire incidents - 42 took place in 2010, and the least - 3 in 2004. The data has a dropping trend.
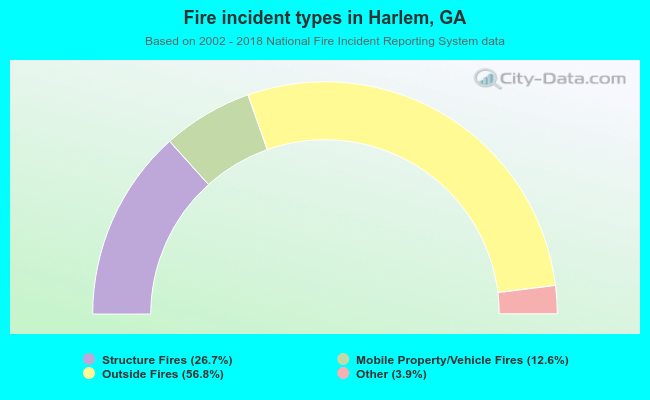 When looking into fire subcategories, the most incidents belonged to: Outside Fires (56.8%), and Structure Fires (26.7%).
| Most common first names in Harlem, GA among deceased individuals | ||
| Name | Count | Lived (average) |
|---|---|---|
| Mary | 57 | 74.5 years |
| John | 50 | 69.5 years |
| James | 47 | 68.9 years |
| William | 35 | 69.7 years |
| Willie | 29 | 71.2 years |
| George | 25 | 72.7 years |
| Robert | 24 | 62.7 years |
| Charles | 18 | 67.8 years |
| Henry | 14 | 67.3 years |
| Ruth | 14 | 79.9 years |
| Most common last names in Harlem, GA among deceased individuals | ||
| Last name | Count | Lived (average) |
|---|---|---|
| Johnson | 30 | 72.8 years |
| Whitaker | 29 | 74.2 years |
| Moore | 22 | 77.9 years |
| Smith | 22 | 72.9 years |
| Jones | 22 | 73.5 years |
| Williams | 22 | 72.1 years |
| Brown | 19 | 73.3 years |
| Dorsey | 14 | 77.6 years |
| Morris | 13 | 69.6 years |
| Lee | 12 | 72.9 years |
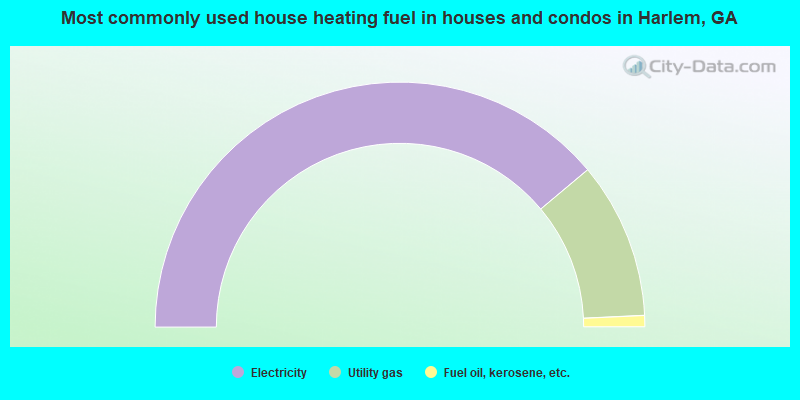
- 77.8%Electricity
- 20.7%Utility gas
- 1.5%Fuel oil, kerosene, etc.
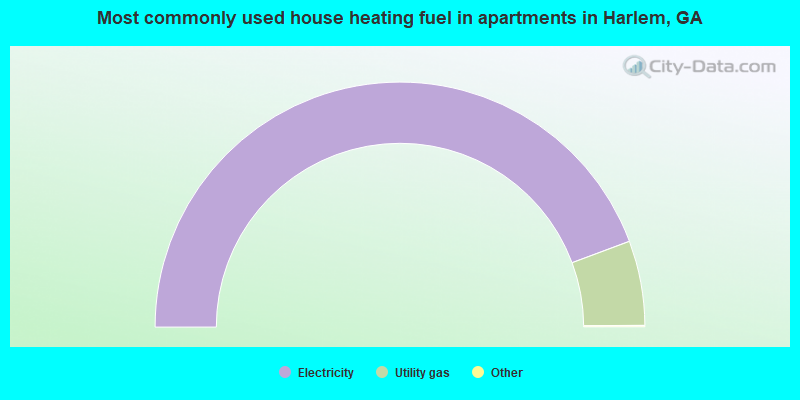
- 88.8%Electricity
- 11.2%Utility gas
Harlem compared to Georgia state average:
- Unemployed percentage significantly below state average.
- Black race population percentage above state average.
- Hispanic race population percentage below state average.
- Median age below state average.
- Foreign-born population percentage significantly below state average.
- Number of college students above state average.

|
Total of 4 patent applications in 2008-2024.