Holland, Ohio Submit your own pictures of this village and show them to the world
OSM Map
General Map
Google Map
MSN Map
OSM Map
General Map
Google Map
MSN Map
OSM Map
General Map
Google Map
MSN Map
OSM Map
General Map
Google Map
MSN Map
Please wait while loading the map...
Population in 2022: 1,800 (100% urban, 0% rural). Population change since 2000: +37.8%Males: 824 Females: 976
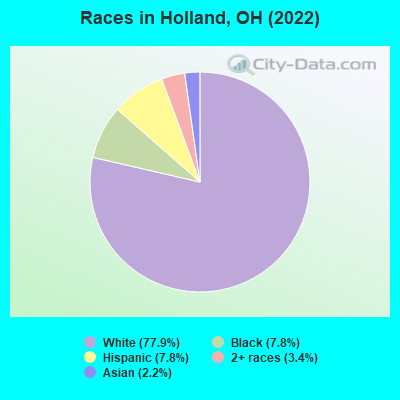
March 2022 cost of living index in Holland: 91.8 (less than average, U.S. average is 100) Percentage of residents living in poverty in 2022: 7.7%for White Non-Hispanic residents , 20.0% for Black residents , 3.4% for Hispanic or Latino residents , 27.6% for two or more races residents )
Profiles of local businesses
Business Search - 14 Million verified businesses
Data:
Median household income ($)
Median household income (% change since 2000)
Household income diversity
Ratio of average income to average house value (%)
Ratio of average income to average rent
Median household income ($) - White
Median household income ($) - Black or African American
Median household income ($) - Asian
Median household income ($) - Hispanic or Latino
Median household income ($) - American Indian and Alaska Native
Median household income ($) - Multirace
Median household income ($) - Other Race
Median household income for houses/condos with a mortgage ($)
Median household income for apartments without a mortgage ($)
Races - White alone (%)
Races - White alone (% change since 2000)
Races - Black alone (%)
Races - Black alone (% change since 2000)
Races - American Indian alone (%)
Races - American Indian alone (% change since 2000)
Races - Asian alone (%)
Races - Asian alone (% change since 2000)
Races - Hispanic (%)
Races - Hispanic (% change since 2000)
Races - Native Hawaiian and Other Pacific Islander alone (%)
Races - Native Hawaiian and Other Pacific Islander alone (% change since 2000)
Races - Two or more races (%)
Races - Two or more races (% change since 2000)
Races - Other race alone (%)
Races - Other race alone (% change since 2000)
Racial diversity
Unemployment (%)
Unemployment (% change since 2000)
Unemployment (%) - White
Unemployment (%) - Black or African American
Unemployment (%) - Asian
Unemployment (%) - Hispanic or Latino
Unemployment (%) - American Indian and Alaska Native
Unemployment (%) - Multirace
Unemployment (%) - Other Race
Population density (people per square mile)
Population - Males (%)
Population - Females (%)
Population - Males (%) - White
Population - Males (%) - Black or African American
Population - Males (%) - Asian
Population - Males (%) - Hispanic or Latino
Population - Males (%) - American Indian and Alaska Native
Population - Males (%) - Multirace
Population - Males (%) - Other Race
Population - Females (%) - White
Population - Females (%) - Black or African American
Population - Females (%) - Asian
Population - Females (%) - Hispanic or Latino
Population - Females (%) - American Indian and Alaska Native
Population - Females (%) - Multirace
Population - Females (%) - Other Race
Coronavirus confirmed cases (Apr 25, 2024)
Deaths caused by coronavirus (Apr 25, 2024)
Coronavirus confirmed cases (per 100k population) (Apr 25, 2024)
Deaths caused by coronavirus (per 100k population) (Apr 25, 2024)
Daily increase in number of cases (Apr 25, 2024)
Weekly increase in number of cases (Apr 25, 2024)
Cases doubled (in days) (Apr 25, 2024)
Hospitalized patients (Apr 18, 2022)
Negative test results (Apr 18, 2022)
Total test results (Apr 18, 2022)
COVID Vaccine doses distributed (per 100k population) (Sep 19, 2023)
COVID Vaccine doses administered (per 100k population) (Sep 19, 2023)
COVID Vaccine doses distributed (Sep 19, 2023)
COVID Vaccine doses administered (Sep 19, 2023)
Likely homosexual households (%)
Likely homosexual households (% change since 2000)
Likely homosexual households - Lesbian couples (%)
Likely homosexual households - Lesbian couples (% change since 2000)
Likely homosexual households - Gay men (%)
Likely homosexual households - Gay men (% change since 2000)
Cost of living index
Median gross rent ($)
Median contract rent ($)
Median monthly housing costs ($)
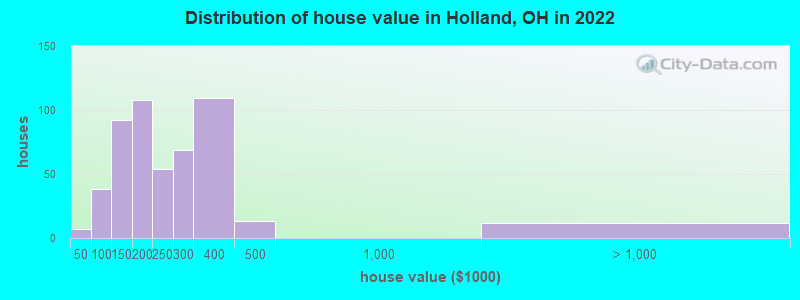
Median house or condo value ($)
Median house or condo value ($ change since 2000)
Mean house or condo value by units in structure - 1, detached ($)
Mean house or condo value by units in structure - 1, attached ($)
Mean house or condo value by units in structure - 2 ($)
Mean house or condo value by units in structure by units in structure - 3 or 4 ($)
Mean house or condo value by units in structure - 5 or more ($)
Mean house or condo value by units in structure - Boat, RV, van, etc. ($)
Mean house or condo value by units in structure - Mobile home ($)
Median house or condo value ($) - White
Median house or condo value ($) - Black or African American
Median house or condo value ($) - Asian
Median house or condo value ($) - Hispanic or Latino
Median house or condo value ($) - American Indian and Alaska Native
Median house or condo value ($) - Multirace
Median house or condo value ($) - Other Race
Median resident age
Resident age diversity
Median resident age - Males
Median resident age - Females
Median resident age - White
Median resident age - Black or African American
Median resident age - Asian
Median resident age - Hispanic or Latino
Median resident age - American Indian and Alaska Native
Median resident age - Multirace
Median resident age - Other Race
Median resident age - Males - White
Median resident age - Males - Black or African American
Median resident age - Males - Asian
Median resident age - Males - Hispanic or Latino
Median resident age - Males - American Indian and Alaska Native
Median resident age - Males - Multirace
Median resident age - Males - Other Race
Median resident age - Females - White
Median resident age - Females - Black or African American
Median resident age - Females - Asian
Median resident age - Females - Hispanic or Latino
Median resident age - Females - American Indian and Alaska Native
Median resident age - Females - Multirace
Median resident age - Females - Other Race
Commute - mean travel time to work (minutes)
Travel time to work - Less than 5 minutes (%)
Travel time to work - Less than 5 minutes (% change since 2000)
Travel time to work - 5 to 9 minutes (%)
Travel time to work - 5 to 9 minutes (% change since 2000)
Travel time to work - 10 to 19 minutes (%)
Travel time to work - 10 to 19 minutes (% change since 2000)
Travel time to work - 20 to 29 minutes (%)
Travel time to work - 20 to 29 minutes (% change since 2000)
Travel time to work - 30 to 39 minutes (%)
Travel time to work - 30 to 39 minutes (% change since 2000)
Travel time to work - 40 to 59 minutes (%)
Travel time to work - 40 to 59 minutes (% change since 2000)
Travel time to work - 60 to 89 minutes (%)
Travel time to work - 60 to 89 minutes (% change since 2000)
Travel time to work - 90 or more minutes (%)
Travel time to work - 90 or more minutes (% change since 2000)
Marital status - Never married (%)
Marital status - Now married (%)
Marital status - Separated (%)
Marital status - Widowed (%)
Marital status - Divorced (%)
Median family income ($)
Median family income (% change since 2000)
Median non-family income ($)
Median non-family income (% change since 2000)
Median per capita income ($)
Median per capita income (% change since 2000)
Median family income ($) - White
Median family income ($) - Black or African American
Median family income ($) - Asian
Median family income ($) - Hispanic or Latino
Median family income ($) - American Indian and Alaska Native
Median family income ($) - Multirace
Median family income ($) - Other Race
Median year house/condo built
Median year apartment built
Year house built - Built 2005 or later (%)
Year house built - Built 2000 to 2004 (%)
Year house built - Built 1990 to 1999 (%)
Year house built - Built 1980 to 1989 (%)
Year house built - Built 1970 to 1979 (%)
Year house built - Built 1960 to 1969 (%)
Year house built - Built 1950 to 1959 (%)
Year house built - Built 1940 to 1949 (%)
Year house built - Built 1939 or earlier (%)
Average household size
Household density (households per square mile)
Average household size - White
Average household size - Black or African American
Average household size - Asian
Average household size - Hispanic or Latino
Average household size - American Indian and Alaska Native
Average household size - Multirace
Average household size - Other Race
Occupied housing units (%)
Vacant housing units (%)
Owner occupied housing units (%)
Renter occupied housing units (%)
Vacancy status - For rent (%)
Vacancy status - For sale only (%)
Vacancy status - Rented or sold, not occupied (%)
Vacancy status - For seasonal, recreational, or occasional use (%)
Vacancy status - For migrant workers (%)
Vacancy status - Other vacant (%)
Residents with income below the poverty level (%)
Residents with income below 50% of the poverty level (%)
Children below poverty level (%)
Poor families by family type - Married-couple family (%)
Poor families by family type - Male, no wife present (%)
Poor families by family type - Female, no husband present (%)
Poverty status for native-born residents (%)
Poverty status for foreign-born residents (%)
Poverty among high school graduates not in families (%)
Poverty among people who did not graduate high school not in families (%)
Residents with income below the poverty level (%) - White
Residents with income below the poverty level (%) - Black or African American
Residents with income below the poverty level (%) - Asian
Residents with income below the poverty level (%) - Hispanic or Latino
Residents with income below the poverty level (%) - American Indian and Alaska Native
Residents with income below the poverty level (%) - Multirace
Residents with income below the poverty level (%) - Other Race
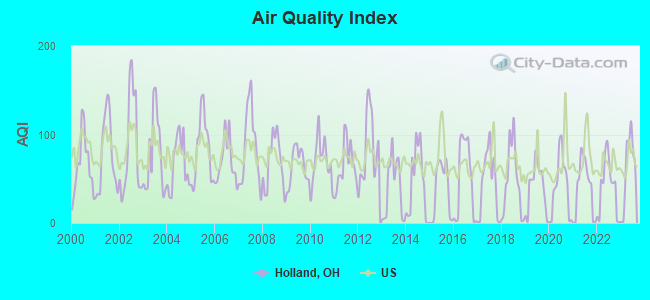
Air pollution - Air Quality Index (AQI)
Air pollution - CO
Air pollution - NO2
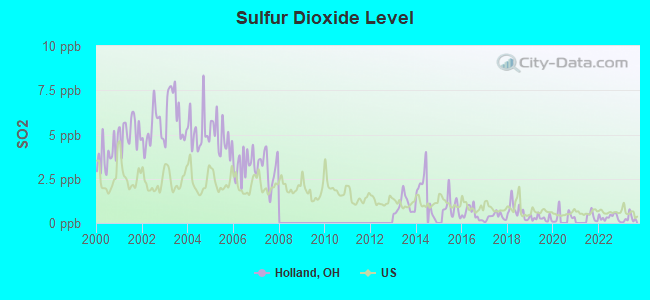
Air pollution - SO2
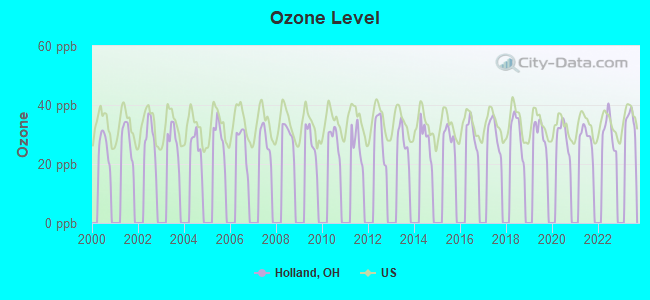
Air pollution - Ozone
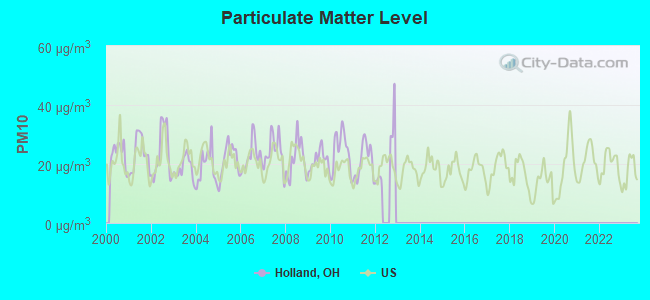
Air pollution - PM10
Air pollution - PM25
Air pollution - Pb
Crime - Murders per 100,000 population
Crime - Rapes per 100,000 population
Crime - Robberies per 100,000 population
Crime - Assaults per 100,000 population
Crime - Burglaries per 100,000 population
Crime - Thefts per 100,000 population
Crime - Auto thefts per 100,000 population
Crime - Arson per 100,000 population
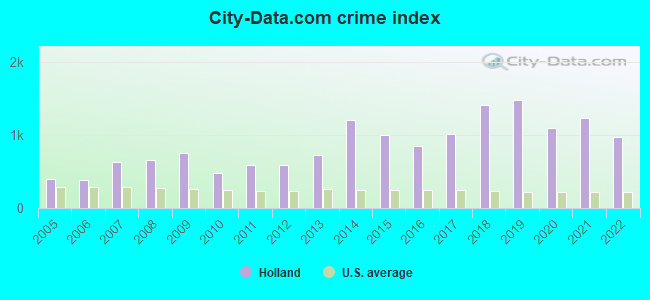
Crime - City-data.com crime index
Crime - Violent crime index
Crime - Property crime index
Crime - Murders per 100,000 population (5 year average)
Crime - Rapes per 100,000 population (5 year average)
Crime - Robberies per 100,000 population (5 year average)
Crime - Assaults per 100,000 population (5 year average)
Crime - Burglaries per 100,000 population (5 year average)
Crime - Thefts per 100,000 population (5 year average)
Crime - Auto thefts per 100,000 population (5 year average)
Crime - Arson per 100,000 population (5 year average)
Crime - City-data.com crime index (5 year average)
Crime - Violent crime index (5 year average)
Crime - Property crime index (5 year average)
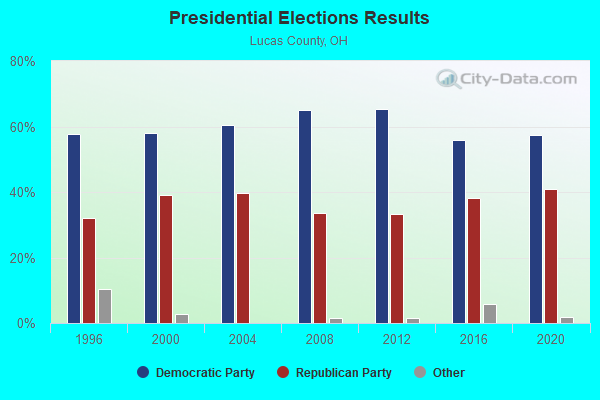
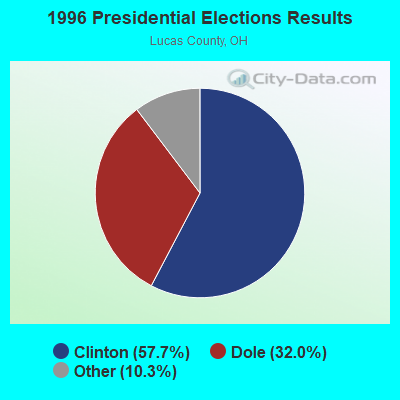
1996 Presidential Elections Results (%) - Democratic Party (Clinton)
1996 Presidential Elections Results (%) - Republican Party (Dole)
1996 Presidential Elections Results (%) - Other
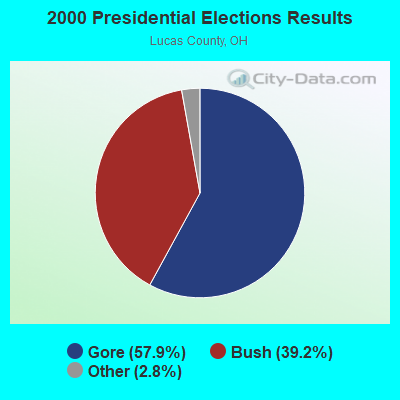
2000 Presidential Elections Results (%) - Democratic Party (Gore)
2000 Presidential Elections Results (%) - Republican Party (Bush)
2000 Presidential Elections Results (%) - Other
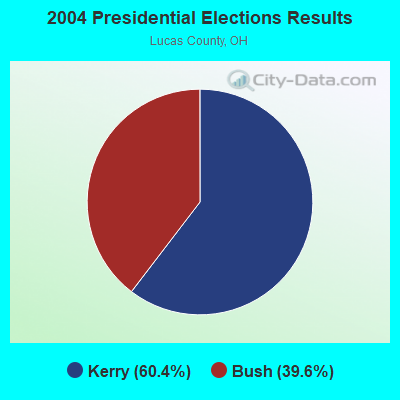
2004 Presidential Elections Results (%) - Democratic Party (Kerry)
2004 Presidential Elections Results (%) - Republican Party (Bush)
2004 Presidential Elections Results (%) - Other
2008 Presidential Elections Results (%) - Democratic Party (Obama)
2008 Presidential Elections Results (%) - Republican Party (McCain)
2008 Presidential Elections Results (%) - Other
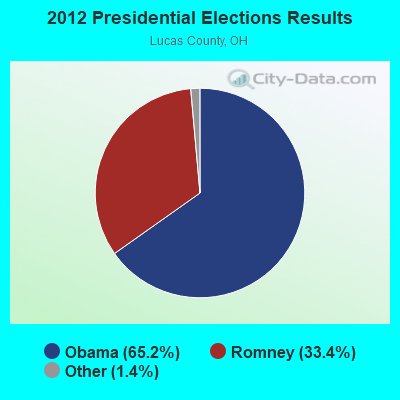
2012 Presidential Elections Results (%) - Democratic Party (Obama)
2012 Presidential Elections Results (%) - Republican Party (Romney)
2012 Presidential Elections Results (%) - Other
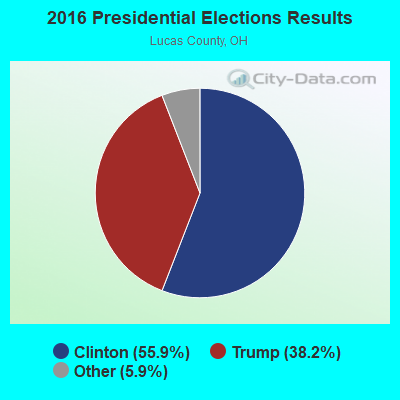
2016 Presidential Elections Results (%) - Democratic Party (Clinton)
2016 Presidential Elections Results (%) - Republican Party (Trump)
2016 Presidential Elections Results (%) - Other
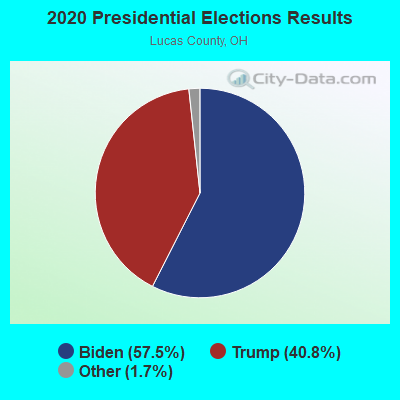
2020 Presidential Elections Results (%) - Democratic Party (Biden)
2020 Presidential Elections Results (%) - Republican Party (Trump)
2020 Presidential Elections Results (%) - Other
Ancestries Reported - Arab (%)
Ancestries Reported - Czech (%)
Ancestries Reported - Danish (%)
Ancestries Reported - Dutch (%)
Ancestries Reported - English (%)
Ancestries Reported - French (%)
Ancestries Reported - French Canadian (%)
Ancestries Reported - German (%)
Ancestries Reported - Greek (%)
Ancestries Reported - Hungarian (%)
Ancestries Reported - Irish (%)
Ancestries Reported - Italian (%)
Ancestries Reported - Lithuanian (%)
Ancestries Reported - Norwegian (%)
Ancestries Reported - Polish (%)
Ancestries Reported - Portuguese (%)
Ancestries Reported - Russian (%)
Ancestries Reported - Scotch-Irish (%)
Ancestries Reported - Scottish (%)
Ancestries Reported - Slovak (%)
Ancestries Reported - Subsaharan African (%)
Ancestries Reported - Swedish (%)
Ancestries Reported - Swiss (%)
Ancestries Reported - Ukrainian (%)
Ancestries Reported - United States (%)
Ancestries Reported - Welsh (%)
Ancestries Reported - West Indian (%)
Ancestries Reported - Other (%)
Educational Attainment - No schooling completed (%)
Educational Attainment - Less than high school (%)
Educational Attainment - High school or equivalent (%)
Educational Attainment - Less than 1 year of college (%)
Educational Attainment - 1 or more years of college (%)
Educational Attainment - Associate degree (%)
Educational Attainment - Bachelor's degree (%)
Educational Attainment - Master's degree (%)
Educational Attainment - Professional school degree (%)
Educational Attainment - Doctorate degree (%)
School Enrollment - Nursery, preschool (%)
School Enrollment - Kindergarten (%)
School Enrollment - Grade 1 to 4 (%)
School Enrollment - Grade 5 to 8 (%)
School Enrollment - Grade 9 to 12 (%)
School Enrollment - College undergrad (%)
School Enrollment - Graduate or professional (%)
School Enrollment - Not enrolled in school (%)
School enrollment - Public schools (%)
School enrollment - Private schools (%)
School enrollment - Not enrolled (%)
Median number of rooms in houses and condos
Median number of rooms in apartments
Housing units lacking complete plumbing facilities (%)
Housing units lacking complete kitchen facilities (%)
Density of houses
Urban houses (%)
Rural houses (%)
Households with people 60 years and over (%)
Households with people 65 years and over (%)
Households with people 75 years and over (%)
Households with one or more nonrelatives (%)
Households with no nonrelatives (%)
Population in households (%)
Family households (%)
Nonfamily households (%)
Population in families (%)
Family households with own children (%)
Median number of bedrooms in owner occupied houses
Mean number of bedrooms in owner occupied houses
Median number of bedrooms in renter occupied houses
Mean number of bedrooms in renter occupied houses
Median number of vehichles in owner occupied houses
Mean number of vehichles in owner occupied houses
Median number of vehichles in renter occupied houses
Mean number of vehichles in renter occupied houses
Mortgage status - with mortgage (%)
Mortgage status - with second mortgage (%)
Mortgage status - with home equity loan (%)
Mortgage status - with both second mortgage and home equity loan (%)
Mortgage status - without a mortgage (%)
Average family size
Average family size - White
Average family size - Black or African American
Average family size - Asian
Average family size - Hispanic or Latino
Average family size - American Indian and Alaska Native
Average family size - Multirace
Average family size - Other Race
Geographical mobility - Same house 1 year ago (%)
Geographical mobility - Moved within same county (%)
Geographical mobility - Moved from different county within same state (%)
Geographical mobility - Moved from different state (%)
Geographical mobility - Moved from abroad (%)
Place of birth - Born in state of residence (%)
Place of birth - Born in other state (%)
Place of birth - Native, outside of US (%)
Place of birth - Foreign born (%)
Housing units in structures - 1, detached (%)
Housing units in structures - 1, attached (%)
Housing units in structures - 2 (%)
Housing units in structures - 3 or 4 (%)
Housing units in structures - 5 to 9 (%)
Housing units in structures - 10 to 19 (%)
Housing units in structures - 20 to 49 (%)
Housing units in structures - 50 or more (%)
Housing units in structures - Mobile home (%)
Housing units in structures - Boat, RV, van, etc. (%)
House/condo owner moved in on average (years ago)
Renter moved in on average (years ago)
Year householder moved into unit - Moved in 1999 to March 2000 (%)
Year householder moved into unit - Moved in 1995 to 1998 (%)
Year householder moved into unit - Moved in 1990 to 1994 (%)
Year householder moved into unit - Moved in 1980 to 1989 (%)
Year householder moved into unit - Moved in 1970 to 1979 (%)
Year householder moved into unit - Moved in 1969 or earlier (%)
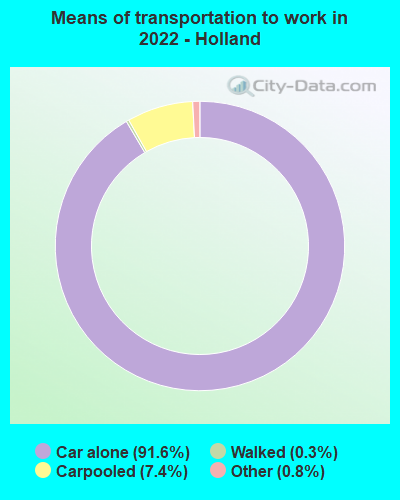
Means of transportation to work - Drove car alone (%)
Means of transportation to work - Carpooled (%)
Means of transportation to work - Public transportation (%)
Means of transportation to work - Bus or trolley bus (%)
Means of transportation to work - Streetcar or trolley car (%)
Means of transportation to work - Subway or elevated (%)
Means of transportation to work - Railroad (%)
Means of transportation to work - Ferryboat (%)
Means of transportation to work - Taxicab (%)
Means of transportation to work - Motorcycle (%)
Means of transportation to work - Bicycle (%)
Means of transportation to work - Walked (%)
Means of transportation to work - Other means (%)
Working at home (%)
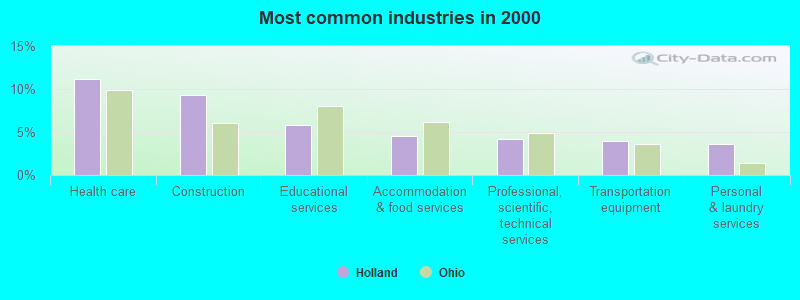
Industry diversity
Most Common Industries - Agriculture, forestry, fishing and hunting, and mining (%)
Most Common Industries - Agriculture, forestry, fishing and hunting (%)
Most Common Industries - Mining, quarrying, and oil and gas extraction (%)
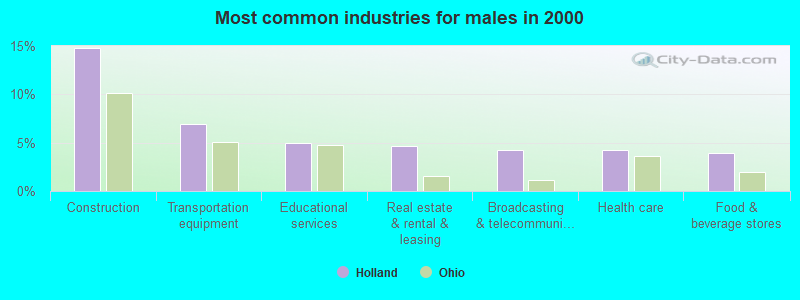
Most Common Industries - Construction (%)
Most Common Industries - Manufacturing (%)
Most Common Industries - Wholesale trade (%)
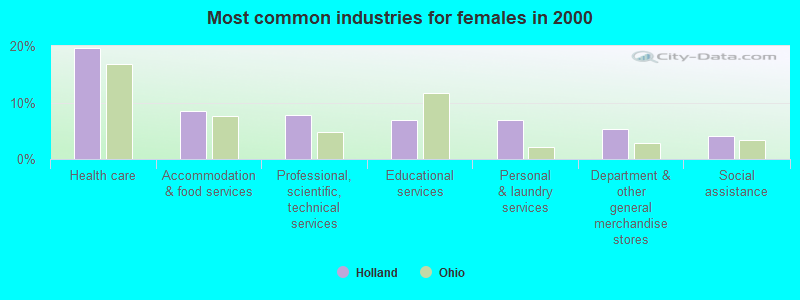
Most Common Industries - Retail trade (%)
Most Common Industries - Transportation and warehousing, and utilities (%)
Most Common Industries - Transportation and warehousing (%)
Most Common Industries - Utilities (%)
Most Common Industries - Information (%)
Most Common Industries - Finance and insurance, and real estate and rental and leasing (%)
Most Common Industries - Finance and insurance (%)
Most Common Industries - Real estate and rental and leasing (%)
Most Common Industries - Professional, scientific, and management, and administrative and waste management services (%)
Most Common Industries - Professional, scientific, and technical services (%)
Most Common Industries - Management of companies and enterprises (%)
Most Common Industries - Administrative and support and waste management services (%)
Most Common Industries - Educational services, and health care and social assistance (%)
Most Common Industries - Educational services (%)
Most Common Industries - Health care and social assistance (%)
Most Common Industries - Arts, entertainment, and recreation, and accommodation and food services (%)
Most Common Industries - Arts, entertainment, and recreation (%)
Most Common Industries - Accommodation and food services (%)
Most Common Industries - Other services, except public administration (%)
Most Common Industries - Public administration (%)
Occupation diversity
Most Common Occupations - Management, business, science, and arts occupations (%)
Most Common Occupations - Management, business, and financial occupations (%)
Most Common Occupations - Management occupations (%)
Most Common Occupations - Business and financial operations occupations (%)
Most Common Occupations - Computer, engineering, and science occupations (%)
Most Common Occupations - Computer and mathematical occupations (%)
Most Common Occupations - Architecture and engineering occupations (%)
Most Common Occupations - Life, physical, and social science occupations (%)
Most Common Occupations - Education, legal, community service, arts, and media occupations (%)
Most Common Occupations - Community and social service occupations (%)
Most Common Occupations - Legal occupations (%)
Most Common Occupations - Education, training, and library occupations (%)
Most Common Occupations - Arts, design, entertainment, sports, and media occupations (%)
Most Common Occupations - Healthcare practitioners and technical occupations (%)
Most Common Occupations - Health diagnosing and treating practitioners and other technical occupations (%)
Most Common Occupations - Health technologists and technicians (%)
Most Common Occupations - Service occupations (%)
Most Common Occupations - Healthcare support occupations (%)
Most Common Occupations - Protective service occupations (%)
Most Common Occupations - Fire fighting and prevention, and other protective service workers including supervisors (%)
Most Common Occupations - Law enforcement workers including supervisors (%)
Most Common Occupations - Food preparation and serving related occupations (%)
Most Common Occupations - Building and grounds cleaning and maintenance occupations (%)
Most Common Occupations - Personal care and service occupations (%)
Most Common Occupations - Sales and office occupations (%)
Most Common Occupations - Sales and related occupations (%)
Most Common Occupations - Office and administrative support occupations (%)
Most Common Occupations - Natural resources, construction, and maintenance occupations (%)
Most Common Occupations - Farming, fishing, and forestry occupations (%)
Most Common Occupations - Construction and extraction occupations (%)
Most Common Occupations - Installation, maintenance, and repair occupations (%)
Most Common Occupations - Production, transportation, and material moving occupations (%)
Most Common Occupations - Production occupations (%)
Most Common Occupations - Transportation occupations (%)
Most Common Occupations - Material moving occupations (%)
People in Group quarters - Institutionalized population (%)
People in Group quarters - Correctional institutions (%)
People in Group quarters - Federal prisons and detention centers (%)
People in Group quarters - Halfway houses (%)
People in Group quarters - Local jails and other confinement facilities (including police lockups) (%)
People in Group quarters - Military disciplinary barracks (%)
People in Group quarters - State prisons (%)
People in Group quarters - Other types of correctional institutions (%)
People in Group quarters - Nursing homes (%)
People in Group quarters - Hospitals/wards, hospices, and schools for the handicapped (%)
People in Group quarters - Hospitals/wards and hospices for chronically ill (%)
People in Group quarters - Hospices or homes for chronically ill (%)
People in Group quarters - Military hospitals or wards for chronically ill (%)
People in Group quarters - Other hospitals or wards for chronically ill (%)
People in Group quarters - Hospitals or wards for drug/alcohol abuse (%)
People in Group quarters - Mental (Psychiatric) hospitals or wards (%)
People in Group quarters - Schools, hospitals, or wards for the mentally retarded (%)
People in Group quarters - Schools, hospitals, or wards for the physically handicapped (%)
People in Group quarters - Institutions for the deaf (%)
People in Group quarters - Institutions for the blind (%)
People in Group quarters - Orthopedic wards and institutions for the physically handicapped (%)
People in Group quarters - Wards in general hospitals for patients who have no usual home elsewhere (%)
People in Group quarters - Wards in military hospitals for patients who have no usual home elsewhere (%)
People in Group quarters - Juvenile institutions (%)
People in Group quarters - Long-term care (%)
People in Group quarters - Homes for abused, dependent, and neglected children (%)
People in Group quarters - Residential treatment centers for emotionally disturbed children (%)
People in Group quarters - Training schools for juvenile delinquents (%)
People in Group quarters - Short-term care, detention or diagnostic centers for delinquent children (%)
People in Group quarters - Type of juvenile institution unknown (%)
People in Group quarters - Noninstitutionalized population (%)
People in Group quarters - College dormitories (includes college quarters off campus) (%)
People in Group quarters - Military quarters (%)
People in Group quarters - On base (%)
People in Group quarters - Barracks, unaccompanied personnel housing (UPH), (Enlisted/Officer), ;and similar group living quarters for military personnel (%)
People in Group quarters - Transient quarters for temporary residents (%)
People in Group quarters - Military ships (%)
People in Group quarters - Group homes (%)
People in Group quarters - Homes or halfway houses for drug/alcohol abuse (%)
People in Group quarters - Homes for the mentally ill (%)
People in Group quarters - Homes for the mentally retarded (%)
People in Group quarters - Homes for the physically handicapped (%)
People in Group quarters - Other group homes (%)
People in Group quarters - Religious group quarters (%)
People in Group quarters - Dormitories (%)
People in Group quarters - Agriculture workers' dormitories on farms (%)
People in Group quarters - Job Corps and vocational training facilities (%)
People in Group quarters - Other workers' dormitories (%)
People in Group quarters - Crews of maritime vessels (%)
People in Group quarters - Other nonhousehold living situations (%)
People in Group quarters - Other noninstitutional group quarters (%)
Residents speaking English at home (%)
Residents speaking English at home - Born in the United States (%)
Residents speaking English at home - Native, born elsewhere (%)
Residents speaking English at home - Foreign born (%)
Residents speaking Spanish at home (%)
Residents speaking Spanish at home - Born in the United States (%)
Residents speaking Spanish at home - Native, born elsewhere (%)
Residents speaking Spanish at home - Foreign born (%)
Residents speaking other language at home (%)
Residents speaking other language at home - Born in the United States (%)
Residents speaking other language at home - Native, born elsewhere (%)
Residents speaking other language at home - Foreign born (%)
Class of Workers - Employee of private company (%)
Class of Workers - Self-employed in own incorporated business (%)
Class of Workers - Private not-for-profit wage and salary workers (%)
Class of Workers - Local government workers (%)
Class of Workers - State government workers (%)
Class of Workers - Federal government workers (%)
Class of Workers - Self-employed workers in own not incorporated business and Unpaid family workers (%)
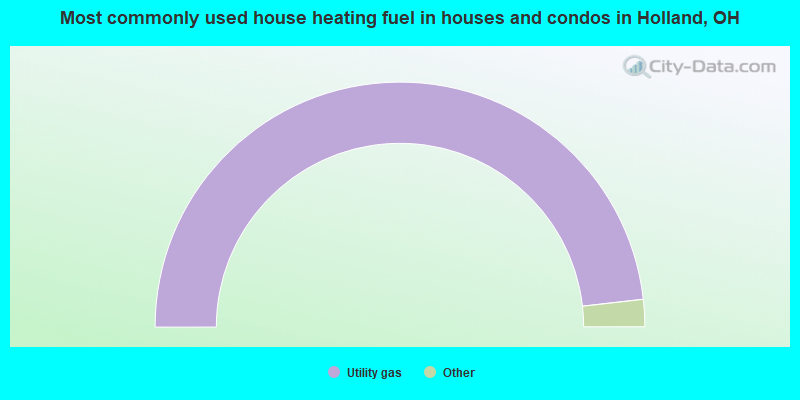
House heating fuel used in houses and condos - Utility gas (%)
House heating fuel used in houses and condos - Bottled, tank, or LP gas (%)
House heating fuel used in houses and condos - Electricity (%)
House heating fuel used in houses and condos - Fuel oil, kerosene, etc. (%)
House heating fuel used in houses and condos - Coal or coke (%)
House heating fuel used in houses and condos - Wood (%)
House heating fuel used in houses and condos - Solar energy (%)
House heating fuel used in houses and condos - Other fuel (%)
House heating fuel used in houses and condos - No fuel used (%)
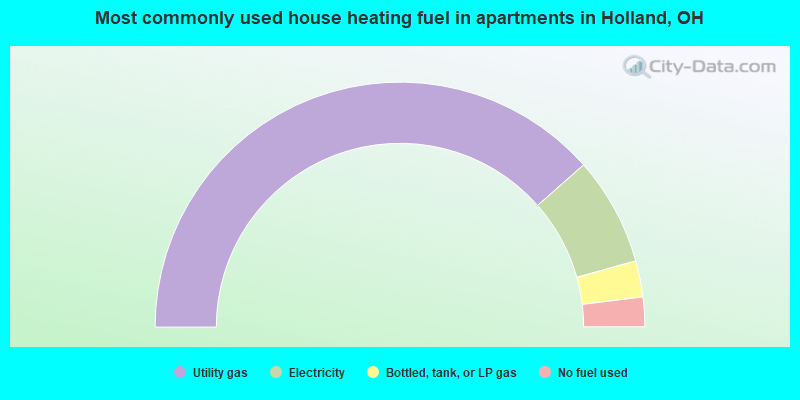
House heating fuel used in apartments - Utility gas (%)
House heating fuel used in apartments - Bottled, tank, or LP gas (%)
House heating fuel used in apartments - Electricity (%)
House heating fuel used in apartments - Fuel oil, kerosene, etc. (%)
House heating fuel used in apartments - Coal or coke (%)
House heating fuel used in apartments - Wood (%)
House heating fuel used in apartments - Solar energy (%)
House heating fuel used in apartments - Other fuel (%)
House heating fuel used in apartments - No fuel used (%)
Armed forces status - In Armed Forces (%)
Armed forces status - Civilian (%)
Armed forces status - Civilian - Veteran (%)
Armed forces status - Civilian - Nonveteran (%)
Fatal accidents locations in years 2005-2021
Fatal accidents locations in 2005
Fatal accidents locations in 2006
Fatal accidents locations in 2007
Fatal accidents locations in 2008
Fatal accidents locations in 2009
Fatal accidents locations in 2010
Fatal accidents locations in 2011
Fatal accidents locations in 2012
Fatal accidents locations in 2013
Fatal accidents locations in 2014
Fatal accidents locations in 2015
Fatal accidents locations in 2016
Fatal accidents locations in 2017
Fatal accidents locations in 2018
Fatal accidents locations in 2019
Fatal accidents locations in 2020
Fatal accidents locations in 2021
Alcohol use - People drinking some alcohol every month (%)
Alcohol use - People not drinking at all (%)
Alcohol use - Average days/month drinking alcohol
Alcohol use - Average drinks/week
Alcohol use - Average days/year people drink much
Audiometry - Average condition of hearing (%)
Audiometry - People that can hear a whisper from across a quiet room (%)
Audiometry - People that can hear normal voice from across a quiet room (%)
Audiometry - Ears ringing, roaring, buzzing (%)
Audiometry - Had a job exposure to loud noise (%)
Audiometry - Had off-work exposure to loud noise (%)
Blood Pressure & Cholesterol - Has high blood pressure (%)
Blood Pressure & Cholesterol - Checking blood pressure at home (%)
Blood Pressure & Cholesterol - Frequently checking blood cholesterol (%)
Blood Pressure & Cholesterol - Has high cholesterol level (%)
Consumer Behavior - Money monthly spent on food at supermarket/grocery store
Consumer Behavior - Money monthly spent on food at other stores
Consumer Behavior - Money monthly spent on eating out
Consumer Behavior - Money monthly spent on carryout/delivered foods
Consumer Behavior - Income spent on food at supermarket/grocery store (%)
Consumer Behavior - Income spent on food at other stores (%)
Consumer Behavior - Income spent on eating out (%)
Consumer Behavior - Income spent on carryout/delivered foods (%)
Current Health Status - General health condition (%)
Current Health Status - Blood donors (%)
Current Health Status - Has blood ever tested for HIV virus (%)
Current Health Status - Left-handed people (%)
Dermatology - People using sunscreen (%)
Diabetes - Diabetics (%)
Diabetes - Had a blood test for high blood sugar (%)
Diabetes - People taking insulin (%)
Diet Behavior & Nutrition - Diet health (%)
Diet Behavior & Nutrition - Milk product consumption (# of products/month)
Diet Behavior & Nutrition - Meals not home prepared (#/week)
Diet Behavior & Nutrition - Meals from fast food or pizza place (#/week)
Diet Behavior & Nutrition - Ready-to-eat foods (#/month)
Diet Behavior & Nutrition - Frozen meals/pizza (#/month)
Drug Use - People that ever used marijuana or hashish (%)
Drug Use - Ever used hard drugs (%)
Drug Use - Ever used any form of cocaine (%)
Drug Use - Ever used heroin (%)
Drug Use - Ever used methamphetamine (%)
Health Insurance - People covered by health insurance (%)
Kidney Conditions-Urology - Avg. # of times urinating at night
Medical Conditions - People with asthma (%)
Medical Conditions - People with anemia (%)
Medical Conditions - People with psoriasis (%)
Medical Conditions - People with overweight (%)
Medical Conditions - Elderly people having difficulties in thinking or remembering (%)
Medical Conditions - People who ever received blood transfusion (%)
Medical Conditions - People having trouble seeing even with glass/contacts (%)
Medical Conditions - People with arthritis (%)
Medical Conditions - People with gout (%)
Medical Conditions - People with congestive heart failure (%)
Medical Conditions - People with coronary heart disease (%)
Medical Conditions - People with angina pectoris (%)
Medical Conditions - People who ever had heart attack (%)
Medical Conditions - People who ever had stroke (%)
Medical Conditions - People with emphysema (%)
Medical Conditions - People with thyroid problem (%)
Medical Conditions - People with chronic bronchitis (%)
Medical Conditions - People with any liver condition (%)
Medical Conditions - People who ever had cancer or malignancy (%)
Mental Health - People who have little interest in doing things (%)
Mental Health - People feeling down, depressed, or hopeless (%)
Mental Health - People who have trouble sleeping or sleeping too much (%)
Mental Health - People feeling tired or having little energy (%)
Mental Health - People with poor appetite or overeating (%)
Mental Health - People feeling bad about themself (%)
Mental Health - People who have trouble concentrating on things (%)
Mental Health - People moving or speaking slowly or too fast (%)
Mental Health - People having thoughts they would be better off dead (%)
Oral Health - Average years since last visit a dentist
Oral Health - People embarrassed because of mouth (%)
Oral Health - People with gum disease (%)
Oral Health - General health of teeth and gums (%)
Oral Health - Average days a week using dental floss/device
Oral Health - Average days a week using mouthwash for dental problem
Oral Health - Average number of teeth
Pesticide Use - Households using pesticides to control insects (%)
Pesticide Use - Households using pesticides to kill weeds (%)
Physical Activity - People doing vigorous-intensity work activities (%)
Physical Activity - People doing moderate-intensity work activities (%)
Physical Activity - People walking or bicycling (%)
Physical Activity - People doing vigorous-intensity recreational activities (%)
Physical Activity - People doing moderate-intensity recreational activities (%)
Physical Activity - Average hours a day doing sedentary activities
Physical Activity - Average hours a day watching TV or videos
Physical Activity - Average hours a day using computer
Physical Functioning - People having limitations keeping them from working (%)
Physical Functioning - People limited in amount of work they can do (%)
Physical Functioning - People that need special equipment to walk (%)
Physical Functioning - People experiencing confusion/memory problems (%)
Physical Functioning - People requiring special healthcare equipment (%)
Prescription Medications - Average number of prescription medicines taking
Preventive Aspirin Use - Adults 40+ taking low-dose aspirin (%)
Reproductive Health - Vaginal deliveries (%)
Reproductive Health - Cesarean deliveries (%)
Reproductive Health - Deliveries resulted in a live birth (%)
Reproductive Health - Pregnancies resulted in a delivery (%)
Reproductive Health - Women breastfeeding newborns (%)
Reproductive Health - Women that had a hysterectomy (%)
Reproductive Health - Women that had both ovaries removed (%)
Reproductive Health - Women that have ever taken birth control pills (%)
Reproductive Health - Women taking birth control pills (%)
Reproductive Health - Women that have ever used Depo-Provera or injectables (%)
Reproductive Health - Women that have ever used female hormones (%)
Sexual Behavior - People 18+ that ever had sex (vaginal, anal, or oral) (%)
Sexual Behavior - Males 18+ that ever had vaginal sex with a woman (%)
Sexual Behavior - Males 18+ that ever performed oral sex on a woman (%)
Sexual Behavior - Males 18+ that ever had anal sex with a woman (%)
Sexual Behavior - Males 18+ that ever had any sex with a man (%)
Sexual Behavior - Females 18+ that ever had vaginal sex with a man (%)
Sexual Behavior - Females 18+ that ever performed oral sex on a man (%)
Sexual Behavior - Females 18+ that ever had anal sex with a man (%)
Sexual Behavior - Females 18+ that ever had any kind of sex with a woman (%)
Sexual Behavior - Average age people first had sex
Sexual Behavior - Average number of female sex partners in lifetime (males 18+)
Sexual Behavior - Average number of female vaginal sex partners in lifetime (males 18+)
Sexual Behavior - Average age people first performed oral sex on a woman (18+)
Sexual Behavior - Average number of woman performed oral sex on in lifetime (18+)
Sexual Behavior - Average number of male sex partners in lifetime (males 18+)
Sexual Behavior - Average number of male anal sex partners in lifetime (males 18+)
Sexual Behavior - Average age people first performed oral sex on a man (18+)
Sexual Behavior - Average number of male oral sex partners in lifetime (18+)
Sexual Behavior - People using protection when performing oral sex (%)
Sexual Behavior - Average number of times people have vaginal or anal sex a year
Sexual Behavior - People having sex without condom (%)
Sexual Behavior - Average number of male sex partners in lifetime (females 18+)
Sexual Behavior - Average number of male vaginal sex partners in lifetime (females 18+)
Sexual Behavior - Average number of female sex partners in lifetime (females 18+)
Sexual Behavior - Circumcised males 18+ (%)
Sleep Disorders - Average hours sleeping at night
Sleep Disorders - People that has trouble sleeping (%)
Smoking-Cigarette Use - People smoking cigarettes (%)
Taste & Smell - People 40+ having problems with smell (%)
Taste & Smell - People 40+ having problems with taste (%)
Taste & Smell - People 40+ that ever had wisdom teeth removed (%)
Taste & Smell - People 40+ that ever had tonsils teeth removed (%)
Taste & Smell - People 40+ that ever had a loss of consciousness because of a head injury (%)
Taste & Smell - People 40+ that ever had a broken nose or other serious injury to face or skull (%)
Taste & Smell - People 40+ that ever had two or more sinus infections (%)
Weight - Average height (inches)
Weight - Average weight (pounds)
Weight - Average BMI
Weight - People that are obese (%)
Weight - People that ever were obese (%)
Weight - People trying to lose weight (%)
Officers per 1,000 residents here:
5.45Ohio average:
2.24
Latest news from Holland, OH collected exclusively by city-data.com from local newspapers, TV, and radio stations
Ancestries: German (24.9%), American (7.3%), Scotch-Irish (6.4%), English (5.9%), Polish (5.4%), Italian (4.6%).
Current Local Time:
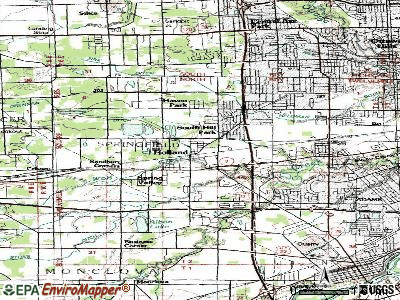
Land area: 0.87 square miles.
Population density: 2,077 people per square mile (low).
77 residents are foreign born (1.9% Asia , 1.4% Latin America , 1.0% Africa ).
This village:
5.0%Ohio:
4.9%
Median real estate property taxes paid for housing units with mortgages in 2022: $3,532 (1.5%)Median real estate property taxes paid for housing units with no mortgage in 2022: $2,312 (1.4%)
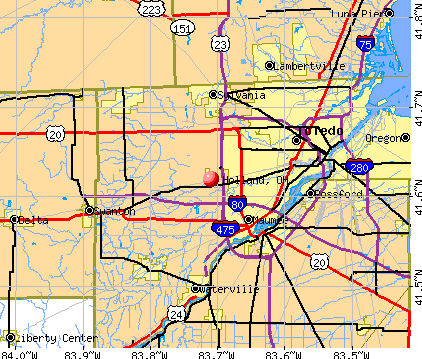
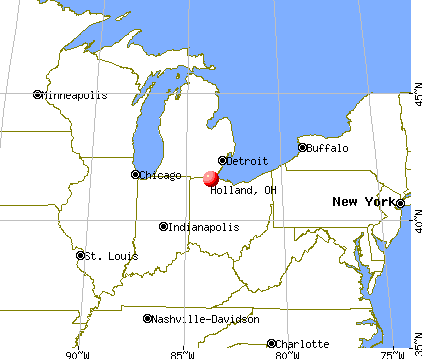
Nearest city with pop. 50,000+: Toledo, OH
Nearest city with pop. 1,000,000+: Chicago, IL
Nearest cities:
Latitude: 41.62 N, Longitude: 83.71 W
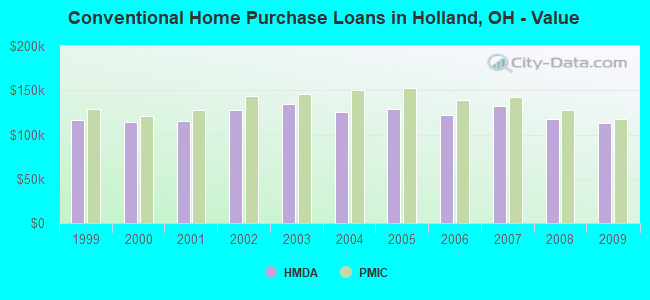
Property values in Holland, OH
Unemployment in December 2023: Population change in the 1990s: +114 (+9.6%).
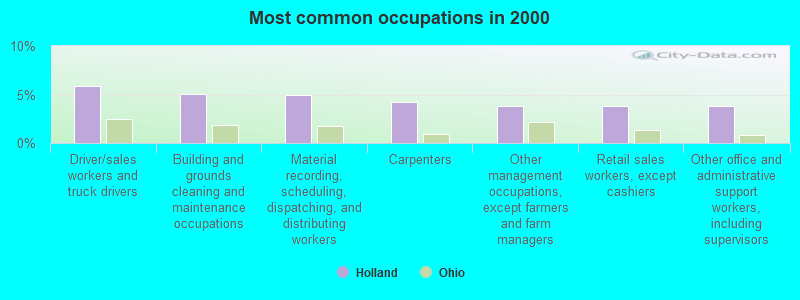
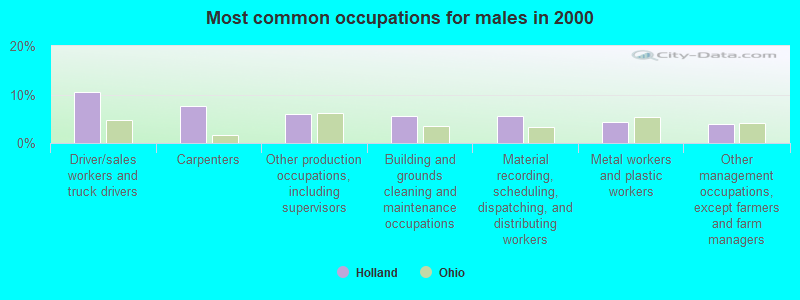
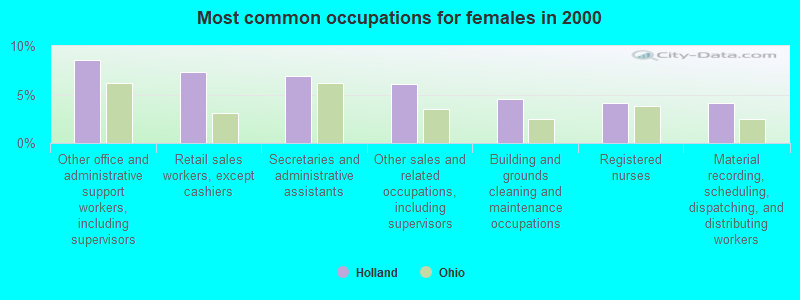
Most common occupations in Holland, OH (%)
Both Males Females
Driver/sales workers and truck drivers (5.8%)
Building and grounds cleaning and maintenance occupations (5.1%)
Material recording, scheduling, dispatching, and distributing workers (4.9%)
Carpenters (4.2%)
Other management occupations, except farmers and farm managers (3.8%)
Retail sales workers, except cashiers (3.8%)
Other office and administrative support workers, including supervisors (3.8%)
Driver/sales workers and truck drivers (10.5%)
Carpenters (7.6%)
Other production occupations, including supervisors (5.9%)
Building and grounds cleaning and maintenance occupations (5.6%)
Material recording, scheduling, dispatching, and distributing workers (5.6%)
Metal workers and plastic workers (4.3%)
Other management occupations, except farmers and farm managers (3.9%)
Other office and administrative support workers, including supervisors (8.6%)
Retail sales workers, except cashiers (7.3%)
Secretaries and administrative assistants (6.9%)
Other sales and related occupations, including supervisors (6.1%)
Building and grounds cleaning and maintenance occupations (4.5%)
Registered nurses (4.1%)
Material recording, scheduling, dispatching, and distributing workers (4.1%)
Tornado activity:
Holland-area historical tornado activity is slightly above Ohio state average. It is 47% greater than the overall U.S. average.
On 4/11/1965, a category F4 (max. wind speeds 207-260 mph) tornado 6.7 miles away from the Holland village center killed 18 people and injured 236 people and caused between $5,000,000 and $50,000,000 in damages.
On 6/8/1953, a category F4 tornado 13.2 miles away from the village center killed 4 people and injured 18 people and caused between $50,000 and $500,000 in damages.
Earthquake activity:
Holland-area historical earthquake activity is significantly above Ohio state average. It is 30% smaller than the overall U.S. average. On 9/25/1998 at 19:52:52, a magnitude 5.2 (4.8 MB, 4.3 MS, 5.2 LG, 4.5 MW, Depth: 3.1 mi, Class: Moderate, Intensity: VI - VII) earthquake occurred 171.7 miles away from Holland center On 1/31/1986 at 16:46:43, a magnitude 5.0 (5.0 MB) earthquake occurred 131.9 miles away from Holland center On 7/12/1986 at 08:19:37, a magnitude 4.5 (4.5 MB, Class: Light, Intensity: IV - V) earthquake occurred 82.4 miles away from Holland center On 7/27/1980 at 18:52:21, a magnitude 5.2 (5.1 MB, 4.7 MS, 5.0 UK, 5.2 UK) earthquake occurred 236.5 miles away from the city center On 4/18/2008 at 09:36:59, a magnitude 5.4 (5.1 MB, 4.8 MS, 5.4 MW, 5.2 MW) earthquake occurred 311.2 miles away from Holland center On 5/2/2015 at 16:23:07, a magnitude 4.2 (4.2 MW, Depth: 2.8 mi) earthquake occurred 98.2 miles away from Holland center Magnitude types: regional Lg-wave magnitude (LG), body-wave magnitude (MB), surface-wave magnitude (MS), moment magnitude (MW) Natural disasters: The number of natural disasters in Lucas County (13) is near the US average (15).Major Disasters (Presidential) Declared: 8Emergencies Declared: 4Storms: 8, Floods: 7, Tornadoes: 4, Snowstorms: 2, Blizzard: 1, Hurricane: 1, Power Outage: 1, Wind: 1, Other: 1 (Note: some incidents may be assigned to more than one category). Hospitals and medical centers in Holland: ANNE GRADY CENTER (1525 EBER ROAD) EBER COMMUNITY RESIDENCE (1601 EBER RD) ALLIED HOME HEALTH SERVICES (6228 MERGER DRIVE)
LUTHERAN VILLAGE AT WOLFCREEK (2001 PERRYSBURG HOLLAND ROAD)
SPRING MEADOWS EXTENDED CARE F (1125 CLARION AVE)
Amtrak station near Holland: 9 miles: TOLEDO (415 EMERALD AVE.) Services: ticket office, fully wheelchair accessible, enclosed waiting area, public restrooms, public payphones, vending machines, free short-term parking, free long-term parking, call for car rental service, taxi stand, public transit connection.
College/University in Holland: Regency Beauty Institute-Toledo Full-time enrollment: 96; Location: 1554 Spring Meadows Drive; Private, for-profit; Website: www.regency.edu)
Colleges/universities with over 2000 students nearest to Holland:
University of Toledo (about 6 miles; Toledo, OH ; Full-time enrollment: 18,409)
Owens Community College (about 10 miles; Perrysburg, OH ; FT enrollment: 9,416)
Bowling Green State University-Main Campus (about 18 miles; Bowling Green, OH ; FT enrollment: 16,357)
Monroe County Community College (about 24 miles; Monroe, MI ; FT enrollment: 2,553)
Siena Heights University (about 26 miles; Adrian, MI ; FT enrollment: 2,009)
Northwest State Community College (about 33 miles; Archbold, OH ; FT enrollment: 2,406)
Terra State Community College (about 34 miles; Fremont, OH ; FT enrollment: 2,119)
Public high schools in Holland:
Public elementary/middle schools in Holland:
Private elementary/middle school in Holland: CHILDREN'S DISCOVERY CENTER - WOLF CREEK Students: 51, Location: 1640 TIMBER WOLF DR, Grades: PK-2)
See full list of schools located in Holland
Tourist attraction:
Hotels:
Birthplace of: Josh Unice - Ice hockey goaltender.
Lucas County has a predicted average indoor radon screening level between 2 and 4 pCi/L (pico curies per liter) - Moderate Potential Drinking water stations with addresses in Holland and their reported violations in the past:
MONCLOVA RENTALS (Population served: 116, Groundwater):
Past monitoring violations:
2 routine major monitoring violations
One regular monitoring violation
Average household size: This village:
2.2 peopleOhio:
2.4 people
Percentage of family households: This village:
57.4%Whole state:
65.0%
Percentage of households with unmarried partners: This village:
5.9%Whole state:
6.8%
Likely homosexual households (counted as self-reported same-sex unmarried-partner households)
Lesbian couples: 0.3% of all households Gay men: 0.7% of all households
94 people in nursing facilities/skilled-nursing facilities in 2010people in nursing homes in 2000people in other noninstitutional group quarters in 2000
Banks with branches in Holland (2011 data):
Fifth Third Bank: Spring Meadows Branch at 6600 Airport Highway, branch established on 1989/04/18. Info updated 2009/10/05: Bank assets: $114,540.4 mil, Deposits: $89,689.1 mil, headquarters in Cincinnati, OH, positive income , Commercial Lending Specialization, 1378 total offices , Holding Company: Fifth Third Bancorp
First Federal Savings and Loan Association: 6910 Airport Highway Branch at 6910 Airport Highway, branch established on 1934/01/01. Info updated 2011/07/21: Bank assets: $162.4 mil, Deposits: $143.2 mil, headquarters in Delta, OH, positive income , Mortgage Lending Specialization, 6 total offices
PNC Bank, National Association: Spring Meadows Branch at 7015 Spring Meadows West Drive, branch established on 1963/06/17. Info updated 2012/03/20: Bank assets: $263,309.6 mil, Deposits: $197,343.0 mil, headquarters in Wilmington, DE, positive income , Commercial Lending Specialization, 3085 total offices , Holding Company: Pnc Financial Services Group, Inc., The
The Huntington National Bank: Spring Meadows Financial Center at 1311 Mccord Rd, branch established on 1986/07/07. Info updated 2012/04/02: Bank assets: $54,183.4 mil, Deposits: $44,300.3 mil, headquarters in Columbus, OH, positive income , Commercial Lending Specialization, 878 total offices , Holding Company: Huntington Bancshares Incorporated
Woodforest National Bank: Holland Walmart Branch at 1355 S Mccord Road, branch established on 2008/05/15. Info updated 2011/05/10: Bank assets: $3,488.9 mil, Deposits: $3,097.6 mil, headquarters in Houston, TX, positive income , Commercial Lending Specialization, 766 total offices , Holding Company: Woodforest Financial Group Employee Stock Ownership Plan (With 401(K) Provisions)
KeyBank National Association: Airport Highway & Mccord Road Branch at 6811 Airport Highway, branch established on 1978/11/01. Info updated 2008/03/03: Bank assets: $86,198.8 mil, Deposits: $64,214.8 mil, headquarters in Cleveland, OH, positive income , Commercial Lending Specialization, 1067 total offices , Holding Company: Keycorp
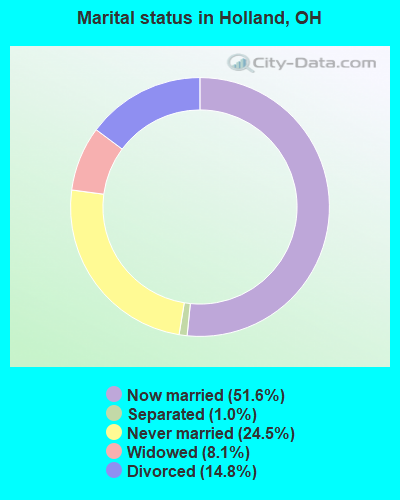
For population 15 years and over in Holland:
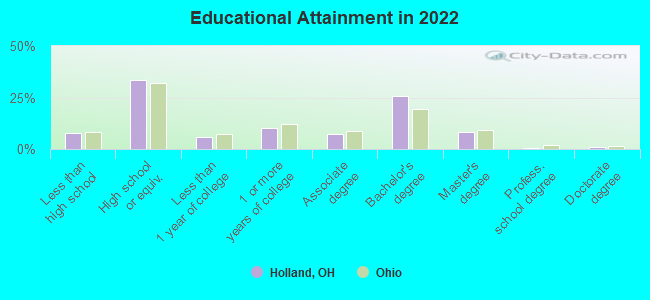
Never married: 24.5%Now married: 51.6%Separated: 1.0%Widowed: 8.1%Divorced: 14.8% For population 25 years and over in Holland:
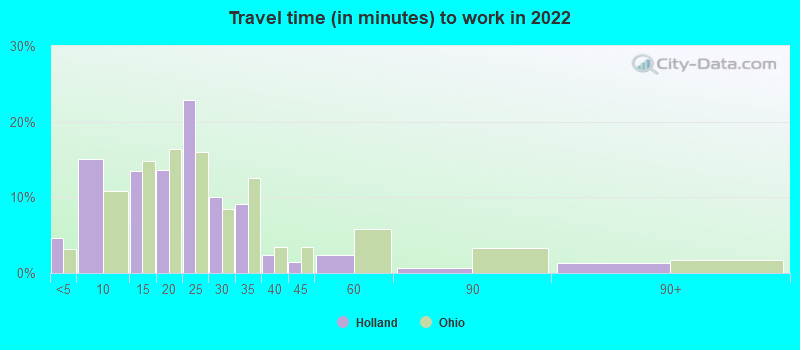
High school or higher: 90.5%Bachelor's degree or higher: 33.0%Graduate or professional degree: 8.7%Unemployed: 2.3%Mean travel time to work (commute): 17.7 minutes
Education Gini index (Inequality in education) Here:
10.0Ohio average:
11.0
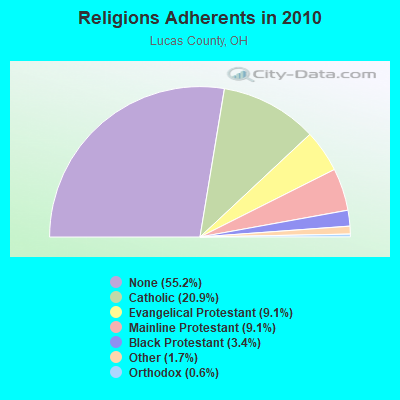
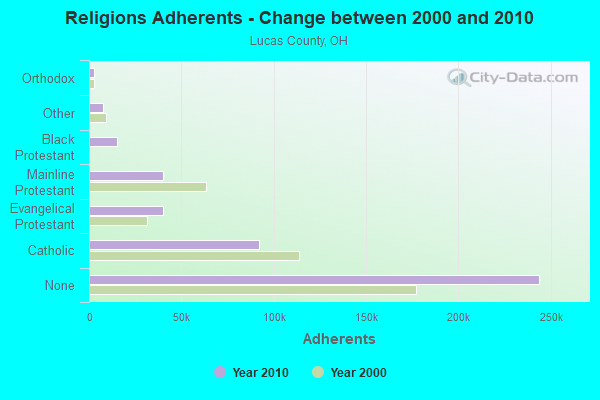
Religion statistics for Holland, OH (based on Lucas County data)
Religion Adherents Congregations Catholic 92,283 35 Evangelical Protestant 40,272 145 Mainline Protestant 39,991 115 Black Protestant 15,134 44 Other 7,578 29 Orthodox 2,680 4 None 243,877 -
Source: Clifford Grammich, Kirk Hadaway, Richard Houseal, Dale E.Jones, Alexei Krindatch, Richie Stanley and Richard H.Taylor. 2012. 2010 U.S.Religion Census: Religious Congregations & Membership Study. Association of Statisticians of American Religious Bodies. Jones, Dale E., et al. 2002. Congregations and Membership in the United States 2000. Nashville, TN: Glenmary Research Center. Graphs represent county-level data
Food Environment Statistics: Number of grocery stores : 74Lucas County :
1.67 / 10,000 pop.Ohio :
1.89 / 10,000 pop.
Number of supercenters and club stores : 6Lucas County :
0.14 / 10,000 pop.Ohio :
0.13 / 10,000 pop.
Number of convenience stores (no gas) : 98Here :
2.22 / 10,000 pop.Ohio :
1.25 / 10,000 pop.
Number of convenience stores (with gas) : 132Here :
2.98 / 10,000 pop.Ohio :
2.93 / 10,000 pop.
Number of full-service restaurants : 334Lucas County :
7.55 / 10,000 pop.State :
6.25 / 10,000 pop.
Adult obesity rate : Lucas County :
30.0%Ohio :
29.1%
Low-income preschool obesity rate : This county :
10.6%Ohio :
11.9%
Health and Nutrition:
Average overall health of teeth and gums : People feeling badly about themselves : People not drinking alcohol at all : This city:
11.3%Ohio:
10.4%
Average hours sleeping at night : Overweight people : This city:
33.2%Ohio:
34.3%
General health condition : Average condition of hearing : More about Health and Nutrition of Holland, OH Residents
Local government employment and payroll (March 2022)
Function
Full-time employees
Monthly full-time payroll
Average yearly full-time wage
Part-time employees
Monthly part-time payroll
Police Protection - Officers
8 $47,944 $71,916 2 $992 Streets and Highways
4 $19,215 $57,645 0 $0 Financial Administration
1 $5,064 $60,768 0 $0 Other Government Administration
1 $4,815 $57,780 10 $3,684 Judicial and Legal
0 $0 1 $546 Other and Unallocable
0 $0 1 $511 Police - Other
0 $0 1 $1,496
Totals for Government
14 $77,038 $66,033 15 $7,229
Holland government finances - Expenditure in 2017 (per resident):
Construction - Regular Highways: $1,183,000 ($657.22)
Parks and Recreation: $23,000 ($12.78)Current Operations - Police Protection: $830,000 ($461.11)
Regular Highways: $381,000 ($211.67)Financial Administration: $342,000 ($190.00)General - Other: $313,000 ($173.89)Central Staff Services: $122,000 ($67.78)Parks and Recreation: $70,000 ($38.89)General Public Buildings: $62,000 ($34.44)Solid Waste Management: $55,000 ($30.56)Judicial and Legal Services: $31,000 ($17.22)General - Interest on Debt: $2,000 ($1.11)
Intergovernmental to Local - Other - Local Fire Protection: $254,000 ($141.11)
Other - Health - Other: $12,000 ($6.67)Other - Judicial and Legal Services: $9,000 ($5.00)Other - General - Other: $1,000 ($0.56)Intergovernmental to State - Regular Highways: $1,867,000 ($1037.22)
Health - Other: $41,000 ($22.78)Other Capital Outlay - Police Protection: $16,000 ($8.89)
General Public Building: $12,000 ($6.67)Financial Administration: $10,000 ($5.56)Regular Highways: $1,000 ($0.56)Total Salaries and Wages: $999,000 ($555.00)
Holland government finances - Revenue in 2017 (per resident):
Charges - Other: $17,000 ($9.44)
Solid Waste Management: $2,000 ($1.11)Local Intergovernmental - Other: $1,616,000 ($897.78)
General Local Government Support: $70,000 ($38.89)Public Welfare: $1,000 ($0.56)Miscellaneous - Rents: $85,000 ($47.22)
General Revenue - Other: $79,000 ($43.89)Interest Earnings: $78,000 ($43.33)Fines and Forfeits: $10,000 ($5.56)State Intergovernmental - Highways: $2,494,000 ($1385.56)
General Local Government Support: $68,000 ($37.78)Tax - Individual Income: $3,217,000 ($1787.22)
Corporation Net Income: $848,000 ($471.11)Property: $47,000 ($26.11)Public Utilities Sales: $34,000 ($18.89)Motor Vehicle License: $4,000 ($2.22)Other License: $3,000 ($1.67)
Holland government finances - Debt in 2017 (per resident):
Long Term Debt - Beginning Outstanding - Unspecified Public Purpose: $39,000 ($21.67)
Retired Unspecified Public Purpose: $39,000 ($21.67)
Holland government finances - Cash and Securities in 2017 (per resident):
Other Funds - Cash and Securities: $18,035,000 ($10019.44)
4.37% of this county's 2021 resident taxpayers lived in other counties in 2020 ($52,879 average adjusted gross income )
Here:
4.37%Ohio average:
5.68%
0.01% of residents moved from foreign countries ($120 average AGI )Lucas County:
0.01%Ohio average:
0.01%
Top counties from which taxpayers relocated into this county between 2020 and 2021:
Businesses in Holland, OH
Name Count Name Count
Advance Auto Parts 1 McDonald's 1 Arby's 1 Menards 1 Ashley Furniture 1 Motherhood Maternity 1 AutoZone 1 Nike 3 Avenue 1 OfficeMax 1 Bath & Body Works 1 Old Navy 1 Bed Bath & Beyond 1 Panera Bread 1 Burger King 1 Payless 1 Chipotle 1 PetSmart 1 Circle K 1 Quality 1 Curves 1 RadioShack 1 Dairy Queen 1 Red Roof Inn 1 Deb 1 Rite Aid 1 Econo Lodge 1 Rue21 1 Extended Stay America 1 Sam's Club 1 Fashion Bug 1 Shoe Carnival 1 FedEx 2 Subway 2 Firestone Complete Auto Care 1 T-Mobile 3 GNC 1 T.J.Maxx 1 GameStop 2 Taco Bell 1 H&R Block 1 Target 1 Hawthorn 1 Tim Hortons 1 IHOP 1 Toys"R"Us 1 KFC 1 U-Haul 1 Kohl's 1 UPS 4 Kroger 2 Waffle House 1 Little Caesars Pizza 1 Walmart 1 Long John Silver's 1 Wendy's 1 MasterBrand Cabinets 3
Strongest AM radio stations in Holland:
WTOD (1560 AM; daytime; 5 kW; TOLEDO, OH; Owner: CUMULUS LICENSING CORP.)
WSPD (1370 AM; 5 kW; TOLEDO, OH; Owner: CITICASTERS LICENSES, L.P.)
WFDF (910 AM; 50 kW; FLINT, MI; Owner: ABC, INC.)
WJR (760 AM; 50 kW; DETROIT, MI; Owner: ABC, INC.)
WDFN (1130 AM; 50 kW; DETROIT, MI; Owner: AMFM RADIO LICENSES, L.L.C.)
WCHB (1200 AM; 50 kW; TAYLOR, MI; Owner: RADIO ONE OF DETROIT, LLC)
WJYM (730 AM; 1 kW; BOWLING GREEN, OH; Owner: FAMILY WORSHIP CENTER CHURCH, INC.)
WCWA (1230 AM; 1 kW; TOLEDO, OH; Owner: JACOR BROADCASTING CORPORATION)
WWJ (950 AM; 50 kW; DETROIT, MI; Owner: INFINITY BROADCASTING OPERATIONS, INC.)
WXYT (1270 AM; 50 kW; DETROIT, MI; Owner: INFINITY BROADCASTING CORP. OF DETROIT)
WTKA (1050 AM; 10 kW; ANN ARBOR, MI; Owner: CAPSTAR TX LIMITED PARTNERSHIP)
WDMN (1520 AM; 1 kW; TOLEDO, OH)
WKNR (850 AM; 50 kW; CLEVELAND, OH; Owner: CARON BROADCASTING, INC.)
Strongest FM radio stations in Holland:
WPOS-FM (102.3 FM; HOLLAND, OH; Owner: THE MAUMEE VALLEY BROADCASTING ASSN.)
WYSZ (89.3 FM; MAUMEE, OH; Owner: SIDE BY SIDE, INC.)
W264AK (100.7 FM; TOLEDO, OH; Owner: CALVARY CHAPEL OF TWIN FALLS, INC.)
WOTL (90.3 FM; TOLEDO, OH; Owner: FAMILY STATIONS, INC.)
WWWM-FM (105.5 FM; SYLVANIA, OH; Owner: CUMULUS LICENSING CORP.)
WVKS (92.5 FM; TOLEDO, OH; Owner: CITICASTERS LICENSES, L.P.)
WGTE-FM (91.3 FM; TOLEDO, OH; Owner: THE PUBLIC B/C FOUNDATION OF NW OHIO)
WXQQ (96.9 FM; WAUSEON, OH; Owner: CORNERSTONE CHURCH, INC.)
WRVF (101.5 FM; TOLEDO, OH; Owner: CITICASTERS LICENSES, L.P.)
WRWK (106.5 FM; DELTA, OH; Owner: CUMULUS LICENSING CORP.)
WRQN (93.5 FM; BOWLING GREEN, OH; Owner: CUMULUS LICENSING CORP.)
WJUC (107.3 FM; SWANTON, OH; Owner: WELCH COMMUNICATIONS, INC.)
WKKO (99.9 FM; TOLEDO, OH; Owner: CUMULUS LICENSING CORP.)
WIOT (104.7 FM; TOLEDO, OH; Owner: JACOR BROADCASTING CORPORATION)
WAAQ (88.3 FM; ONSTED, MI; Owner: GREAT LAKES COMMUNITY BROADCASTING, INC.)
WTWR-FM (98.3 FM; LUNA PIER, MI; Owner: CUMULUS LICENSING CORP.)
WJZE (97.3 FM; OAK HARBOR, OH; Owner: RASP BROADCASTING ENTERPRISES, INC.)
WIMX (95.7 FM; GIBSONBURG, OH; Owner: RIVERSIDE BROADCASTING, INC)
WXTS-FM (88.3 FM; TOLEDO, OH; Owner: BD OF ED TOLEDO CITY SCHOOL DIST)
WMTR-FM (96.1 FM; ARCHBOLD, OH; Owner: NOBCO, INC.)
TV broadcast stations around Holland:
W64BM (Channel 64; TOLEDO, OH; Owner: VENTANA TELEVISION, INC.)
WUPW (Channel 36; TOLEDO, OH; Owner: WUPW BROADCASTING, LLC)
WTOL (Channel 11; TOLEDO, OH; Owner: LIBCO, INC.)
WGTE-TV (Channel 30; TOLEDO, OH; Owner: THE PUBLIC BROADCASTING FOUNDATION OF NW OHIO)
WNWO-TV (Channel 24; TOLEDO, OH; Owner: RAYCOM NATIONAL, INC.)
WTVG (Channel 13; TOLEDO, OH; Owner: WTVG, INC.)
W59DC (Channel 59; HOUGHTON LAKE, MI; Owner: MS COMMUNICATIONS, LLC)
WBTL-LP (Channel 34; TOLEDO, OH; Owner: VENTURE TECHNOLOGIES GROUP, LLC)
WNGT-LP (Channel 48; TOLEDO, OH; Owner: L & M VIDEO PRODUCTIONS, INC.)
W22CO (Channel 22; TOLEDO, OH; Owner: NATIONAL MINORITY T.V., INC.)
WLMB (Channel 40; TOLEDO, OH; Owner: DOMINION BROADCASTING, INC.)
WBGU-TV (Channel 27; BOWLING GREEN, OH; Owner: BOWLING GREEN STATE UNIVERSITY)
Holland fatal accident list:
Mar 12, 2017 08:20 PM, Sr-2, Holloway Rd, Lat: 41.610269, Lon: -83.713181, Vehicles: 2, Persons: 4, Pedestrians: 1, Fatalities: 1Vehicles: 1, Persons: 2, Pedestrians: 1, Fatalities: 1Vehicles: 3, Persons: 3, Fatalities: 1Vehicles: 2, Persons: 2, Fatalities: 1, Drunk persons involved: 1Vehicles: 1, Persons: 1, Fatalities: 1Vehicles: 1, Persons: 3, Fatalities: 1Vehicles: 1, Persons: 3, Fatalities: 1
National Bridge Inventory (NBI) Statistics 33 Number of bridges253ft / 76.6m Total length493,354 Total average daily traffic80,118 Total average daily truck traffic
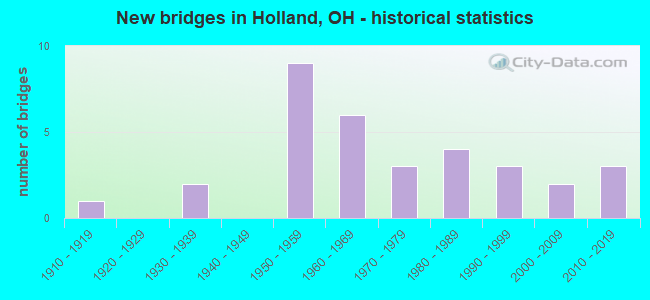
New bridges - historical statistics
1 1910-1919 2 1930-1939 9 1950-1959 6 1960-1969 3 1970-1979 4 1980-1989 3 1990-1999 2 2000-2009 3 2010-2019
See full National Bridge Inventory statistics for Holland, OH
FCC Registered Antenna Towers: 54 (
See the full list of FCC Registered Antenna Towers in Holland )
FCC Registered Commercial Land Mobile Towers: 1 (
See the full list of FCC Registered Commercial Land Mobile Towers in Holland, OH )
FCC Registered Broadcast Land Mobile Towers: 12 (
See the full list of FCC Registered Broadcast Land Mobile Towers )
FCC Registered Microwave Towers: 4
HOLLAND, Holland Operations Center, 6099 Angola Rd. (Lat: 41.623333 Lon: -83.687500), Type: Pole, Structure height: 45.7 m, Overall height: 46.5 m, Call Sign: WQDY889, Assigned Frequencies: 6685.00 MHz, Grant Date: 11/07/2015, Expiration Date: 12/05/2025, Certifier: Steven F Lux Mr., Registrant: Felhc Inc, 76 South Main St, Akron, OH 44308, Phone: (330) 384-5498, Fax: (330) 384-4506, Email:
DET1216, 6340 Angola Road (Lat: 41.625000 Lon: -83.690556), Type: Pole, Structure height: 45.7 m, Call Sign: WQFB687, Licensee ID: L01728370, Assigned Frequencies: 19540.0 MHz, Grant Date: 06/08/2006, Expiration Date: 06/08/2016, Cancellation Date: 09/11/2013, Certifier: Joseph M Sandri Jr., Registrant: Fibertower Network Services, Corp., Debtor-In-Possession, 1875 Eye Street, Nw, 5th Floor, Room 505, Washington, DC 20006, Phone: (202) 223-1028, Email:
9455 FRANKFO, Se Corner Of Frankfort & Meilke Roads (Lat: 41.643694 Lon: -83.769056), Type: Ltower, Structure height: 76.2 m, Overall height: 83.8 m, Call Sign: WQFQ590, Assigned Frequencies: 6286.19 MHz, 6226.89 MHz, Grant Date: 09/09/2016, Expiration Date: 09/11/2026, Certifier: Kenneth Perry, Registrant: Jep Telecom Licensing Services, 20210 Ragazza Circle, Unit 201, Venice, FL 34293-3354, Phone: (941) 441-6830, Email:
SPRINGFIELD OH1, 8940 Geiser Rd. (Lat: 41.611944 Lon: -83.755556), Type: Pole, Structure height: 36.6 m, Overall height: 37.8 m, Call Sign: WQIT977, Assigned Frequencies: 11365.0 MHz, 11445.0 MHz, Grant Date: 05/13/2008, Expiration Date: 05/13/2018, Cancellation Date: 11/13/2009, Certifier: William Chastain, Registrant: Radio Dynamics Corporation, Silver Spring, MD 20914, Phone: (301) 493-5171, Fax: (301) 576-4553, Email:
FCC Registered Paging Towers: 1
419 N. Mccord (Lat: 41.648639 Lon: -83.706028), Overall height: 102.1 m, Call Sign: KNKO716, Assigned Frequencies: 931.337 MHz, Grant Date: 12/27/2019, Expiration Date: 11/08/2029, Certifier: J. Roy Pottle, Registrant: Wilkinson Barker Knauer, LLP, 1800 M Street, N.W., Suite 800n, Washington, DC 20036, Phone: (202) 783-4141, Fax: (202) 783-5851, Email:
FCC Registered Amateur Radio Licenses: 74 (
See the full list of FCC Registered Amateur Radio Licenses in Holland )
FAA Registered Aircraft Manufacturers and Dealers: 1 (
See the full list of FAA Registered Manufacturers and Dealers in Holland )
FAA Registered Aircraft: 16 (
See the full list of FAA Registered Aircraft )
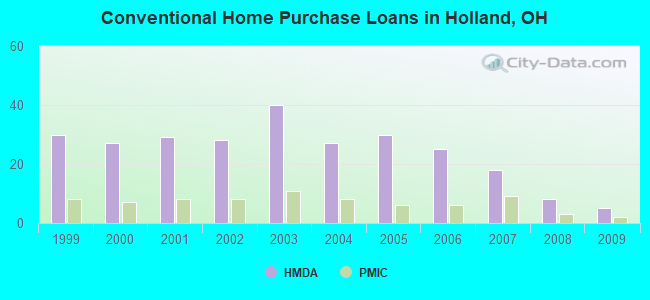
Home Mortgage Disclosure Act Aggregated Statistics For Year 2009(Based on 1 partial tract) A) FHA, FSA/RHS & VA B) Conventional C) Refinancings D) Home Improvement Loans F) Non-occupant Loans on Number Average Value Number Average Value Number Average Value Number Average Value Number Average Value
LOANS ORIGINATED 8 $139,956 5 $113,200 34 $127,581 2 $44,240 1 $103,260 APPLICATIONS APPROVED, NOT ACCEPTED 0 $0 0 $0 3 $121,280 0 $0 0 $0 APPLICATIONS DENIED 1 $127,990 0 $0 12 $145,077 1 $7,270 0 $0 APPLICATIONS WITHDRAWN 1 $145,920 0 $0 8 $129,624 0 $0 0 $0 FILES CLOSED FOR INCOMPLETENESS 0 $0 1 $97,930 2 $175,500 0 $0 0 $0
Aggregated Statistics For Year 2008(Based on 1 partial tract) A) FHA, FSA/RHS & VA B) Conventional C) Refinancings D) Home Improvement Loans F) Non-occupant Loans on Number Average Value Number Average Value Number Average Value Number Average Value Number Average Value
LOANS ORIGINATED 2 $152,590 8 $117,836 15 $139,137 1 $37,570 1 $164,590 APPLICATIONS APPROVED, NOT ACCEPTED 0 $0 0 $0 2 $160,225 1 $8,480 0 $0 APPLICATIONS DENIED 1 $119,990 2 $62,055 15 $126,937 2 $20,605 1 $76,360 APPLICATIONS WITHDRAWN 1 $48,480 1 $64,720 5 $138,750 0 $0 0 $0 FILES CLOSED FOR INCOMPLETENESS 0 $0 0 $0 1 $109,320 0 $0 0 $0
Aggregated Statistics For Year 2007(Based on 1 partial tract) A) FHA, FSA/RHS & VA B) Conventional C) Refinancings D) Home Improvement Loans F) Non-occupant Loans on G) Loans On Manufactured Number Average Value Number Average Value Number Average Value Number Average Value Number Average Value Number Average Value
LOANS ORIGINATED 1 $132,840 18 $132,189 19 $122,118 3 $52,520 3 $89,770 0 $0 APPLICATIONS APPROVED, NOT ACCEPTED 0 $0 1 $92,600 6 $108,918 1 $11,150 0 $0 0 $0 APPLICATIONS DENIED 0 $0 4 $66,540 19 $130,475 3 $27,150 1 $126,530 1 $25,940 APPLICATIONS WITHDRAWN 0 $0 2 $142,170 6 $144,713 1 $42,660 0 $0 0 $0 FILES CLOSED FOR INCOMPLETENESS 0 $0 0 $0 3 $142,530 0 $0 0 $0 0 $0
Aggregated Statistics For Year 2006(Based on 1 partial tract) A) FHA, FSA/RHS & VA B) Conventional C) Refinancings D) Home Improvement Loans F) Non-occupant Loans on Number Average Value Number Average Value Number Average Value Number Average Value Number Average Value
LOANS ORIGINATED 1 $159,260 25 $121,646 28 $113,530 5 $32,724 3 $114,250 APPLICATIONS APPROVED, NOT ACCEPTED 0 $0 4 $111,685 7 $97,410 0 $0 1 $113,200 APPLICATIONS DENIED 0 $0 3 $145,197 20 $136,508 5 $46,104 1 $103,020 APPLICATIONS WITHDRAWN 0 $0 2 $149,805 14 $127,779 0 $0 0 $0 FILES CLOSED FOR INCOMPLETENESS 0 $0 1 $73,450 4 $174,770 0 $0 0 $0
Aggregated Statistics For Year 2005(Based on 1 partial tract) A) FHA, FSA/RHS & VA B) Conventional C) Refinancings D) Home Improvement Loans F) Non-occupant Loans on G) Loans On Manufactured Number Average Value Number Average Value Number Average Value Number Average Value Number Average Value Number Average Value
LOANS ORIGINATED 1 $199,500 30 $128,278 39 $127,297 4 $44,055 2 $118,535 0 $0 APPLICATIONS APPROVED, NOT ACCEPTED 0 $0 2 $114,900 9 $103,181 1 $55,750 0 $0 0 $0 APPLICATIONS DENIED 0 $0 4 $75,992 21 $130,804 5 $54,588 1 $121,440 1 $15,760 APPLICATIONS WITHDRAWN 0 $0 3 $169,680 15 $138,394 2 $117,445 1 $122,170 0 $0 FILES CLOSED FOR INCOMPLETENESS 0 $0 1 $74,170 4 $143,682 0 $0 0 $0 0 $0
Aggregated Statistics For Year 2004(Based on 1 partial tract) A) FHA, FSA/RHS & VA B) Conventional C) Refinancings D) Home Improvement Loans F) Non-occupant Loans on Number Average Value Number Average Value Number Average Value Number Average Value Number Average Value
LOANS ORIGINATED 1 $207,250 27 $124,863 41 $126,822 3 $37,167 2 $139,500 APPLICATIONS APPROVED, NOT ACCEPTED 0 $0 1 $173,560 9 $128,957 1 $26,180 0 $0 APPLICATIONS DENIED 1 $124,350 2 $94,415 26 $120,529 3 $50,257 0 $0 APPLICATIONS WITHDRAWN 0 $0 2 $140,470 17 $132,735 1 $30,300 1 $96,230 FILES CLOSED FOR INCOMPLETENESS 0 $0 0 $0 3 $142,290 1 $30,060 0 $0
Aggregated Statistics For Year 2003(Based on 1 partial tract) A) FHA, FSA/RHS & VA B) Conventional C) Refinancings D) Home Improvement Loans F) Non-occupant Loans on Number Average Value Number Average Value Number Average Value Number Average Value Number Average Value
LOANS ORIGINATED 2 $143,985 40 $134,665 115 $124,828 2 $31,755 5 $160,954 APPLICATIONS APPROVED, NOT ACCEPTED 0 $0 4 $104,050 14 $120,889 1 $18,660 1 $88,960 APPLICATIONS DENIED 0 $0 6 $88,435 24 $125,412 2 $8,365 0 $0 APPLICATIONS WITHDRAWN 0 $0 3 $151,340 13 $135,539 0 $0 1 $82,170 FILES CLOSED FOR INCOMPLETENESS 0 $0 1 $95,750 5 $133,756 0 $0 0 $0
Aggregated Statistics For Year 2002(Based on 1 partial tract) A) FHA, FSA/RHS & VA B) Conventional C) Refinancings D) Home Improvement Loans F) Non-occupant Loans on Number Average Value Number Average Value Number Average Value Number Average Value Number Average Value
LOANS ORIGINATED 2 $136,110 28 $127,771 85 $121,077 2 $58,295 1 $158,770 APPLICATIONS APPROVED, NOT ACCEPTED 0 $0 2 $102,900 13 $119,541 2 $20,120 0 $0 APPLICATIONS DENIED 0 $0 2 $83,630 21 $111,366 3 $18,423 1 $84,110 APPLICATIONS WITHDRAWN 0 $0 3 $102,777 13 $109,639 0 $0 1 $77,810 FILES CLOSED FOR INCOMPLETENESS 0 $0 1 $56,960 5 $109,808 0 $0 0 $0
Aggregated Statistics For Year 2001(Based on 1 partial tract) A) FHA, FSA/RHS & VA B) Conventional C) Refinancings D) Home Improvement Loans F) Non-occupant Loans on Number Average Value Number Average Value Number Average Value Number Average Value Number Average Value
LOANS ORIGINATED 1 $124,840 29 $115,332 82 $108,651 3 $18,180 2 $92,475 APPLICATIONS APPROVED, NOT ACCEPTED 0 $0 1 $129,680 10 $90,682 0 $0 0 $0 APPLICATIONS DENIED 0 $0 2 $80,960 25 $103,388 3 $21,977 1 $89,200 APPLICATIONS WITHDRAWN 0 $0 2 $136,230 11 $105,906 0 $0 0 $0 FILES CLOSED FOR INCOMPLETENESS 0 $0 0 $0 4 $116,472 0 $0 0 $0
Aggregated Statistics For Year 2000(Based on 1 partial tract) A) FHA, FSA/RHS & VA B) Conventional C) Refinancings D) Home Improvement Loans F) Non-occupant Loans on Number Average Value Number Average Value Number Average Value Number Average Value Number Average Value
LOANS ORIGINATED 3 $114,250 27 $113,730 21 $96,925 6 $14,747 2 $83,630 APPLICATIONS APPROVED, NOT ACCEPTED 0 $0 2 $157,195 8 $90,870 4 $29,452 0 $0 APPLICATIONS DENIED 0 $0 4 $92,415 14 $89,030 4 $15,512 0 $0 APPLICATIONS WITHDRAWN 0 $0 2 $62,055 6 $82,698 1 $74,420 0 $0 FILES CLOSED FOR INCOMPLETENESS 0 $0 0 $0 3 $91,870 0 $0 0 $0
Aggregated Statistics For Year 1999(Based on 1 partial tract) A) FHA, FSA/RHS & VA B) Conventional C) Refinancings D) Home Improvement Loans F) Non-occupant Loans on Number Average Value Number Average Value Number Average Value Number Average Value Number Average Value
LOANS ORIGINATED 2 $108,205 30 $116,934 41 $100,359 6 $14,145 1 $95,030 APPLICATIONS APPROVED, NOT ACCEPTED 0 $0 1 $184,740 8 $97,264 2 $19,465 0 $0 APPLICATIONS DENIED 0 $0 4 $90,555 11 $100,676 7 $12,124 0 $0 APPLICATIONS WITHDRAWN 0 $0 2 $90,070 6 $87,048 2 $80,880 0 $0 FILES CLOSED FOR INCOMPLETENESS 0 $0 0 $0 2 $98,290 0 $0 0 $0
Detailed HMDA statistics for the following Tracts:
0088.00
Private Mortgage Insurance Companies Aggregated Statistics For Year 2009(Based on 1 partial tract) A) Conventional B) Refinancings Number Average Value Number Average Value
LOANS ORIGINATED 2 $117,320 1 $248,940 APPLICATIONS APPROVED, NOT ACCEPTED 0 $0 0 $0 APPLICATIONS DENIED 0 $0 0 $0 APPLICATIONS WITHDRAWN 0 $0 0 $0 FILES CLOSED FOR INCOMPLETENESS 0 $0 0 $0
Aggregated Statistics For Year 2008(Based on 1 partial tract) A) Conventional B) Refinancings Number Average Value Number Average Value
LOANS ORIGINATED 3 $128,230 2 $122,895 APPLICATIONS APPROVED, NOT ACCEPTED 0 $0 1 $176,220 APPLICATIONS DENIED 0 $0 0 $0 APPLICATIONS WITHDRAWN 0 $0 0 $0 FILES CLOSED FOR INCOMPLETENESS 0 $0 0 $0
Aggregated Statistics For Year 2007(Based on 1 partial tract) A) Conventional B) Refinancings Number Average Value Number Average Value
LOANS ORIGINATED 9 $142,181 2 $143,985 APPLICATIONS APPROVED, NOT ACCEPTED 1 $154,650 0 $0 APPLICATIONS DENIED 0 $0 0 $0 APPLICATIONS WITHDRAWN 0 $0 0 $0 FILES CLOSED FOR INCOMPLETENESS 0 $0 0 $0
Aggregated Statistics For Year 2006(Based on 1 partial tract) A) Conventional B) Refinancings Number Average Value Number Average Value
LOANS ORIGINATED 6 $138,773 2 $238,765 APPLICATIONS APPROVED, NOT ACCEPTED 1 $99,380 2 $132,835 APPLICATIONS DENIED 0 $0 0 $0 APPLICATIONS WITHDRAWN 0 $0 1 $185,440 FILES CLOSED FOR INCOMPLETENESS 0 $0 0 $0
Aggregated Statistics For Year 2005(Based on 1 partial tract) A) Conventional B) Refinancings Number Average Value Number Average Value
LOANS ORIGINATED 6 $152,308 4 $170,225 APPLICATIONS APPROVED, NOT ACCEPTED 1 $133,320 1 $176,710 APPLICATIONS DENIED 0 $0 0 $0 APPLICATIONS WITHDRAWN 0 $0 0 $0 FILES CLOSED FOR INCOMPLETENESS 0 $0 0 $0
Aggregated Statistics For Year 2004(Based on 1 partial tract) A) Conventional B) Refinancings Number Average Value Number Average Value
LOANS ORIGINATED 8 $150,379 2 $117,805 APPLICATIONS APPROVED, NOT ACCEPTED 0 $0 2 $193,070 APPLICATIONS DENIED 0 $0 0 $0 APPLICATIONS WITHDRAWN 0 $0 0 $0 FILES CLOSED FOR INCOMPLETENESS 0 $0 0 $0
Aggregated Statistics For Year 2003(Based on 1 partial tract) A) Conventional B) Refinancings Number Average Value Number Average Value
LOANS ORIGINATED 11 $145,947 13 $149,206 APPLICATIONS APPROVED, NOT ACCEPTED 2 $129,080 2 $141,685 APPLICATIONS DENIED 0 $0 0 $0 APPLICATIONS WITHDRAWN 0 $0 0 $0 FILES CLOSED FOR INCOMPLETENESS 0 $0 0 $0
Aggregated Statistics For Year 2002(Based on 1 partial tract) A) Conventional B) Refinancings Number Average Value Number Average Value
LOANS ORIGINATED 8 $143,744 9 $138,410 APPLICATIONS APPROVED, NOT ACCEPTED 2 $191,130 3 $127,583 APPLICATIONS DENIED 0 $0 0 $0 APPLICATIONS WITHDRAWN 0 $0 0 $0 FILES CLOSED FOR INCOMPLETENESS 0 $0 0 $0
Aggregated Statistics For Year 2001(Based on 1 partial tract) A) Conventional B) Refinancings Number Average Value Number Average Value
LOANS ORIGINATED 8 $127,200 8 $121,472 APPLICATIONS APPROVED, NOT ACCEPTED 0 $0 3 $134,210 APPLICATIONS DENIED 0 $0 0 $0 APPLICATIONS WITHDRAWN 0 $0 0 $0 FILES CLOSED FOR INCOMPLETENESS 0 $0 0 $0
Aggregated Statistics For Year 2000(Based on 1 partial tract) A) Conventional B) Refinancings Number Average Value Number Average Value
LOANS ORIGINATED 7 $121,200 0 $0 APPLICATIONS APPROVED, NOT ACCEPTED 1 $131,380 1 $109,320 APPLICATIONS DENIED 0 $0 0 $0 APPLICATIONS WITHDRAWN 0 $0 0 $0 FILES CLOSED FOR INCOMPLETENESS 0 $0 0 $0
Aggregated Statistics For Year 1999(Based on 1 partial tract) A) Conventional B) Refinancings C) Non-occupant Loans on Number Average Value Number Average Value Number Average Value
LOANS ORIGINATED 8 $128,970 4 $114,735 1 $45,220 APPLICATIONS APPROVED, NOT ACCEPTED 1 $116,550 1 $133,960 0 $0 APPLICATIONS DENIED 0 $0 0 $0 0 $0 APPLICATIONS WITHDRAWN 0 $0 0 $0 0 $0 FILES CLOSED FOR INCOMPLETENESS 0 $0 0 $0 0 $0
Detailed PMIC statistics for the following Tracts:
0088.00
Fire-safe hotels and motels in Holland, Ohio:
Econo Lodge, 1201 E Mall Dr, Holland, Ohio 43528 Phone: (419) 866-6565, Fax: (419) 866-6608
Hawthorn Suites Toledo/Holland, 6101 Trust Dr, Holland, Ohio 43528 Phone: (419) 867-9555, Fax: (419) 867-9475
Quality Inn Toledo Holland, 1401 E Mall Dr, Holland, Ohio 43528 Phone: (419) 867-1144, Fax: (419) 867-1260
Extended Stay America - Toledo - Holland, 6155 W Trust Dr, Holland, Ohio 43528 Phone: (419) 861-1133, Fax: (419) 861-1144
All 4 fire-safe hotels and motels in Holland, Ohio
Most common first names in Holland, OH among deceased individuals Name Count Lived (average)
Mary 89 79.2 years John 83 73.7 years Robert 74 70.5 years James 57 70.9 years William 56 73.6 years Helen 55 82.4 years Charles 47 74.0 years Edward 41 70.7 years George 40 74.5 years Joseph 38 75.6 years
Most common last names in Holland, OH among deceased individuals Last name Count Lived (average)
Johnson 27 78.2 years Smith 24 75.6 years Davis 19 75.6 years Miller 19 75.1 years Williams 18 77.6 years Brown 16 80.0 years Hall 15 78.7 years Jones 12 68.8 years Anderson 12 71.2 years Campbell 10 74.1 years
Holland compared to Ohio state average:
Unemployed percentage significantly below state average. Hispanic race population percentage above state average. Median age above state average. Length of stay since moving in above state average. Institutionalized population percentage above state average. Number of college students below state average.
#59 on the list of "Top 101 cities with the most residents born in Iraq (population 500+)"
#10 on the list of "Top 101 counties with the largest number of people moving out compared to moving in (pop. 50,000+)"
#43 on the list of "Top 101 counties with the highest number of infant deaths per 1000 residents 2007-2013 (pop. 50,000+)"
#50 on the list of "Top 101 counties with the lowest percentage of residents relocating to foreign countries in 2011"
#53 on the list of "Top 101 counties with the lowest percentage of residents relocating from foreign countries between 2010 and 2011"
#54 on the list of "Top 101 counties with the lowest percentage of residents relocating from other counties between 2010 and 2011 (pop. 50,000+)"
Top Patent Applicants
Jeffrey T. Boehler (18)
Frank E. Semersky (11)
Vijay K. Goel (11)
Alvin D. Compaan (7)
Oleg Grinevich (7)
James P. Schnabel, Jr. (6)
Michael A. Doyle (5)
Jay D. Wagner (4)
Quazi Ehtesham Hussain (4)
Darin M. Pugne (4)
Total of 183 patent applications in 2008-2024.


 Recent articles from our blog. Our writers, many of them Ph.D. graduates or candidates, create easy-to-read articles on a wide variety of topics.

 (7.7 miles
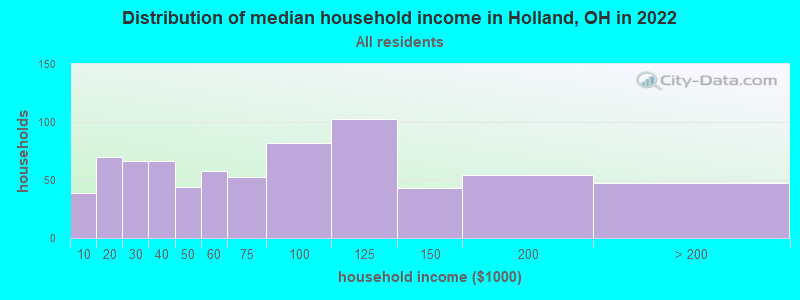


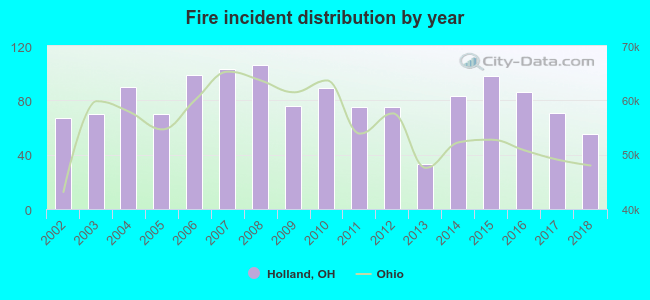 Based on the data from the years 2002 - 2018 the average number of fire incidents per year is 79. The highest number of fires - 106 took place in 2008, and the least - 33 in 2013. The data has a dropping trend.
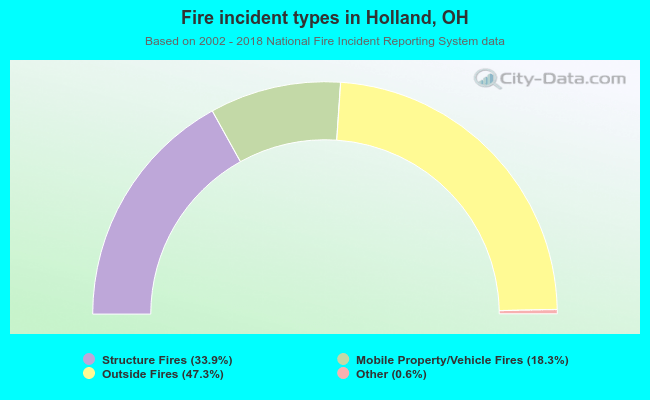 When looking into fire subcategories, the most incidents belonged to: Outside Fires (47.3%), and Structure Fires (33.9%).