Industry, California Submit your own pictures of this city and show them to the world
OSM Map
General Map
Google Map
MSN Map
OSM Map
General Map
Google Map
MSN Map
OSM Map
General Map
Google Map
MSN Map
OSM Map
General Map
Google Map
MSN Map
Please wait while loading the map...
Population in 2022: 255 (100% urban, 0% rural). Population change since 2000: -67.2%Males: 144 Females: 111
March 2022 cost of living index in Industry: 139.5 (high, U.S. average is 100) Percentage of residents living in poverty in 2022: 12.7%for White Non-Hispanic residents , 100.0% for Black residents , 9.2% for Hispanic or Latino residents , 7.8% for other race residents )
Profiles of local businesses
Business Search - 14 Million verified businesses
Data:
Median household income ($)
Median household income (% change since 2000)
Household income diversity
Ratio of average income to average house value (%)
Ratio of average income to average rent
Median household income ($) - White
Median household income ($) - Black or African American
Median household income ($) - Asian
Median household income ($) - Hispanic or Latino
Median household income ($) - American Indian and Alaska Native
Median household income ($) - Multirace
Median household income ($) - Other Race
Median household income for houses/condos with a mortgage ($)
Median household income for apartments without a mortgage ($)
Races - White alone (%)
Races - White alone (% change since 2000)
Races - Black alone (%)
Races - Black alone (% change since 2000)
Races - American Indian alone (%)
Races - American Indian alone (% change since 2000)
Races - Asian alone (%)
Races - Asian alone (% change since 2000)
Races - Hispanic (%)
Races - Hispanic (% change since 2000)
Races - Native Hawaiian and Other Pacific Islander alone (%)
Races - Native Hawaiian and Other Pacific Islander alone (% change since 2000)
Races - Two or more races (%)
Races - Two or more races (% change since 2000)
Races - Other race alone (%)
Races - Other race alone (% change since 2000)
Racial diversity
Unemployment (%)
Unemployment (% change since 2000)
Unemployment (%) - White
Unemployment (%) - Black or African American
Unemployment (%) - Asian
Unemployment (%) - Hispanic or Latino
Unemployment (%) - American Indian and Alaska Native
Unemployment (%) - Multirace
Unemployment (%) - Other Race
Population density (people per square mile)
Population - Males (%)
Population - Females (%)
Population - Males (%) - White
Population - Males (%) - Black or African American
Population - Males (%) - Asian
Population - Males (%) - Hispanic or Latino
Population - Males (%) - American Indian and Alaska Native
Population - Males (%) - Multirace
Population - Males (%) - Other Race
Population - Females (%) - White
Population - Females (%) - Black or African American
Population - Females (%) - Asian
Population - Females (%) - Hispanic or Latino
Population - Females (%) - American Indian and Alaska Native
Population - Females (%) - Multirace
Population - Females (%) - Other Race
Coronavirus confirmed cases (Apr 23, 2024)
Deaths caused by coronavirus (Apr 23, 2024)
Coronavirus confirmed cases (per 100k population) (Apr 23, 2024)
Deaths caused by coronavirus (per 100k population) (Apr 23, 2024)
Daily increase in number of cases (Apr 23, 2024)
Weekly increase in number of cases (Apr 23, 2024)
Cases doubled (in days) (Apr 23, 2024)
Hospitalized patients (Apr 18, 2022)
Negative test results (Apr 18, 2022)
Total test results (Apr 18, 2022)
COVID Vaccine doses distributed (per 100k population) (Sep 19, 2023)
COVID Vaccine doses administered (per 100k population) (Sep 19, 2023)
COVID Vaccine doses distributed (Sep 19, 2023)
COVID Vaccine doses administered (Sep 19, 2023)
Likely homosexual households (%)
Likely homosexual households (% change since 2000)
Likely homosexual households - Lesbian couples (%)
Likely homosexual households - Lesbian couples (% change since 2000)
Likely homosexual households - Gay men (%)
Likely homosexual households - Gay men (% change since 2000)
Cost of living index
Median gross rent ($)
Median contract rent ($)
Median monthly housing costs ($)
Median house or condo value ($)
Median house or condo value ($ change since 2000)
Mean house or condo value by units in structure - 1, detached ($)
Mean house or condo value by units in structure - 1, attached ($)
Mean house or condo value by units in structure - 2 ($)
Mean house or condo value by units in structure by units in structure - 3 or 4 ($)
Mean house or condo value by units in structure - 5 or more ($)
Mean house or condo value by units in structure - Boat, RV, van, etc. ($)
Mean house or condo value by units in structure - Mobile home ($)
Median house or condo value ($) - White
Median house or condo value ($) - Black or African American
Median house or condo value ($) - Asian
Median house or condo value ($) - Hispanic or Latino
Median house or condo value ($) - American Indian and Alaska Native
Median house or condo value ($) - Multirace
Median house or condo value ($) - Other Race
Median resident age
Resident age diversity
Median resident age - Males
Median resident age - Females
Median resident age - White
Median resident age - Black or African American
Median resident age - Asian
Median resident age - Hispanic or Latino
Median resident age - American Indian and Alaska Native
Median resident age - Multirace
Median resident age - Other Race
Median resident age - Males - White
Median resident age - Males - Black or African American
Median resident age - Males - Asian
Median resident age - Males - Hispanic or Latino
Median resident age - Males - American Indian and Alaska Native
Median resident age - Males - Multirace
Median resident age - Males - Other Race
Median resident age - Females - White
Median resident age - Females - Black or African American
Median resident age - Females - Asian
Median resident age - Females - Hispanic or Latino
Median resident age - Females - American Indian and Alaska Native
Median resident age - Females - Multirace
Median resident age - Females - Other Race
Commute - mean travel time to work (minutes)
Travel time to work - Less than 5 minutes (%)
Travel time to work - Less than 5 minutes (% change since 2000)
Travel time to work - 5 to 9 minutes (%)
Travel time to work - 5 to 9 minutes (% change since 2000)
Travel time to work - 10 to 19 minutes (%)
Travel time to work - 10 to 19 minutes (% change since 2000)
Travel time to work - 20 to 29 minutes (%)
Travel time to work - 20 to 29 minutes (% change since 2000)
Travel time to work - 30 to 39 minutes (%)
Travel time to work - 30 to 39 minutes (% change since 2000)
Travel time to work - 40 to 59 minutes (%)
Travel time to work - 40 to 59 minutes (% change since 2000)
Travel time to work - 60 to 89 minutes (%)
Travel time to work - 60 to 89 minutes (% change since 2000)
Travel time to work - 90 or more minutes (%)
Travel time to work - 90 or more minutes (% change since 2000)
Marital status - Never married (%)
Marital status - Now married (%)
Marital status - Separated (%)
Marital status - Widowed (%)
Marital status - Divorced (%)
Median family income ($)
Median family income (% change since 2000)
Median non-family income ($)
Median non-family income (% change since 2000)
Median per capita income ($)
Median per capita income (% change since 2000)
Median family income ($) - White
Median family income ($) - Black or African American
Median family income ($) - Asian
Median family income ($) - Hispanic or Latino
Median family income ($) - American Indian and Alaska Native
Median family income ($) - Multirace
Median family income ($) - Other Race
Median year house/condo built
Median year apartment built
Year house built - Built 2005 or later (%)
Year house built - Built 2000 to 2004 (%)
Year house built - Built 1990 to 1999 (%)
Year house built - Built 1980 to 1989 (%)
Year house built - Built 1970 to 1979 (%)
Year house built - Built 1960 to 1969 (%)
Year house built - Built 1950 to 1959 (%)
Year house built - Built 1940 to 1949 (%)
Year house built - Built 1939 or earlier (%)
Average household size
Household density (households per square mile)
Average household size - White
Average household size - Black or African American
Average household size - Asian
Average household size - Hispanic or Latino
Average household size - American Indian and Alaska Native
Average household size - Multirace
Average household size - Other Race
Occupied housing units (%)
Vacant housing units (%)
Owner occupied housing units (%)
Renter occupied housing units (%)
Vacancy status - For rent (%)
Vacancy status - For sale only (%)
Vacancy status - Rented or sold, not occupied (%)
Vacancy status - For seasonal, recreational, or occasional use (%)
Vacancy status - For migrant workers (%)
Vacancy status - Other vacant (%)
Residents with income below the poverty level (%)
Residents with income below 50% of the poverty level (%)
Children below poverty level (%)
Poor families by family type - Married-couple family (%)
Poor families by family type - Male, no wife present (%)
Poor families by family type - Female, no husband present (%)
Poverty status for native-born residents (%)
Poverty status for foreign-born residents (%)
Poverty among high school graduates not in families (%)
Poverty among people who did not graduate high school not in families (%)
Residents with income below the poverty level (%) - White
Residents with income below the poverty level (%) - Black or African American
Residents with income below the poverty level (%) - Asian
Residents with income below the poverty level (%) - Hispanic or Latino
Residents with income below the poverty level (%) - American Indian and Alaska Native
Residents with income below the poverty level (%) - Multirace
Residents with income below the poverty level (%) - Other Race
Air pollution - Air Quality Index (AQI)
Air pollution - CO
Air pollution - NO2
Air pollution - SO2
Air pollution - Ozone
Air pollution - PM10
Air pollution - PM25
Air pollution - Pb
Crime - Murders per 100,000 population
Crime - Rapes per 100,000 population
Crime - Robberies per 100,000 population
Crime - Assaults per 100,000 population
Crime - Burglaries per 100,000 population
Crime - Thefts per 100,000 population
Crime - Auto thefts per 100,000 population
Crime - Arson per 100,000 population
Crime - City-data.com crime index
Crime - Violent crime index
Crime - Property crime index
Crime - Murders per 100,000 population (5 year average)
Crime - Rapes per 100,000 population (5 year average)
Crime - Robberies per 100,000 population (5 year average)
Crime - Assaults per 100,000 population (5 year average)
Crime - Burglaries per 100,000 population (5 year average)
Crime - Thefts per 100,000 population (5 year average)
Crime - Auto thefts per 100,000 population (5 year average)
Crime - Arson per 100,000 population (5 year average)
Crime - City-data.com crime index (5 year average)
Crime - Violent crime index (5 year average)
Crime - Property crime index (5 year average)
1996 Presidential Elections Results (%) - Democratic Party (Clinton)
1996 Presidential Elections Results (%) - Republican Party (Dole)
1996 Presidential Elections Results (%) - Other
2000 Presidential Elections Results (%) - Democratic Party (Gore)
2000 Presidential Elections Results (%) - Republican Party (Bush)
2000 Presidential Elections Results (%) - Other
2004 Presidential Elections Results (%) - Democratic Party (Kerry)
2004 Presidential Elections Results (%) - Republican Party (Bush)
2004 Presidential Elections Results (%) - Other
2008 Presidential Elections Results (%) - Democratic Party (Obama)
2008 Presidential Elections Results (%) - Republican Party (McCain)
2008 Presidential Elections Results (%) - Other
2012 Presidential Elections Results (%) - Democratic Party (Obama)
2012 Presidential Elections Results (%) - Republican Party (Romney)
2012 Presidential Elections Results (%) - Other
2016 Presidential Elections Results (%) - Democratic Party (Clinton)
2016 Presidential Elections Results (%) - Republican Party (Trump)
2016 Presidential Elections Results (%) - Other
2020 Presidential Elections Results (%) - Democratic Party (Biden)
2020 Presidential Elections Results (%) - Republican Party (Trump)
2020 Presidential Elections Results (%) - Other
Ancestries Reported - Arab (%)
Ancestries Reported - Czech (%)
Ancestries Reported - Danish (%)
Ancestries Reported - Dutch (%)
Ancestries Reported - English (%)
Ancestries Reported - French (%)
Ancestries Reported - French Canadian (%)
Ancestries Reported - German (%)
Ancestries Reported - Greek (%)
Ancestries Reported - Hungarian (%)
Ancestries Reported - Irish (%)
Ancestries Reported - Italian (%)
Ancestries Reported - Lithuanian (%)
Ancestries Reported - Norwegian (%)
Ancestries Reported - Polish (%)
Ancestries Reported - Portuguese (%)
Ancestries Reported - Russian (%)
Ancestries Reported - Scotch-Irish (%)
Ancestries Reported - Scottish (%)
Ancestries Reported - Slovak (%)
Ancestries Reported - Subsaharan African (%)
Ancestries Reported - Swedish (%)
Ancestries Reported - Swiss (%)
Ancestries Reported - Ukrainian (%)
Ancestries Reported - United States (%)
Ancestries Reported - Welsh (%)
Ancestries Reported - West Indian (%)
Ancestries Reported - Other (%)
Educational Attainment - No schooling completed (%)
Educational Attainment - Less than high school (%)
Educational Attainment - High school or equivalent (%)
Educational Attainment - Less than 1 year of college (%)
Educational Attainment - 1 or more years of college (%)
Educational Attainment - Associate degree (%)
Educational Attainment - Bachelor's degree (%)
Educational Attainment - Master's degree (%)
Educational Attainment - Professional school degree (%)
Educational Attainment - Doctorate degree (%)
School Enrollment - Nursery, preschool (%)
School Enrollment - Kindergarten (%)
School Enrollment - Grade 1 to 4 (%)
School Enrollment - Grade 5 to 8 (%)
School Enrollment - Grade 9 to 12 (%)
School Enrollment - College undergrad (%)
School Enrollment - Graduate or professional (%)
School Enrollment - Not enrolled in school (%)
School enrollment - Public schools (%)
School enrollment - Private schools (%)
School enrollment - Not enrolled (%)
Median number of rooms in houses and condos
Median number of rooms in apartments
Housing units lacking complete plumbing facilities (%)
Housing units lacking complete kitchen facilities (%)
Density of houses
Urban houses (%)
Rural houses (%)
Households with people 60 years and over (%)
Households with people 65 years and over (%)
Households with people 75 years and over (%)
Households with one or more nonrelatives (%)
Households with no nonrelatives (%)
Population in households (%)
Family households (%)
Nonfamily households (%)
Population in families (%)
Family households with own children (%)
Median number of bedrooms in owner occupied houses
Mean number of bedrooms in owner occupied houses
Median number of bedrooms in renter occupied houses
Mean number of bedrooms in renter occupied houses
Median number of vehichles in owner occupied houses
Mean number of vehichles in owner occupied houses
Median number of vehichles in renter occupied houses
Mean number of vehichles in renter occupied houses
Mortgage status - with mortgage (%)
Mortgage status - with second mortgage (%)
Mortgage status - with home equity loan (%)
Mortgage status - with both second mortgage and home equity loan (%)
Mortgage status - without a mortgage (%)
Average family size
Average family size - White
Average family size - Black or African American
Average family size - Asian
Average family size - Hispanic or Latino
Average family size - American Indian and Alaska Native
Average family size - Multirace
Average family size - Other Race
Geographical mobility - Same house 1 year ago (%)
Geographical mobility - Moved within same county (%)
Geographical mobility - Moved from different county within same state (%)
Geographical mobility - Moved from different state (%)
Geographical mobility - Moved from abroad (%)
Place of birth - Born in state of residence (%)
Place of birth - Born in other state (%)
Place of birth - Native, outside of US (%)
Place of birth - Foreign born (%)
Housing units in structures - 1, detached (%)
Housing units in structures - 1, attached (%)
Housing units in structures - 2 (%)
Housing units in structures - 3 or 4 (%)
Housing units in structures - 5 to 9 (%)
Housing units in structures - 10 to 19 (%)
Housing units in structures - 20 to 49 (%)
Housing units in structures - 50 or more (%)
Housing units in structures - Mobile home (%)
Housing units in structures - Boat, RV, van, etc. (%)
House/condo owner moved in on average (years ago)
Renter moved in on average (years ago)
Year householder moved into unit - Moved in 1999 to March 2000 (%)
Year householder moved into unit - Moved in 1995 to 1998 (%)
Year householder moved into unit - Moved in 1990 to 1994 (%)
Year householder moved into unit - Moved in 1980 to 1989 (%)
Year householder moved into unit - Moved in 1970 to 1979 (%)
Year householder moved into unit - Moved in 1969 or earlier (%)
Means of transportation to work - Drove car alone (%)
Means of transportation to work - Carpooled (%)
Means of transportation to work - Public transportation (%)
Means of transportation to work - Bus or trolley bus (%)
Means of transportation to work - Streetcar or trolley car (%)
Means of transportation to work - Subway or elevated (%)
Means of transportation to work - Railroad (%)
Means of transportation to work - Ferryboat (%)
Means of transportation to work - Taxicab (%)
Means of transportation to work - Motorcycle (%)
Means of transportation to work - Bicycle (%)
Means of transportation to work - Walked (%)
Means of transportation to work - Other means (%)
Working at home (%)
Industry diversity
Most Common Industries - Agriculture, forestry, fishing and hunting, and mining (%)
Most Common Industries - Agriculture, forestry, fishing and hunting (%)
Most Common Industries - Mining, quarrying, and oil and gas extraction (%)
Most Common Industries - Construction (%)
Most Common Industries - Manufacturing (%)
Most Common Industries - Wholesale trade (%)
Most Common Industries - Retail trade (%)
Most Common Industries - Transportation and warehousing, and utilities (%)
Most Common Industries - Transportation and warehousing (%)
Most Common Industries - Utilities (%)
Most Common Industries - Information (%)
Most Common Industries - Finance and insurance, and real estate and rental and leasing (%)
Most Common Industries - Finance and insurance (%)
Most Common Industries - Real estate and rental and leasing (%)
Most Common Industries - Professional, scientific, and management, and administrative and waste management services (%)
Most Common Industries - Professional, scientific, and technical services (%)
Most Common Industries - Management of companies and enterprises (%)
Most Common Industries - Administrative and support and waste management services (%)
Most Common Industries - Educational services, and health care and social assistance (%)
Most Common Industries - Educational services (%)
Most Common Industries - Health care and social assistance (%)
Most Common Industries - Arts, entertainment, and recreation, and accommodation and food services (%)
Most Common Industries - Arts, entertainment, and recreation (%)
Most Common Industries - Accommodation and food services (%)
Most Common Industries - Other services, except public administration (%)
Most Common Industries - Public administration (%)
Occupation diversity
Most Common Occupations - Management, business, science, and arts occupations (%)
Most Common Occupations - Management, business, and financial occupations (%)
Most Common Occupations - Management occupations (%)
Most Common Occupations - Business and financial operations occupations (%)
Most Common Occupations - Computer, engineering, and science occupations (%)
Most Common Occupations - Computer and mathematical occupations (%)
Most Common Occupations - Architecture and engineering occupations (%)
Most Common Occupations - Life, physical, and social science occupations (%)
Most Common Occupations - Education, legal, community service, arts, and media occupations (%)
Most Common Occupations - Community and social service occupations (%)
Most Common Occupations - Legal occupations (%)
Most Common Occupations - Education, training, and library occupations (%)
Most Common Occupations - Arts, design, entertainment, sports, and media occupations (%)
Most Common Occupations - Healthcare practitioners and technical occupations (%)
Most Common Occupations - Health diagnosing and treating practitioners and other technical occupations (%)
Most Common Occupations - Health technologists and technicians (%)
Most Common Occupations - Service occupations (%)
Most Common Occupations - Healthcare support occupations (%)
Most Common Occupations - Protective service occupations (%)
Most Common Occupations - Fire fighting and prevention, and other protective service workers including supervisors (%)
Most Common Occupations - Law enforcement workers including supervisors (%)
Most Common Occupations - Food preparation and serving related occupations (%)
Most Common Occupations - Building and grounds cleaning and maintenance occupations (%)
Most Common Occupations - Personal care and service occupations (%)
Most Common Occupations - Sales and office occupations (%)
Most Common Occupations - Sales and related occupations (%)
Most Common Occupations - Office and administrative support occupations (%)
Most Common Occupations - Natural resources, construction, and maintenance occupations (%)
Most Common Occupations - Farming, fishing, and forestry occupations (%)
Most Common Occupations - Construction and extraction occupations (%)
Most Common Occupations - Installation, maintenance, and repair occupations (%)
Most Common Occupations - Production, transportation, and material moving occupations (%)
Most Common Occupations - Production occupations (%)
Most Common Occupations - Transportation occupations (%)
Most Common Occupations - Material moving occupations (%)
People in Group quarters - Institutionalized population (%)
People in Group quarters - Correctional institutions (%)
People in Group quarters - Federal prisons and detention centers (%)
People in Group quarters - Halfway houses (%)
People in Group quarters - Local jails and other confinement facilities (including police lockups) (%)
People in Group quarters - Military disciplinary barracks (%)
People in Group quarters - State prisons (%)
People in Group quarters - Other types of correctional institutions (%)
People in Group quarters - Nursing homes (%)
People in Group quarters - Hospitals/wards, hospices, and schools for the handicapped (%)
People in Group quarters - Hospitals/wards and hospices for chronically ill (%)
People in Group quarters - Hospices or homes for chronically ill (%)
People in Group quarters - Military hospitals or wards for chronically ill (%)
People in Group quarters - Other hospitals or wards for chronically ill (%)
People in Group quarters - Hospitals or wards for drug/alcohol abuse (%)
People in Group quarters - Mental (Psychiatric) hospitals or wards (%)
People in Group quarters - Schools, hospitals, or wards for the mentally retarded (%)
People in Group quarters - Schools, hospitals, or wards for the physically handicapped (%)
People in Group quarters - Institutions for the deaf (%)
People in Group quarters - Institutions for the blind (%)
People in Group quarters - Orthopedic wards and institutions for the physically handicapped (%)
People in Group quarters - Wards in general hospitals for patients who have no usual home elsewhere (%)
People in Group quarters - Wards in military hospitals for patients who have no usual home elsewhere (%)
People in Group quarters - Juvenile institutions (%)
People in Group quarters - Long-term care (%)
People in Group quarters - Homes for abused, dependent, and neglected children (%)
People in Group quarters - Residential treatment centers for emotionally disturbed children (%)
People in Group quarters - Training schools for juvenile delinquents (%)
People in Group quarters - Short-term care, detention or diagnostic centers for delinquent children (%)
People in Group quarters - Type of juvenile institution unknown (%)
People in Group quarters - Noninstitutionalized population (%)
People in Group quarters - College dormitories (includes college quarters off campus) (%)
People in Group quarters - Military quarters (%)
People in Group quarters - On base (%)
People in Group quarters - Barracks, unaccompanied personnel housing (UPH), (Enlisted/Officer), ;and similar group living quarters for military personnel (%)
People in Group quarters - Transient quarters for temporary residents (%)
People in Group quarters - Military ships (%)
People in Group quarters - Group homes (%)
People in Group quarters - Homes or halfway houses for drug/alcohol abuse (%)
People in Group quarters - Homes for the mentally ill (%)
People in Group quarters - Homes for the mentally retarded (%)
People in Group quarters - Homes for the physically handicapped (%)
People in Group quarters - Other group homes (%)
People in Group quarters - Religious group quarters (%)
People in Group quarters - Dormitories (%)
People in Group quarters - Agriculture workers' dormitories on farms (%)
People in Group quarters - Job Corps and vocational training facilities (%)
People in Group quarters - Other workers' dormitories (%)
People in Group quarters - Crews of maritime vessels (%)
People in Group quarters - Other nonhousehold living situations (%)
People in Group quarters - Other noninstitutional group quarters (%)
Residents speaking English at home (%)
Residents speaking English at home - Born in the United States (%)
Residents speaking English at home - Native, born elsewhere (%)
Residents speaking English at home - Foreign born (%)
Residents speaking Spanish at home (%)
Residents speaking Spanish at home - Born in the United States (%)
Residents speaking Spanish at home - Native, born elsewhere (%)
Residents speaking Spanish at home - Foreign born (%)
Residents speaking other language at home (%)
Residents speaking other language at home - Born in the United States (%)
Residents speaking other language at home - Native, born elsewhere (%)
Residents speaking other language at home - Foreign born (%)
Class of Workers - Employee of private company (%)
Class of Workers - Self-employed in own incorporated business (%)
Class of Workers - Private not-for-profit wage and salary workers (%)
Class of Workers - Local government workers (%)
Class of Workers - State government workers (%)
Class of Workers - Federal government workers (%)
Class of Workers - Self-employed workers in own not incorporated business and Unpaid family workers (%)
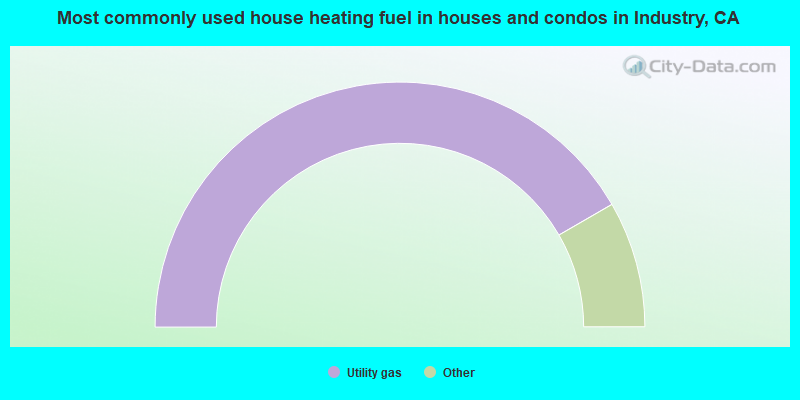
House heating fuel used in houses and condos - Utility gas (%)
House heating fuel used in houses and condos - Bottled, tank, or LP gas (%)
House heating fuel used in houses and condos - Electricity (%)
House heating fuel used in houses and condos - Fuel oil, kerosene, etc. (%)
House heating fuel used in houses and condos - Coal or coke (%)
House heating fuel used in houses and condos - Wood (%)
House heating fuel used in houses and condos - Solar energy (%)
House heating fuel used in houses and condos - Other fuel (%)
House heating fuel used in houses and condos - No fuel used (%)
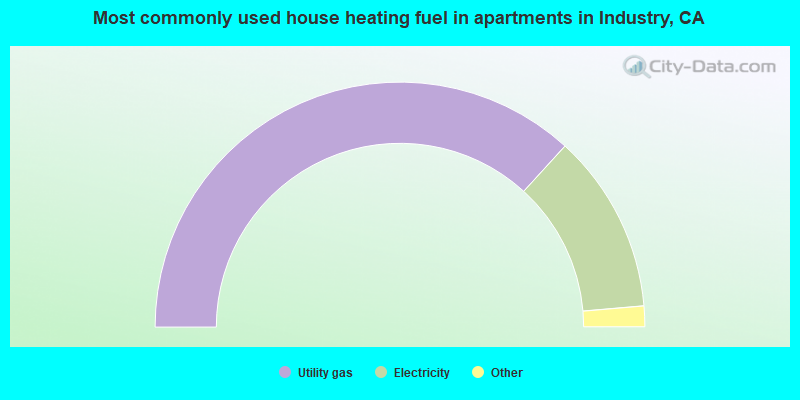
House heating fuel used in apartments - Utility gas (%)
House heating fuel used in apartments - Bottled, tank, or LP gas (%)
House heating fuel used in apartments - Electricity (%)
House heating fuel used in apartments - Fuel oil, kerosene, etc. (%)
House heating fuel used in apartments - Coal or coke (%)
House heating fuel used in apartments - Wood (%)
House heating fuel used in apartments - Solar energy (%)
House heating fuel used in apartments - Other fuel (%)
House heating fuel used in apartments - No fuel used (%)
Armed forces status - In Armed Forces (%)
Armed forces status - Civilian (%)
Armed forces status - Civilian - Veteran (%)
Armed forces status - Civilian - Nonveteran (%)
Fatal accidents locations in years 2005-2021
Fatal accidents locations in 2005
Fatal accidents locations in 2006
Fatal accidents locations in 2007
Fatal accidents locations in 2008
Fatal accidents locations in 2009
Fatal accidents locations in 2010
Fatal accidents locations in 2011
Fatal accidents locations in 2012
Fatal accidents locations in 2013
Fatal accidents locations in 2014
Fatal accidents locations in 2015
Fatal accidents locations in 2016
Fatal accidents locations in 2017
Fatal accidents locations in 2018
Fatal accidents locations in 2019
Fatal accidents locations in 2020
Fatal accidents locations in 2021
Alcohol use - People drinking some alcohol every month (%)
Alcohol use - People not drinking at all (%)
Alcohol use - Average days/month drinking alcohol
Alcohol use - Average drinks/week
Alcohol use - Average days/year people drink much
Audiometry - Average condition of hearing (%)
Audiometry - People that can hear a whisper from across a quiet room (%)
Audiometry - People that can hear normal voice from across a quiet room (%)
Audiometry - Ears ringing, roaring, buzzing (%)
Audiometry - Had a job exposure to loud noise (%)
Audiometry - Had off-work exposure to loud noise (%)
Blood Pressure & Cholesterol - Has high blood pressure (%)
Blood Pressure & Cholesterol - Checking blood pressure at home (%)
Blood Pressure & Cholesterol - Frequently checking blood cholesterol (%)
Blood Pressure & Cholesterol - Has high cholesterol level (%)
Consumer Behavior - Money monthly spent on food at supermarket/grocery store
Consumer Behavior - Money monthly spent on food at other stores
Consumer Behavior - Money monthly spent on eating out
Consumer Behavior - Money monthly spent on carryout/delivered foods
Consumer Behavior - Income spent on food at supermarket/grocery store (%)
Consumer Behavior - Income spent on food at other stores (%)
Consumer Behavior - Income spent on eating out (%)
Consumer Behavior - Income spent on carryout/delivered foods (%)
Current Health Status - General health condition (%)
Current Health Status - Blood donors (%)
Current Health Status - Has blood ever tested for HIV virus (%)
Current Health Status - Left-handed people (%)
Dermatology - People using sunscreen (%)
Diabetes - Diabetics (%)
Diabetes - Had a blood test for high blood sugar (%)
Diabetes - People taking insulin (%)
Diet Behavior & Nutrition - Diet health (%)
Diet Behavior & Nutrition - Milk product consumption (# of products/month)
Diet Behavior & Nutrition - Meals not home prepared (#/week)
Diet Behavior & Nutrition - Meals from fast food or pizza place (#/week)
Diet Behavior & Nutrition - Ready-to-eat foods (#/month)
Diet Behavior & Nutrition - Frozen meals/pizza (#/month)
Drug Use - People that ever used marijuana or hashish (%)
Drug Use - Ever used hard drugs (%)
Drug Use - Ever used any form of cocaine (%)
Drug Use - Ever used heroin (%)
Drug Use - Ever used methamphetamine (%)
Health Insurance - People covered by health insurance (%)
Kidney Conditions-Urology - Avg. # of times urinating at night
Medical Conditions - People with asthma (%)
Medical Conditions - People with anemia (%)
Medical Conditions - People with psoriasis (%)
Medical Conditions - People with overweight (%)
Medical Conditions - Elderly people having difficulties in thinking or remembering (%)
Medical Conditions - People who ever received blood transfusion (%)
Medical Conditions - People having trouble seeing even with glass/contacts (%)
Medical Conditions - People with arthritis (%)
Medical Conditions - People with gout (%)
Medical Conditions - People with congestive heart failure (%)
Medical Conditions - People with coronary heart disease (%)
Medical Conditions - People with angina pectoris (%)
Medical Conditions - People who ever had heart attack (%)
Medical Conditions - People who ever had stroke (%)
Medical Conditions - People with emphysema (%)
Medical Conditions - People with thyroid problem (%)
Medical Conditions - People with chronic bronchitis (%)
Medical Conditions - People with any liver condition (%)
Medical Conditions - People who ever had cancer or malignancy (%)
Mental Health - People who have little interest in doing things (%)
Mental Health - People feeling down, depressed, or hopeless (%)
Mental Health - People who have trouble sleeping or sleeping too much (%)
Mental Health - People feeling tired or having little energy (%)
Mental Health - People with poor appetite or overeating (%)
Mental Health - People feeling bad about themself (%)
Mental Health - People who have trouble concentrating on things (%)
Mental Health - People moving or speaking slowly or too fast (%)
Mental Health - People having thoughts they would be better off dead (%)
Oral Health - Average years since last visit a dentist
Oral Health - People embarrassed because of mouth (%)
Oral Health - People with gum disease (%)
Oral Health - General health of teeth and gums (%)
Oral Health - Average days a week using dental floss/device
Oral Health - Average days a week using mouthwash for dental problem
Oral Health - Average number of teeth
Pesticide Use - Households using pesticides to control insects (%)
Pesticide Use - Households using pesticides to kill weeds (%)
Physical Activity - People doing vigorous-intensity work activities (%)
Physical Activity - People doing moderate-intensity work activities (%)
Physical Activity - People walking or bicycling (%)
Physical Activity - People doing vigorous-intensity recreational activities (%)
Physical Activity - People doing moderate-intensity recreational activities (%)
Physical Activity - Average hours a day doing sedentary activities
Physical Activity - Average hours a day watching TV or videos
Physical Activity - Average hours a day using computer
Physical Functioning - People having limitations keeping them from working (%)
Physical Functioning - People limited in amount of work they can do (%)
Physical Functioning - People that need special equipment to walk (%)
Physical Functioning - People experiencing confusion/memory problems (%)
Physical Functioning - People requiring special healthcare equipment (%)
Prescription Medications - Average number of prescription medicines taking
Preventive Aspirin Use - Adults 40+ taking low-dose aspirin (%)
Reproductive Health - Vaginal deliveries (%)
Reproductive Health - Cesarean deliveries (%)
Reproductive Health - Deliveries resulted in a live birth (%)
Reproductive Health - Pregnancies resulted in a delivery (%)
Reproductive Health - Women breastfeeding newborns (%)
Reproductive Health - Women that had a hysterectomy (%)
Reproductive Health - Women that had both ovaries removed (%)
Reproductive Health - Women that have ever taken birth control pills (%)
Reproductive Health - Women taking birth control pills (%)
Reproductive Health - Women that have ever used Depo-Provera or injectables (%)
Reproductive Health - Women that have ever used female hormones (%)
Sexual Behavior - People 18+ that ever had sex (vaginal, anal, or oral) (%)
Sexual Behavior - Males 18+ that ever had vaginal sex with a woman (%)
Sexual Behavior - Males 18+ that ever performed oral sex on a woman (%)
Sexual Behavior - Males 18+ that ever had anal sex with a woman (%)
Sexual Behavior - Males 18+ that ever had any sex with a man (%)
Sexual Behavior - Females 18+ that ever had vaginal sex with a man (%)
Sexual Behavior - Females 18+ that ever performed oral sex on a man (%)
Sexual Behavior - Females 18+ that ever had anal sex with a man (%)
Sexual Behavior - Females 18+ that ever had any kind of sex with a woman (%)
Sexual Behavior - Average age people first had sex
Sexual Behavior - Average number of female sex partners in lifetime (males 18+)
Sexual Behavior - Average number of female vaginal sex partners in lifetime (males 18+)
Sexual Behavior - Average age people first performed oral sex on a woman (18+)
Sexual Behavior - Average number of woman performed oral sex on in lifetime (18+)
Sexual Behavior - Average number of male sex partners in lifetime (males 18+)
Sexual Behavior - Average number of male anal sex partners in lifetime (males 18+)
Sexual Behavior - Average age people first performed oral sex on a man (18+)
Sexual Behavior - Average number of male oral sex partners in lifetime (18+)
Sexual Behavior - People using protection when performing oral sex (%)
Sexual Behavior - Average number of times people have vaginal or anal sex a year
Sexual Behavior - People having sex without condom (%)
Sexual Behavior - Average number of male sex partners in lifetime (females 18+)
Sexual Behavior - Average number of male vaginal sex partners in lifetime (females 18+)
Sexual Behavior - Average number of female sex partners in lifetime (females 18+)
Sexual Behavior - Circumcised males 18+ (%)
Sleep Disorders - Average hours sleeping at night
Sleep Disorders - People that has trouble sleeping (%)
Smoking-Cigarette Use - People smoking cigarettes (%)
Taste & Smell - People 40+ having problems with smell (%)
Taste & Smell - People 40+ having problems with taste (%)
Taste & Smell - People 40+ that ever had wisdom teeth removed (%)
Taste & Smell - People 40+ that ever had tonsils teeth removed (%)
Taste & Smell - People 40+ that ever had a loss of consciousness because of a head injury (%)
Taste & Smell - People 40+ that ever had a broken nose or other serious injury to face or skull (%)
Taste & Smell - People 40+ that ever had two or more sinus infections (%)
Weight - Average height (inches)
Weight - Average weight (pounds)
Weight - Average BMI
Weight - People that are obese (%)
Weight - People that ever were obese (%)
Weight - People trying to lose weight (%)
117 51.3% Hispanic 61 26.8% White alone 29 12.7% Asian alone 15 6.6% Two or more races 5 2.2% Black alone
Officers per 1,000 residents here:
4.85California average:
1.98
Latest news from Industry, CA collected exclusively by city-data.com from local newspapers, TV, and radio stations
Ancestries: Italian (9.0%), American (6.8%), German (2.3%).
Current Local Time:
Land area: 11.7 square miles.
Population density: 22 people per square mile (very low).
35 residents are foreign born (13.1% Latin America , 2.2% Asia ).
This city:
15.3%California:
26.5%
Median real estate property taxes paid for housing units in 2000: Industry city:
0.6% ($1,141)California:
0.8% ($1,564)
Nearest city with pop. 50,000+: Hacienda Heights, CA
Nearest city with pop. 200,000+: East San Gabriel Valley, CA
Nearest city with pop. 1,000,000+: Los Angeles, CA
Nearest cities:
Latitude: 34.02 N, Longitude: 117.95 W
Daytime population change due to commuting: +61,868 (+27,025.6%)Workers who live and work in this city: 21 (24.6%)
Area code commonly used in this area: 626
Property values in Industry, CA
Single-family new house construction building permits:
2022: 2 buildings , average cost: $285,7001998: 1 building , cost: $150,000Unemployment in December 2023:
Most common occupations in Industry, CA (%)
Both Males Females
Building and grounds cleaning and maintenance occupations (15.4%)
Cashiers (8.2%)
Printing workers (8.2%)
Secretaries and administrative assistants (6.8%)
Driver/sales workers and truck drivers (6.5%)
Operations specialties managers, except financial managers (5.0%)
Other management occupations, except farmers and farm managers (5.0%)
Printing workers (10.5%)
Building and grounds cleaning and maintenance occupations (10.0%)
Secretaries and administrative assistants (8.6%)
Driver/sales workers and truck drivers (8.2%)
Operations specialties managers, except financial managers (6.4%)
Other management occupations, except farmers and farm managers (6.4%)
Entertainers and performers, sports, and related workers (5.9%)
Building and grounds cleaning and maintenance occupations (35.6%)
Cashiers (27.1%)
Waiters and waitresses (20.3%)
Nursing, psychiatric, and home health aides (10.2%)
Other office and administrative support workers, including supervisors (6.8%)
Financial managers (0.0%)
Operations specialties managers, except financial managers (0.0%)
Earthquake activity:
Industry-area historical earthquake activity is significantly above California state average. It is 7105% greater than the overall U.S. average. On 7/21/1952 at 11:52:14, a magnitude 7.7 (7.7 UK, Class: Major, Intensity: VIII - XII) earthquake occurred 90.6 miles away from Industry center, causing $50,000,000 total damage On 6/28/1992 at 11:57:34, a magnitude 7.6 (6.2 MB, 7.6 MS, 7.3 MW, Depth: 0.7 mi) earthquake occurred 82.1 miles away from Industry center, causing 3 deaths ( 1 shaking deaths, 2 other deaths) and 400 injuries, causing $100,000,000 total damage and $40,000,000 insured lossesOn 10/16/1999 at 09:46:44, a magnitude 7.4 (6.3 MB, 7.4 MS, 7.2 MW, 7.3 ML) earthquake occurred 93.3 miles away from the city center On 11/4/1927 at 13:51:53, a magnitude 7.5 (7.5 UK) earthquake occurred 186.3 miles away from Industry center On 4/21/1918 at 22:32:30, a magnitude 6.8 (6.8 UK, Class: Strong, Intensity: VII - IX) earthquake occurred 32.5 miles away from the city center On 1/17/1994 at 12:30:55, a magnitude 6.8 (6.4 MB, 6.8 MS, 6.7 MW, Depth: 11.4 mi) earthquake occurred 37.0 miles away from the city center, causing 60 deaths ( 60 shaking deaths) and 7000 injuriesMagnitude types: body-wave magnitude (MB), local magnitude (ML), surface-wave magnitude (MS), moment magnitude (MW) Natural disasters: The number of natural disasters in Los Angeles County (57) is a lot greater than the US average (15).Major Disasters (Presidential) Declared: 27Emergencies Declared: 3Fires: 37, Floods: 16, Storms: 9, Winter Storms: 6, Landslides: 5, Mudslides: 5, Earthquakes: 3, Freeze: 1, Heavy Rain: 1, Hurricane: 1, Snow: 1, Tornado: 1, Wind: 1, Other: 1 (Note: some incidents may be assigned to more than one category). Hospitals and medical centers near Industry: THE HOSPICE HOUSE PRESBYTERIAN INTERCOMMUNITY (Hospital, about 1 miles away; WHITTIER, CA)
MOHAN DIALYSIS CENTER OF INDUSTRY (Dialysis Facility, about 1 miles away; CITY OF INDUSTRY, CA)
EL ENCANTO CONVALESCENT HOSPITAL (Nursing Home, about 1 miles away; CITY OF INDUSTRY, CA)
EL ENCANTO HEALTHCARE CENTER (Nursing Home, about 1 miles away; CITY OF INDUSTRY, CA)
CASA TERRY (Hospital, about 2 miles away; HACIENDA HEIGHTS, CA)
HACIENDA DIALYSIS CENTER (Dialysis Facility, about 2 miles away; HACIENDA HEIGHTS, CA)
UNITED CARE HOMES - KINBRAE (Hospital, about 2 miles away; HACIENDA HEIGHTS, CA)
Amtrak stations near Industry: 11 miles: FULLERTON (120 E. SANTA FE AVE.) Services: ticket office, fully wheelchair accessible, enclosed waiting area, public restrooms, public payphones, full-service food facilities, free short-term parking, paid long-term parking, taxi stand, public transit connection.
12 miles: POMONA (156 W. COMMERCIAL ST.) Services: partially wheelchair accessible, public payphones, free short-term parking, free long-term parking, call for taxi service, public transit connection.
14 miles: PASADENA (150 S. ROBLES AVE.) - Bus Station Services: fully wheelchair accessible, enclosed waiting area, public restrooms, public payphones, full-service food facilities, paid short-term parking, paid long-term parking, taxi stand, public transit connection.
Colleges/universities with over 2000 students nearest to Industry:
Hacienda La Puente Adult Education (about 1 miles; La Puente, CA ; Full-time enrollment: 2,750)
Rio Hondo College (about 5 miles; Whittier, CA ; FT enrollment: 9,610)
Mt San Antonio College (about 7 miles; Walnut, CA ; FT enrollment: 19,891)
California State Polytechnic University-Pomona (about 9 miles; Pomona, CA ; FT enrollment: 18,141)
Biola University (about 9 miles; La Mirada, CA ; FT enrollment: 5,325)
Azusa Pacific University (about 9 miles; Azusa, CA ; FT enrollment: 9,427)
DeVry University-California (about 10 miles; Pomona, CA ; FT enrollment: 10,875)
Public high school in Industry:
Public elementary/middle school in Industry: TORCH MIDDLE Location: 751 N. VINELAND AVE., Grades: 6-8)
See full list of schools located in Industry
Notable locations in Industry: (A) , Pellissier Spur (B) , Fallon (C) , California Country Club (D) , Dwight D Eisenhower Golf Course (E) , Babe Zaharias Golf Course (F) , Los Angeles County Fire Department Station 87 (G) , Industry Sheriffs Station (H) , Los Angeles County Fire Department Station 118 (I) , Los Angeles County Fire Department Station 43 (J) . Display/hide their locations on the map
Shopping Centers: (1) , Puenta Hills Mall Shopping Center (2) , Puente Hills East Shopping Center (3) . Display/hide their locations on the map
Creeks: (A) , Avocado Creek (B) , South San Jose Creek (C) , Puente Creek (D) , Lemon Creek (E) . Display/hide their locations on the map
Parks in Industry include: (1) , Industry Hills Recreation Center (2) . Display/hide their locations on the map
Los Angeles County has a predicted average indoor radon screening level between 2 and 4 pCi/L (pico curies per liter) - Moderate Potential Average household size: This city:
3.1 peopleCalifornia:
2.9 people
Percentage of family households: This city:
76.8%Whole state:
68.7%
Percentage of households with unmarried partners: This city:
7.2%Whole state:
7.2%
Likely homosexual households (counted as self-reported same-sex unmarried-partner households)
Lesbian couples: 0.0% of all households Gay men: 2.9% of all households
3 people in workers' group living quarters and job corps centers in 2010people in other noninstitutional facilities in 2010People in group quarters in Industry in 2000:
179 people in nursing homes
82 people in other noninstitutional group quarters
3 people in other group homes
Banks with branches in Industry (2011 data):
East West Bank: City Of Industry Branch at 18645 East Gale Avenue, branch established on 1990/09/04. Info updated 2010/06/14: Bank assets: $21,962.4 mil, Deposits: $17,501.8 mil, headquarters in Pasadena, CA, positive income , Commercial Lending Specialization, 131 total offices , Holding Company: East West Bancorp, Inc.
Chinatrust Bank (U.S.A.): City Of Industry Branch at 18645 Gale Avenue Suite 150, branch established on 1996/09/16. Info updated 2012/02/10: Bank assets: $1,418.6 mil, Deposits: $1,066.3 mil, headquarters in Torrance, CA, positive income , Commercial Lending Specialization, 12 total offices , Holding Company: Chinatrust Financial Holding Company, Ltd.
For population 15 years and over in Industry:
Never married: 49.1%Now married: 30.3%Separated: 0.0%Widowed: 7.8%Divorced: 12.8% For population 25 years and over in Industry:
High school or higher: 88.5%Bachelor's degree or higher: 18.2%Graduate or professional degree: 6.1%Unemployed: 13.9%Mean travel time to work (commute): 29.7 minutes
Education Gini index (Inequality in education) Here:
10.0California average:
15.5
Religion statistics for Industry, CA (based on Los Angeles County data)
Religion Adherents Congregations Catholic 3,542,994 275 Evangelical Protestant 814,611 3,249 Other 451,594 1,023 Mainline Protestant 229,056 860 Black Protestant 112,338 290 Orthodox 63,517 76 None 4,604,495 -
Source: Clifford Grammich, Kirk Hadaway, Richard Houseal, Dale E.Jones, Alexei Krindatch, Richie Stanley and Richard H.Taylor. 2012. 2010 U.S.Religion Census: Religious Congregations & Membership Study. Association of Statisticians of American Religious Bodies. Jones, Dale E., et al. 2002. Congregations and Membership in the United States 2000. Nashville, TN: Glenmary Research Center. Graphs represent county-level data
Food Environment Statistics: Number of grocery stores : 2,084This county :
2.12 / 10,000 pop.State :
2.14 / 10,000 pop.
Number of supercenters and club stores : 32Here :
0.03 / 10,000 pop.California :
0.04 / 10,000 pop.
Number of convenience stores (no gas) : 567Los Angeles County :
0.58 / 10,000 pop.California :
0.62 / 10,000 pop.
Number of convenience stores (with gas) : 1,206Los Angeles County :
1.23 / 10,000 pop.California :
1.49 / 10,000 pop.
Number of full-service restaurants : 7,008Here :
7.15 / 10,000 pop.California :
7.42 / 10,000 pop.
Adult diabetes rate : This county :
7.5%California :
7.3%
Adult obesity rate : Los Angeles County :
20.4%California :
21.3%
Low-income preschool obesity rate : Los Angeles County :
18.6%California :
17.9%
Health and Nutrition: Healthy diet rate : Industry:
47.9%State:
49.4%
Average overall health of teeth and gums : This city:
47.1%State:
48.0%
People feeling badly about themselves : This city:
22.9%California:
20.2%
People not drinking alcohol at all : Here:
11.5%California:
11.2%
Average hours sleeping at night : This city:
6.8California:
6.8
Overweight people : This city:
34.2%State:
31.5%
General health condition : Here:
54.5%California:
56.4%
Average condition of hearing : Here:
79.9%California:
80.9%
More about Health and Nutrition of Industry, CA Residents
Local government employment and payroll (March 2022)
Function
Full-time employees
Monthly full-time payroll
Average yearly full-time wage
Part-time employees
Monthly part-time payroll
Other Government Administration
11 $135,020 $147,295 13 $20,333 Financial Administration
7 $76,365 $130,911 0 $0 Other and Unallocable
1 $10,646 $127,752 3 $9,440
Totals for Government
19 $222,031 $140,230 16 $29,773
Industry government finances - Expenditure in 2017 (per resident):
Construction - Housing and Community Development: $13,873,000 ($54403.92)
Protective Inspection and Regulation - Other: $3,582,000 ($14047.06)Hospitals: $1,348,000 ($5286.27)Parks and Recreation: $177,000 ($694.12)Current Operations - Regular Highways: $11,355,000 ($44529.41)
Central Staff Services: $9,855,000 ($38647.06)Police Protection: $9,840,000 ($38588.24)Electric Utilities: $4,881,000 ($19141.18)Parks and Recreation: $3,147,000 ($12341.18)Water Utilities: $2,581,000 ($10121.57)Solid Waste Management: $2,323,000 ($9109.80)Financial Administration: $1,227,000 ($4811.76)Protective Inspection and Regulation - Other: $1,030,000 ($4039.22)Housing and Community Development: $419,000 ($1643.14)Hospitals: $244,000 ($956.86)General - Interest on Debt: $66,849,000 ($262152.94)
Other Capital Outlay - Housing and Community Development: $9,216,000 ($36141.18)
Industry government finances - Revenue in 2017 (per resident):
Charges - Solid Waste Management: $1,623,000 ($6364.71)
Other: $1,229,000 ($4819.61)Housing and Community Development: $191,000 ($749.02)Local Intergovernmental - Other: $368,000 ($1443.14)
Miscellaneous - Interest Earnings: $26,830,000 ($105215.69)
General Revenue - Other: $4,252,000 ($16674.51)Rents: $1,989,000 ($7800.00)Sale of Property: $1,167,000 ($4576.47)Fines and Forfeits: $424,000 ($1662.75)Revenue - Electric Utilities: $5,379,000 ($21094.12)
Water Utilities: $3,297,000 ($12929.41)Transit Utilities: $20,000 ($78.43)State Intergovernmental - Other: $137,000 ($537.25)
Highways: $12,000 ($47.06)General Local Government Support: $10,000 ($39.22)Tax - Property: $157,054,000 ($615898.04)
General Sales and Gross Receipts: $34,633,000 ($135815.69)Public Utilities Sales: $1,511,000 ($5925.49)Other License: $1,324,000 ($5192.16)Other Selective Sales: $1,037,000 ($4066.67)Documentary and Stock Transfer: $296,000 ($1160.78)
Industry government finances - Debt in 2017 (per resident):
Long Term Debt - Beginning Outstanding - Unspecified Public Purpose: $1,160,670,000 ($4551647.06)
Outstanding Unspecified Public Purpose: $1,078,565,000 ($4229666.67)Retired Unspecified Public Purpose: $116,445,000 ($456647.06)Issue, Unspecified Public Purpose: $34,340,000 ($134666.67)
Industry government finances - Cash and Securities in 2017 (per resident):
Bond Funds - Cash and Securities: $207,634,000 ($814250.98)
Other Funds - Cash and Securities: $755,247,000 ($2961752.94)
Sinking Funds - Cash and Securities: $709,390,000 ($2781921.57)
2.98% of this county's 2021 resident taxpayers lived in other counties in 2020 ($81,235 average adjusted gross income )
Here:
2.98%California average:
5.19%
0.01% of residents moved from foreign countries ($155 average AGI )Los Angeles County:
0.01%California average:
0.03%
Top counties from which taxpayers relocated into this county between 2020 and 2021:
4.68% of this county's 2020 resident taxpayers moved to other counties in 2021 ($97,324 average adjusted gross income )
Here:
4.68%California average:
6.14%
0.01% of residents moved to foreign countries ($196 average AGI )Los Angeles County:
0.01%California average:
0.02%
Top counties to which taxpayers relocated from this county between 2020 and 2021: Businesses in Industry, CA
Strongest AM radio stations in Industry:
KTNQ (1020 AM; 50 kW; LOS ANGELES, CA; Owner: KTNQ-AM LICENSE CORP.)
KXTA (1150 AM; 50 kW; LOS ANGELES, CA; Owner: CITICASTERS LICENSES, L.P.)
KALI (900 AM; 6 kW; WEST COVINA, CA; Owner: MULTICULTURAL RADIO BROADCASTING, INC.)
KLAC (570 AM; 50 kW; LOS ANGELES, CA; Owner: AMFM RADIO LICENSES, L.L.C.)
KDIS (1110 AM; 50 kW; PASADENA, CA; Owner: ABC,INC.)
KFI (640 AM; 50 kW; LOS ANGELES, CA; Owner: CAPSTAR TX LIMITED PARTNERSHIP)
KFWB (980 AM; 50 kW; LOS ANGELES, CA; Owner: INFINITY BROADCASTING OPERATIONS, INC.)
KMPC (1540 AM; 50 kW; LOS ANGELES, CA; Owner: ROSE CITY RADIO CORPORATION)
KPLS (830 AM; 50 kW; ORANGE, CA; Owner: CRN LICENSES, LLC)
KBLA (1580 AM; 50 kW; SANTA MONICA, CA)
KXMX (1190 AM; 25 kW; ANAHEIM, CA; Owner: NEW INSPIRATION BROADCASTING COMPANY)
KSPN (710 AM; 50 kW; LOS ANGELES, CA; Owner: KABC-AM RADIO, INC.)
KNX (1070 AM; 50 kW; LOS ANGELES, CA; Owner: INFINITY BROADCASTING OPERATIONS, INC.)
Strongest FM radio stations in Industry:
KCBS-FM (93.1 FM; LOS ANGELES, CA; Owner: INFINITY BROADCASTING OPERATIONS, INC.)
KSCA (101.9 FM; GLENDALE, CA; Owner: HBC LICENSE CORPORATION)
KOST (103.5 FM; LOS ANGELES, CA; Owner: CAPSTAR TX LIMITED PARTNERSHIP)
KLOS (95.5 FM; LOS ANGELES, CA; Owner: KLOS-FM RADIO, INC.)
K212FA (90.3 FM; TEMPLE CITY, CA; Owner: EDUCATIONAL MEDIA FOUNDATION)
KIIS-FM (102.7 FM; LOS ANGELES, CA; Owner: CITICASTERS LICENSES, L.P.)
KLVE (107.5 FM; LOS ANGELES, CA; Owner: KLVE-FM LICENSE CORP.)
KPCC (89.3 FM; PASADENA, CA; Owner: PASADENA AREA COMMUNITY COLLEGE DISTRICT)
KHHT (92.3 FM; LOS ANGELES, CA; Owner: AMFM RADIO LICENSES, L.L.C.)
KBIG-FM (104.3 FM; LOS ANGELES, CA; Owner: AMFM RADIO LICENSES, L.L.C.)
KTWV (94.7 FM; LOS ANGELES, CA; Owner: INFINITY BROADCASTING OPERATIONS, INC.)
KMZT-FM (105.1 FM; LOS ANGELES, CA; Owner: MOUNT WILSON FM BROADCASTERS, INC.)
KPFK (90.7 FM; LOS ANGELES, CA; Owner: PACIFICA FOUNDATION, INC)
K216EM (91.1 FM; ARCADIA, CA; Owner: LIFE ON THE WAY COMMUNICATIONS, INC.)
KZLA-FM (93.9 FM; LOS ANGELES, CA; Owner: EMMIS RADIO LICENSE CORPORATION)
KPWR (105.9 FM; LOS ANGELES, CA; Owner: EMMIS RADIO LICENSE CORPORATION)
KLSX (97.1 FM; LOS ANGELES, CA; Owner: INFINITY BROADCASTING OPERATIONS, INC.)
KUSC (91.5 FM; LOS ANGELES, CA; Owner: UNIVERSITY OF SOUTHERN CALIFORNIA)
KKLA-FM (99.5 FM; LOS ANGELES, CA; Owner: NEW INSPIRATION BROADCASTING CO., INC.)
KRTH-FM (101.1 FM; LOS ANGELES, CA; Owner: INFINITY BROADCASTING OPERATIONS, INC.)
TV broadcast stations around Industry:
KCBS-TV (Channel 2; LOS ANGELES, CA; Owner: CBS BROADCASTING INC.)
KTRO-LP (Channel 50; LANCASTER, CA; Owner: ROBERT D. ADELMAN)
KTLA-TV (Channel 5; LOS ANGELES, CA; Owner: KTLA INC.)
KABC-TV (Channel 7; LOS ANGELES, CA; Owner: ABC HOLDING COMPANY, INC.)
KNBC (Channel 4; LOS ANGELES, CA; Owner: NBC SUBSIDIARY (KNBC-TV), INC.)
KCAL-TV (Channel 9; LOS ANGELES, CA; Owner: VIACOM TELEVISION STATIONS GROUP OF LOS ANGELES LLC)
KHIZ (Channel 64; BARSTOW, CA; Owner: SUNBELT TELEVISION, INC.)
KMEX-TV (Channel 34; LOS ANGELES, CA; Owner: KMEX LICENSE PARTNERSHIP, G.P.)
KAZA-TV (Channel 54; AVALON, CA; Owner: PAPPAS SOUTHERN CALIFORNIA LICENSE LLC)
KSCI (Channel 18; LONG BEACH, CA; Owner: KSLS, INC.)
KDOC-TV (Channel 56; ANAHEIM, CA; Owner: GOLDEN ORANGE BROADCASTING CO., INC.)
KOCE-TV (Channel 50; HUNTINGTON BEACH, CA; Owner: BD. OF TRUSTEES, COAST COMMUNITY COLLEGE DIST.)
KCET (Channel 28; LOS ANGELES, CA; Owner: COMMUNITY TELEVISION OF SOUTHERN CALIFORNIA)
KXLA (Channel 44; RANCHO PALOS VERDES, CA; Owner: RANCHO PALOS VERDES BROADCASTERS, INC.)
KFTR (Channel 46; ONTARIO, CA; Owner: TELEFUTURA LOS ANGELES LLC)
KTTV (Channel 11; LOS ANGELES, CA; Owner: FOX TELEVISION STATIONS, INC.)
KWHY-TV (Channel 22; LOS ANGELES, CA; Owner: TELEMUNDO OF LOS ANGELES LICENSE CORPORATION)
KVEA (Channel 52; CORONA, CA; Owner: ESTRELLA LICENSE CORPORATION)
KCOP-TV (Channel 13; LOS ANGELES, CA; Owner: FOX TELEVISION STATIONS, INC.)
KTBN-TV (Channel 40; SANTA ANA, CA; Owner: TRINITY BROADCASTING NETWORK, INC.)
KSFV-LP (Channel 26; SAN FERNANDO VALLEY, CA; Owner: VENTURE TECHNOLOGIES GROUP, LLC)
KLCS (Channel 58; LOS ANGELES, CA; Owner: LOS ANGELES UNIFIED SCHOOL DISTRICT)
KRCA (Channel 62; RIVERSIDE, CA; Owner: KRCA LICENSE CORP.)
Industry, California
Fatal accident count 324 Vehicles involved in fatal accidents 515 Fatal accidents involving drunk persons: 131 Fatalities 365 Persons involved in fatal accidents 871 Pedestrians involved in fatal accidents 42
California average
Fatal accident count 177373 Vehicles involved in fatal accidents 268180 Fatal accidents involving drunk persons 68369 Fatalities 196797 Persons involved in fatal accidents 471515 Pedestrians involved in fatal accidents 31649
See more detailed statistics of Industry fatal car crashes and road traffic accidents for 1975 - 2021 here
National Bridge Inventory (NBI) Statistics 90 Number of bridges1,175ft / 358m Total length $15,004,000 Total costs5,543,599 Total average daily traffic361,249 Total average daily truck traffic
New bridges - historical statistics
2 1910-1919 1 1920-1929 1 1940-1949 10 1950-1959 50 1960-1969 5 1970-1979 5 1980-1989 6 1990-1999 7 2000-2009 3 2010-2019
See full National Bridge Inventory statistics for Industry, CA
FCC Registered Antenna Towers: 19 (
See the full list of FCC Registered Antenna Towers in Industry )
FCC Registered Broadcast Land Mobile Towers: 14 (
See the full list of FCC Registered Broadcast Land Mobile Towers in Industry, CA )
FCC Registered Microwave Towers: 48 (
See the full list of FCC Registered Microwave Towers in this town )
FCC Registered Paging Towers: 1 (
See the full list of FCC Registered Paging Towers )
FCC Registered Amateur Radio Licenses: 5
Call Sign: KB6IXE, Grant Date: 05/12/1995, Expiration Date: 05/12/2005, Cancellation Date: 05/15/2007, Registrant: Hector R Travers, Industry, CA 91715Call Sign: KJ6SPX, Licensee ID: L01671972, Grant Date: 11/10/2011, Expiration Date: 11/10/2021, Cancellation Date: 11/11/2023, Certifier: Charlie Lai, Registrant: Charlie Lai, 18107 Valley Blvd, Industry, CA 91744Call Sign: KK6VJM, Licensee ID: L01957927, Grant Date: 07/20/2015, Expiration Date: 07/20/2025, Certifier: Henry H Tse, Registrant: Henry H Tse, 18305 Valley Blvd, Industry, CA 91744Call Sign: K6EDE, Previous Call Sign: KM6BHL, Licensee ID: L02012666, Grant Date: 04/26/2016, Expiration Date: 04/26/2026, Certifier: Edward I Hsieh, Registrant: Edward I Hsieh, 17295 E Railroad St, Industry, CA 91748Call Sign: N6EAS, Previous Call Sign: KN6KIY, Licensee ID: L02192246, Grant Date: 09/05/2020, Expiration Date: 09/05/2030, Certifier: Eric A Smith, Registrant: Eric A Smith, 14557 Bonelli Street, Industry, CA 91746FAA Registered Aircraft: 1
Aircraft: BOEING 757-222 (Category: Land, Engines: 2, Seats: 178, Weight: 20,000+ Pounds), Engine: P & W PW2040 (40900 Pounds of Thrust) (Turbo-fan)N-Number: 551UA, N551UA, N-551UA, Serial Number: 25399, Year manufactured: 1992, Airworthiness Date: 02/18/1992Registrant (Individual): Reported Sale, 680 South Lemon Ave, Industry, CA 91789Deregistered: Cancel Date: 05/30/2018
Home Mortgage Disclosure Act Aggregated Statistics For Year 2009(Based on 9 partial tracts) A) FHA, FSA/RHS & VA B) Conventional C) Refinancings D) Home Improvement Loans F) Non-occupant Loans on G) Loans On Manufactured Number Average Value Number Average Value Number Average Value Number Average Value Number Average Value Number Average Value
LOANS ORIGINATED 37 $286,581 64 $221,443 226 $239,282 15 $150,689 19 $199,647 4 $53,545 APPLICATIONS APPROVED, NOT ACCEPTED 8 $273,625 13 $185,047 40 $254,642 4 $55,418 3 $156,643 4 $61,582 APPLICATIONS DENIED 13 $292,574 26 $171,647 98 $255,577 10 $74,710 16 $239,709 10 $54,245 APPLICATIONS WITHDRAWN 8 $276,532 20 $261,958 58 $276,150 8 $96,630 6 $203,903 0 $0 FILES CLOSED FOR INCOMPLETENESS 7 $334,223 6 $328,342 23 $292,032 3 $183,343 1 $196,800 1 $57,420
Aggregated Statistics For Year 2008(Based on 9 partial tracts) A) FHA, FSA/RHS & VA B) Conventional C) Refinancings D) Home Improvement Loans E) Loans on Dwellings For 5+ Families F) Non-occupant Loans on G) Loans On Manufactured Number Average Value Number Average Value Number Average Value Number Average Value Number Average Value Number Average Value Number Average Value
LOANS ORIGINATED 18 $308,345 103 $263,908 178 $264,704 23 $142,798 1 $258,780 26 $227,949 11 $52,548 APPLICATIONS APPROVED, NOT ACCEPTED 4 $337,648 30 $258,420 64 $252,074 10 $198,516 0 $0 6 $215,492 11 $63,775 APPLICATIONS DENIED 8 $352,476 52 $248,071 194 $288,436 21 $84,099 0 $0 11 $275,686 23 $53,915 APPLICATIONS WITHDRAWN 4 $294,425 19 $300,600 67 $291,585 9 $156,210 0 $0 6 $327,452 0 $0 FILES CLOSED FOR INCOMPLETENESS 1 $464,450 8 $329,954 21 $291,208 3 $172,897 0 $0 4 $234,438 0 $0
Aggregated Statistics For Year 2007(Based on 9 partial tracts) A) FHA, FSA/RHS & VA B) Conventional C) Refinancings D) Home Improvement Loans F) Non-occupant Loans on G) Loans On Manufactured Number Average Value Number Average Value Number Average Value Number Average Value Number Average Value Number Average Value
LOANS ORIGINATED 0 $0 154 $287,560 442 $301,677 64 $207,195 41 $301,097 17 $67,289 APPLICATIONS APPROVED, NOT ACCEPTED 0 $0 54 $292,173 126 $319,394 17 $202,782 10 $378,515 10 $85,058 APPLICATIONS DENIED 0 $0 90 $291,565 314 $326,794 57 $150,983 27 $293,263 20 $63,150 APPLICATIONS WITHDRAWN 1 $7,680 32 $292,328 116 $321,155 19 $224,466 6 $356,998 1 $36,240 FILES CLOSED FOR INCOMPLETENESS 0 $0 12 $820,836 50 $340,286 5 $223,352 3 $291,163 0 $0
Aggregated Statistics For Year 2006(Based on 9 partial tracts) B) Conventional C) Refinancings D) Home Improvement Loans E) Loans on Dwellings For 5+ Families F) Non-occupant Loans on G) Loans On Manufactured Number Average Value Number Average Value Number Average Value Number Average Value Number Average Value Number Average Value
LOANS ORIGINATED 305 $269,099 637 $302,432 89 $200,828 1 $858,850 75 $287,282 6 $53,650 APPLICATIONS APPROVED, NOT ACCEPTED 83 $280,447 141 $297,338 22 $182,848 0 $0 16 $282,168 8 $68,006 APPLICATIONS DENIED 126 $268,705 282 $310,106 68 $182,032 0 $0 24 $290,694 17 $89,700 APPLICATIONS WITHDRAWN 85 $275,683 215 $299,955 25 $199,674 0 $0 22 $289,510 1 $201,100 FILES CLOSED FOR INCOMPLETENESS 22 $285,426 61 $285,207 6 $239,262 0 $0 4 $291,935 0 $0
Aggregated Statistics For Year 2005(Based on 9 partial tracts) A) FHA, FSA/RHS & VA B) Conventional C) Refinancings D) Home Improvement Loans E) Loans on Dwellings For 5+ Families F) Non-occupant Loans on G) Loans On Manufactured Number Average Value Number Average Value Number Average Value Number Average Value Number Average Value Number Average Value Number Average Value
LOANS ORIGINATED 1 $115,970 357 $263,697 777 $268,078 101 $187,419 0 $0 80 $254,246 7 $109,630 APPLICATIONS APPROVED, NOT ACCEPTED 0 $0 75 $257,545 147 $253,592 23 $188,879 0 $0 15 $240,318 9 $66,111 APPLICATIONS DENIED 0 $0 120 $233,812 327 $271,924 76 $161,622 0 $0 21 $264,751 27 $77,183 APPLICATIONS WITHDRAWN 0 $0 68 $248,177 268 $263,010 27 $199,510 1 $134,430 14 $236,851 0 $0 FILES CLOSED FOR INCOMPLETENESS 0 $0 20 $257,844 98 $270,886 8 $152,382 0 $0 5 $269,300 0 $0
Aggregated Statistics For Year 2004(Based on 9 partial tracts) A) FHA, FSA/RHS & VA B) Conventional C) Refinancings D) Home Improvement Loans E) Loans on Dwellings For 5+ Families F) Non-occupant Loans on G) Loans On Manufactured Number Average Value Number Average Value Number Average Value Number Average Value Number Average Value Number Average Value Number Average Value
LOANS ORIGINATED 3 $240,207 327 $229,772 880 $222,562 86 $146,480 1 $677,710 73 $208,650 7 $56,796 APPLICATIONS APPROVED, NOT ACCEPTED 0 $0 87 $230,358 169 $209,611 20 $142,688 0 $0 16 $195,046 6 $58,728 APPLICATIONS DENIED 1 $114,520 127 $210,928 404 $229,453 72 $128,198 0 $0 27 $202,059 15 $53,428 APPLICATIONS WITHDRAWN 2 $247,985 54 $223,058 335 $224,627 26 $138,698 0 $0 19 $210,021 2 $71,120 FILES CLOSED FOR INCOMPLETENESS 1 $113,690 11 $237,495 69 $244,755 6 $178,935 0 $0 4 $246,972 0 $0
Aggregated Statistics For Year 2003(Based on 9 partial tracts) A) FHA, FSA/RHS & VA B) Conventional C) Refinancings D) Home Improvement Loans F) Non-occupant Loans on Number Average Value Number Average Value Number Average Value Number Average Value Number Average Value
LOANS ORIGINATED 22 $223,606 314 $190,601 1,432 $175,618 39 $48,805 96 $168,747 APPLICATIONS APPROVED, NOT ACCEPTED 3 $183,567 61 $183,392 242 $171,757 9 $65,183 22 $166,483 APPLICATIONS DENIED 2 $189,830 98 $198,731 380 $176,971 37 $40,981 33 $174,236 APPLICATIONS WITHDRAWN 5 $204,126 44 $169,617 358 $185,454 17 $52,286 17 $153,523 FILES CLOSED FOR INCOMPLETENESS 0 $0 10 $180,640 67 $186,510 4 $56,725 4 $187,172
Aggregated Statistics For Year 2002(Based on 6 partial tracts) A) FHA, FSA/RHS & VA B) Conventional C) Refinancings D) Home Improvement Loans F) Non-occupant Loans on Number Average Value Number Average Value Number Average Value Number Average Value Number Average Value
LOANS ORIGINATED 37 $191,537 218 $175,453 749 $158,225 30 $46,119 58 $139,291 APPLICATIONS APPROVED, NOT ACCEPTED 3 $211,857 28 $189,464 138 $153,716 5 $25,110 11 $140,754 APPLICATIONS DENIED 4 $209,950 45 $134,690 256 $142,376 38 $22,686 13 $156,931 APPLICATIONS WITHDRAWN 10 $187,616 36 $165,902 221 $166,023 19 $34,801 7 $146,450 FILES CLOSED FOR INCOMPLETENESS 3 $172,627 12 $155,509 79 $176,379 1 $38,300 4 $139,102
Aggregated Statistics For Year 2001(Based on 6 partial tracts) A) FHA, FSA/RHS & VA B) Conventional C) Refinancings D) Home Improvement Loans F) Non-occupant Loans on Number Average Value Number Average Value Number Average Value Number Average Value Number Average Value
LOANS ORIGINATED 53 $177,122 191 $139,833 513 $146,236 29 $31,981 36 $136,574 APPLICATIONS APPROVED, NOT ACCEPTED 3 $190,130 42 $95,955 96 $133,766 7 $42,881 5 $153,084 APPLICATIONS DENIED 8 $189,945 67 $94,591 220 $130,884 51 $31,249 14 $125,614 APPLICATIONS WITHDRAWN 10 $170,813 22 $148,340 176 $143,742 22 $48,118 7 $166,717 FILES CLOSED FOR INCOMPLETENESS 0 $0 4 $210,318 47 $144,262 2 $19,815 1 $81,120
Aggregated Statistics For Year 2000(Based on 6 partial tracts) A) FHA, FSA/RHS & VA B) Conventional C) Refinancings D) Home Improvement Loans F) Non-occupant Loans on Number Average Value Number Average Value Number Average Value Number Average Value Number Average Value
LOANS ORIGINATED 73 $157,185 181 $129,813 138 $120,913 26 $25,282 17 $108,308 APPLICATIONS APPROVED, NOT ACCEPTED 5 $134,150 33 $130,878 38 $95,206 16 $30,935 3 $149,160 APPLICATIONS DENIED 9 $184,043 73 $121,776 130 $99,403 32 $28,816 6 $100,527 APPLICATIONS WITHDRAWN 9 $171,550 30 $165,371 62 $103,380 7 $19,347 4 $85,400 FILES CLOSED FOR INCOMPLETENESS 2 $106,530 9 $133,083 22 $138,996 1 $27,560 1 $221,980
Aggregated Statistics For Year 1999(Based on 11 partial tracts) A) FHA, FSA/RHS & VA B) Conventional C) Refinancings D) Home Improvement Loans E) Loans on Dwellings For 5+ Families F) Non-occupant Loans on Number Average Value Number Average Value Number Average Value Number Average Value Number Average Value Number Average Value
LOANS ORIGINATED 96 $147,603 238 $146,513 381 $122,981 58 $25,286 2 $256,965 37 $98,870 APPLICATIONS APPROVED, NOT ACCEPTED 6 $149,268 29 $144,314 94 $120,704 25 $23,446 0 $0 5 $117,278 APPLICATIONS DENIED 16 $152,092 73 $106,001 211 $111,085 47 $23,981 1 $1,614,660 16 $109,545 APPLICATIONS WITHDRAWN 10 $145,113 63 $166,546 140 $116,592 8 $23,492 0 $0 10 $109,534 FILES CLOSED FOR INCOMPLETENESS 3 $163,940 10 $171,384 60 $127,316 1 $33,050 1 $112,030 3 $86,623
Detailed mortgage data for all 9 tracts in Industry, CA
Private Mortgage Insurance Companies Aggregated Statistics For Year 2009(Based on 8 partial tracts) A) Conventional B) Refinancings Number Average Value Number Average Value
LOANS ORIGINATED 9 $279,660 0 $0 APPLICATIONS APPROVED, NOT ACCEPTED 9 $308,082 1 $239,950 APPLICATIONS DENIED 0 $0 1 $153,030 APPLICATIONS WITHDRAWN 1 $306,820 1 $171,160 FILES CLOSED FOR INCOMPLETENESS 0 $0 1 $232,520
Aggregated Statistics For Year 2008(Based on 9 partial tracts) A) Conventional B) Refinancings C) Non-occupant Loans on Number Average Value Number Average Value Number Average Value
LOANS ORIGINATED 24 $338,162 7 $370,917 1 $123,970 APPLICATIONS APPROVED, NOT ACCEPTED 16 $367,122 19 $405,332 0 $0 APPLICATIONS DENIED 6 $346,892 4 $338,332 1 $505,660 APPLICATIONS WITHDRAWN 1 $255,000 0 $0 0 $0 FILES CLOSED FOR INCOMPLETENESS 1 $265,130 0 $0 0 $0
Aggregated Statistics For Year 2007(Based on 8 partial tracts) A) Conventional B) Refinancings Number Average Value Number Average Value
LOANS ORIGINATED 8 $401,095 9 $426,926 APPLICATIONS APPROVED, NOT ACCEPTED 2 $501,060 4 $430,352 APPLICATIONS DENIED 1 $195,340 2 $471,120 APPLICATIONS WITHDRAWN 2 $340,005 2 $498,745 FILES CLOSED FOR INCOMPLETENESS 0 $0 0 $0
Aggregated Statistics For Year 2006(Based on 5 partial tracts) A) Conventional B) Refinancings Number Average Value Number Average Value
LOANS ORIGINATED 2 $435,575 3 $486,340 APPLICATIONS APPROVED, NOT ACCEPTED 1 $230,390 2 $325,045 APPLICATIONS DENIED 0 $0 0 $0 APPLICATIONS WITHDRAWN 0 $0 1 $270,220 FILES CLOSED FOR INCOMPLETENESS 0 $0 0 $0
Aggregated Statistics For Year 2005(Based on 9 partial tracts) A) Conventional B) Refinancings C) Non-occupant Loans on Number Average Value Number Average Value Number Average Value
LOANS ORIGINATED 5 $413,700 8 $364,040 1 $193,100 APPLICATIONS APPROVED, NOT ACCEPTED 2 $316,910 2 $279,735 0 $0 APPLICATIONS DENIED 0 $0 1 $328,600 0 $0 APPLICATIONS WITHDRAWN 1 $465,800 0 $0 1 $465,800 FILES CLOSED FOR INCOMPLETENESS 0 $0 0 $0 0 $0
Aggregated Statistics For Year 2004(Based on 7 partial tracts) A) Conventional B) Refinancings C) Non-occupant Loans on Number Average Value Number Average Value Number Average Value
LOANS ORIGINATED 9 $294,573 9 $268,879 2 $219,445 APPLICATIONS APPROVED, NOT ACCEPTED 5 $269,144 8 $288,116 0 $0 APPLICATIONS DENIED 1 $102,830 0 $0 0 $0 APPLICATIONS WITHDRAWN 1 $211,700 1 $299,370 0 $0 FILES CLOSED FOR INCOMPLETENESS 1 $127,850 0 $0 0 $0
Aggregated Statistics For Year 2003(Based on 9 partial tracts) A) Conventional B) Refinancings C) Non-occupant Loans on Number Average Value Number Average Value Number Average Value
LOANS ORIGINATED 44 $233,554 41 $212,842 2 $153,740 APPLICATIONS APPROVED, NOT ACCEPTED 13 $250,793 21 $219,948 0 $0 APPLICATIONS DENIED 0 $0 1 $364,510 1 $142,830 APPLICATIONS WITHDRAWN 1 $199,480 1 $292,740 0 $0 FILES CLOSED FOR INCOMPLETENESS 0 $0 1 $118,800 0 $0
Aggregated Statistics For Year 2002(Based on 6 partial tracts) A) Conventional B) Refinancings C) Non-occupant Loans on Number Average Value Number Average Value Number Average Value
LOANS ORIGINATED 65 $207,505 41 $194,769 2 $225,975 APPLICATIONS APPROVED, NOT ACCEPTED 8 $210,720 17 $196,974 0 $0 APPLICATIONS DENIED 1 $189,990 1 $194,610 0 $0 APPLICATIONS WITHDRAWN 3 $211,560 4 $196,460 1 $143,200 FILES CLOSED FOR INCOMPLETENESS 1 $74,840 0 $0 0 $0
Aggregated Statistics For Year 2001(Based on 6 partial tracts) A) Conventional B) Refinancings C) Non-occupant Loans on Number Average Value Number Average Value Number Average Value
LOANS ORIGINATED 48 $186,802 42 $182,840 1 $143,190 APPLICATIONS APPROVED, NOT ACCEPTED 8 $192,886 9 $171,588 0 $0 APPLICATIONS DENIED 2 $130,595 2 $211,030 0 $0 APPLICATIONS WITHDRAWN 1 $168,720 3 $185,717 0 $0 FILES CLOSED FOR INCOMPLETENESS 1 $237,480 0 $0 0 $0
Aggregated Statistics For Year 2000(Based on 6 partial tracts) A) Conventional B) Refinancings C) Non-occupant Loans on Number Average Value Number Average Value Number Average Value
LOANS ORIGINATED 48 $166,446 23 $156,917 3 $133,110 APPLICATIONS APPROVED, NOT ACCEPTED 9 $178,283 6 $154,528 0 $0 APPLICATIONS DENIED 3 $210,617 2 $173,470 0 $0 APPLICATIONS WITHDRAWN 1 $62,840 0 $0 0 $0 FILES CLOSED FOR INCOMPLETENESS 1 $158,010 0 $0 0 $0
Aggregated Statistics For Year 1999(Based on 11 partial tracts) A) Conventional B) Refinancings C) Non-occupant Loans on Number Average Value Number Average Value Number Average Value
LOANS ORIGINATED 51 $168,284 53 $150,519 1 $120,760 APPLICATIONS APPROVED, NOT ACCEPTED 13 $151,560 15 $156,849 1 $125,620 APPLICATIONS DENIED 3 $154,820 6 $175,233 0 $0 APPLICATIONS WITHDRAWN 3 $153,310 4 $122,820 1 $161,790 FILES CLOSED FOR INCOMPLETENESS 1 $159,470 0 $0 0 $0
Industry compared to California state average:
Black race population percentage significantly below state average. Hispanic race population percentage below state average. Median age above state average. Foreign-born population percentage significantly below state average. Renting percentage above state average. Length of stay since moving in above state average. House age above state average. Institutionalized population percentage significantly above state average. Number of college students significantly below state average.
#1 on the list of "Top 100 least-safe cities (highest city-data.com crime index)"
#21 on the list of "Top 100 cities with declining populations from 2000 to 2014"
#1 on the list of "Top 101 counties with the most Evangelical Protestant congregations"
#1 on the list of "Top 101 counties with the most Mainline Protestant congregations"
#1 on the list of "Top 101 counties with the most Orthodox adherents"
#1 on the list of "Top 101 counties with the highest ground withdrawal of fresh water for public supply (pop. 50,000+)"
#1 on the list of "Top 101 counties with the most Catholic adherents (pop. 50,000+)"
Top Patent Applicants
Edward Liu (3)
Paul Tsai (1)
Jim Lai (1)
Randy Dunn (1)
Lincoln Global, Inc. (1)
David J. Landeros (1)
John Jiin Chung Yang (1)
Prolacta Bioscience, Inc. (1)
Dennis Loo (1)
Wen Hao (1)
Total of 14 patent applications in 2008-2024.
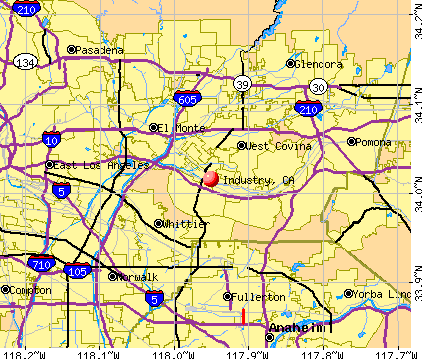


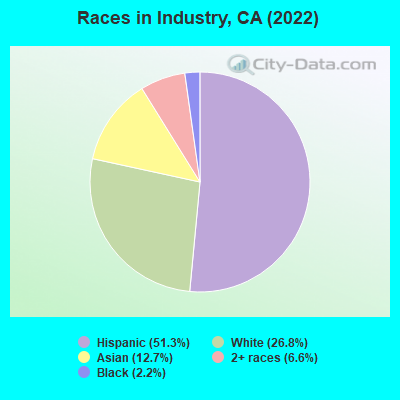
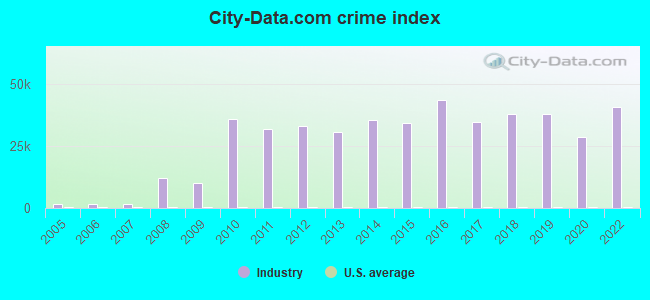
 Recent articles from our blog. Our writers, many of them Ph.D. graduates or candidates, create easy-to-read articles on a wide variety of topics.

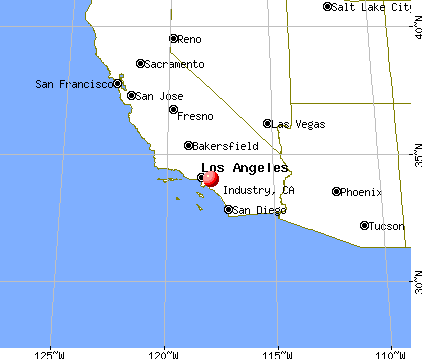
 (1.5 miles
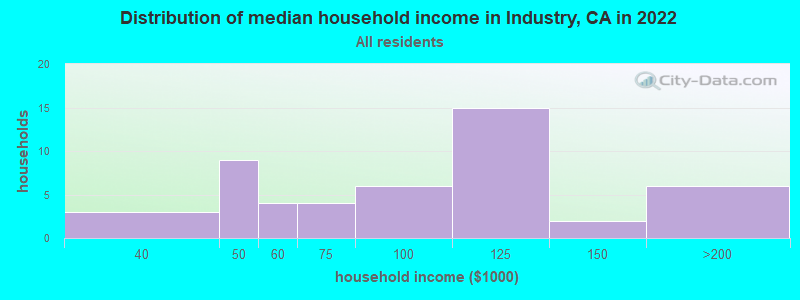
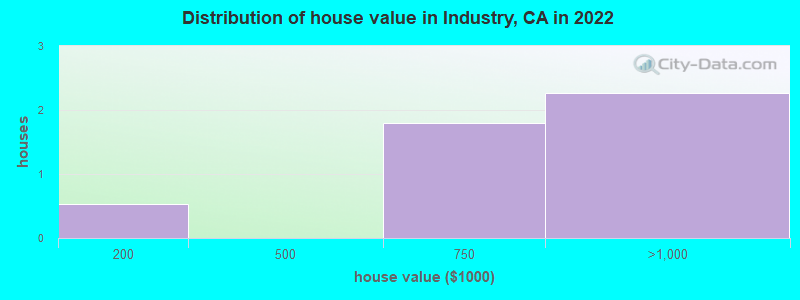
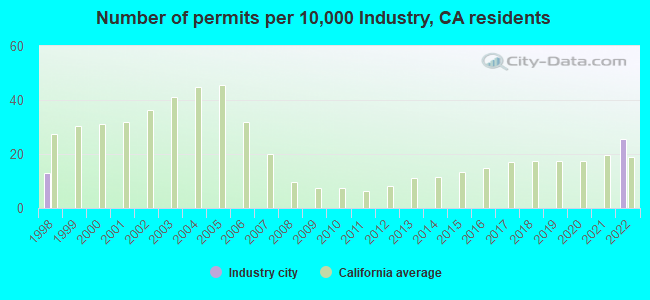
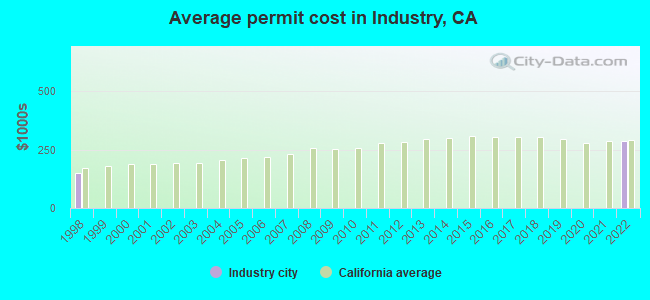
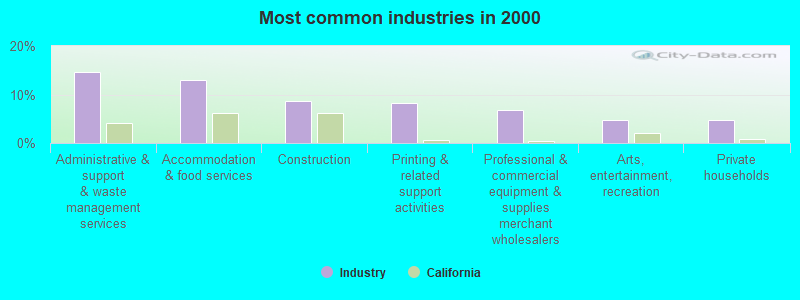
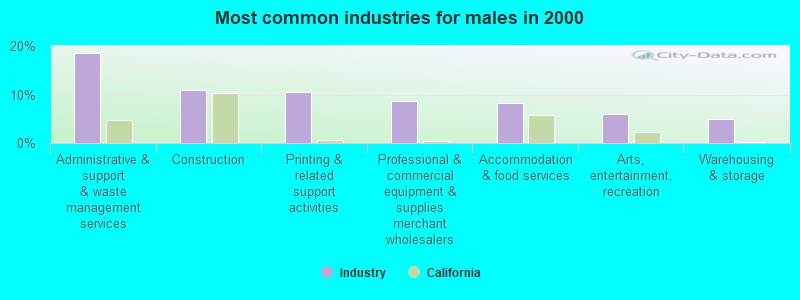
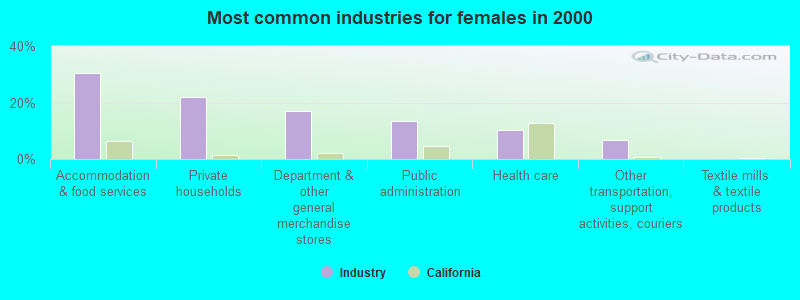
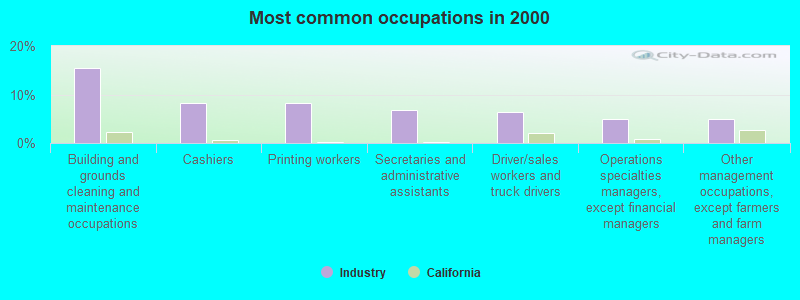
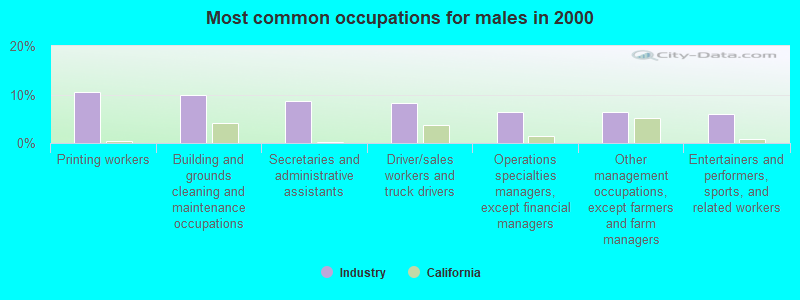
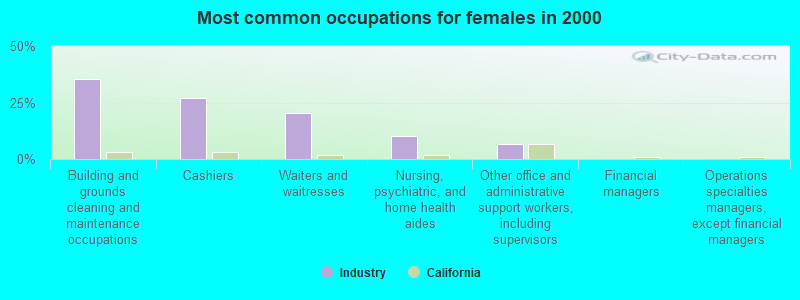
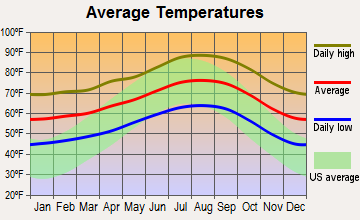
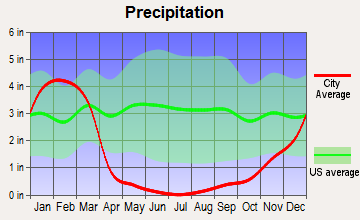
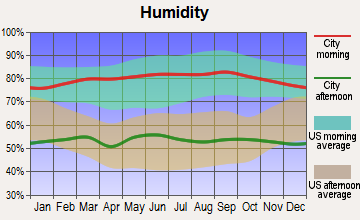
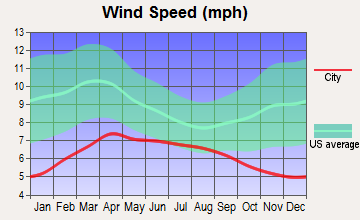
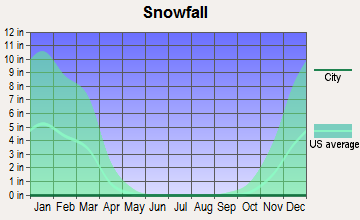
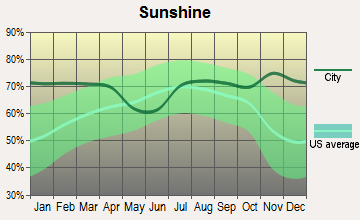
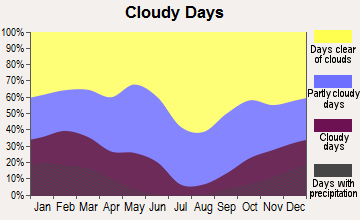
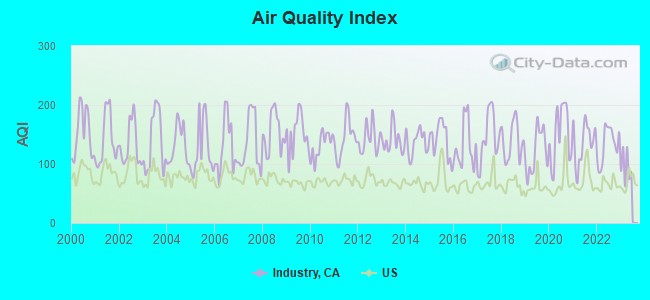
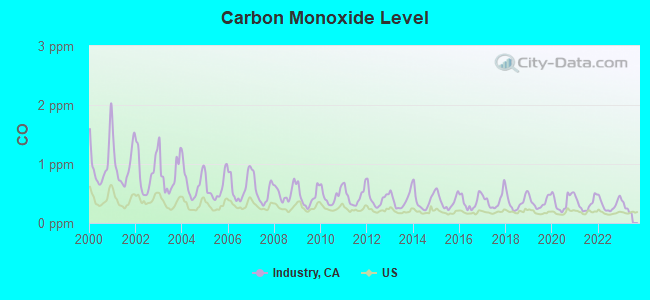
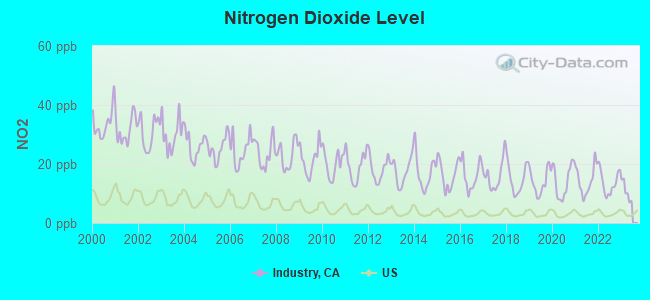
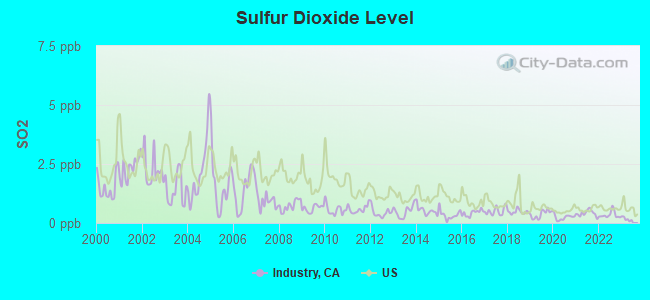

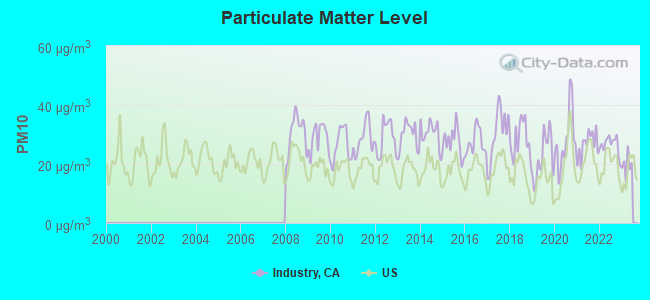
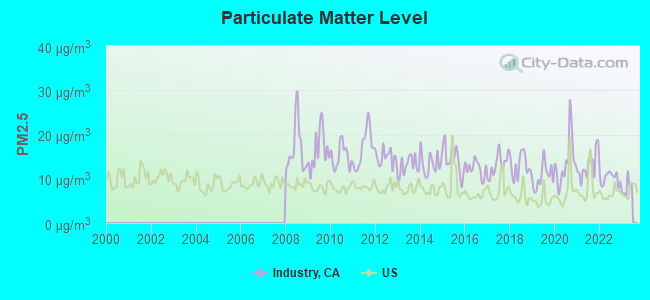
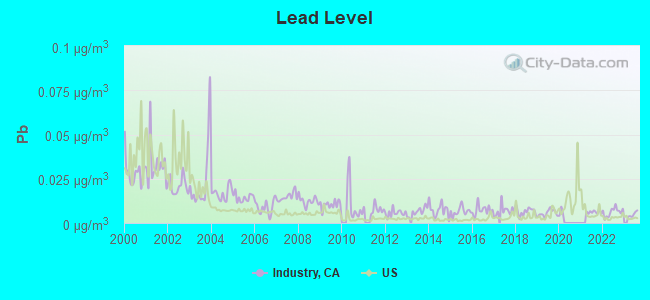
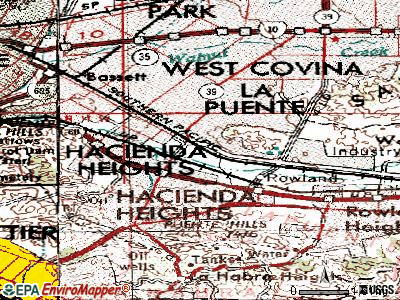
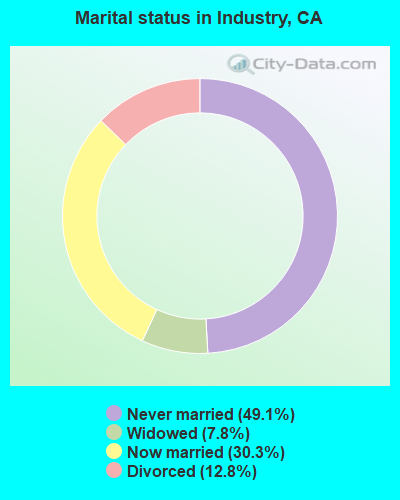
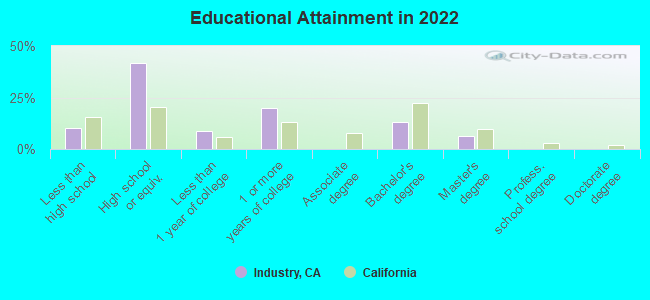
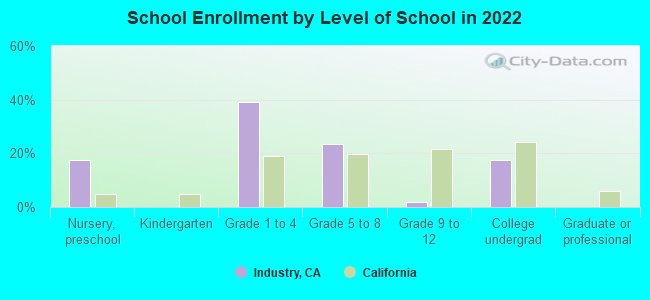
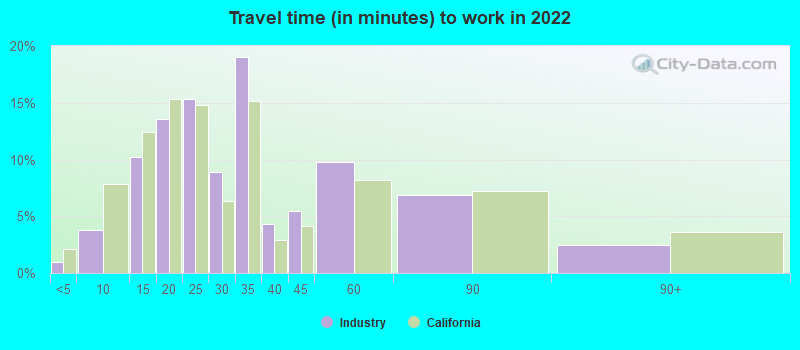
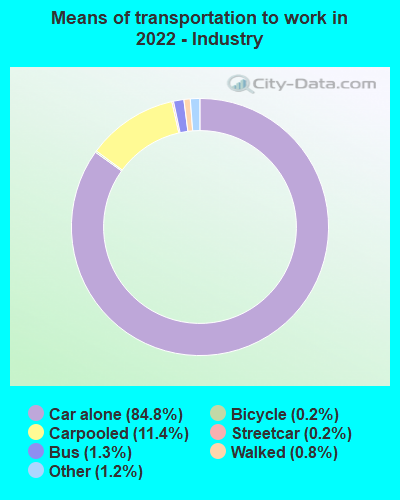


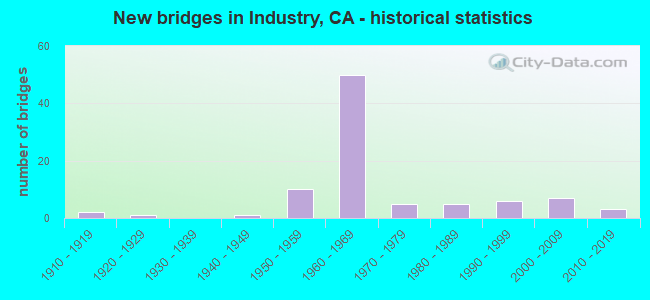
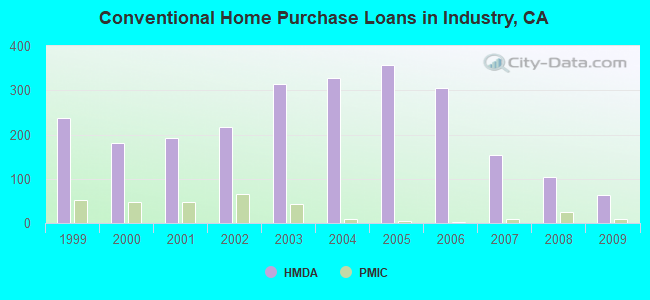
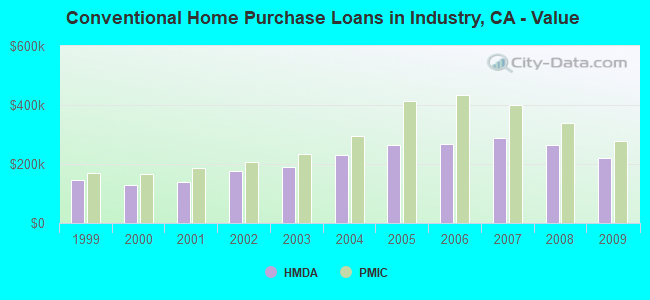
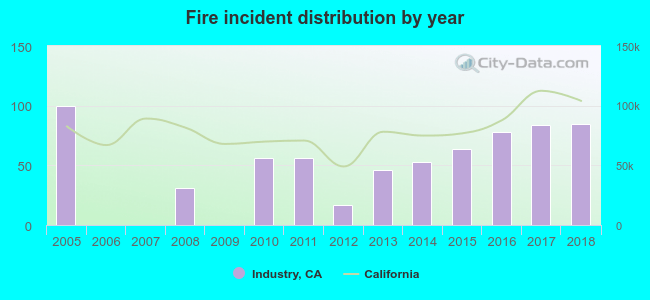 Based on the data from the years 2005 - 2018 the average number of fire incidents per year is 48. The highest number of reported fires - 100 took place in 2005, and the least - 0 in 2006. The data has a dropping trend.
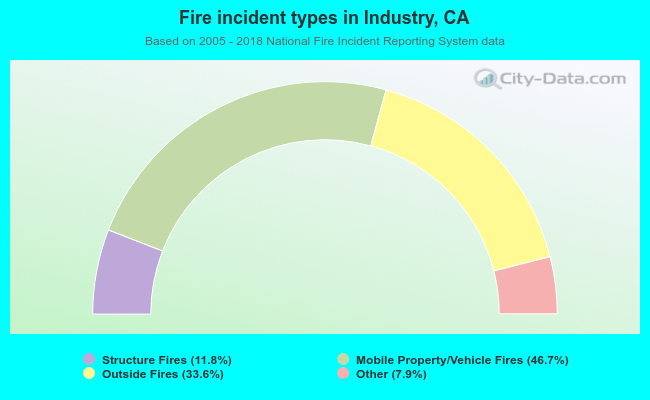 When looking into fire subcategories, the most reports belonged to: Mobile Property/Vehicle Fires (46.7%), and Outside Fires (33.6%).