Kensington, California
Submit your own pictures of this place and show them to the world
- OSM Map
- General Map
- Google Map
- MSN Map
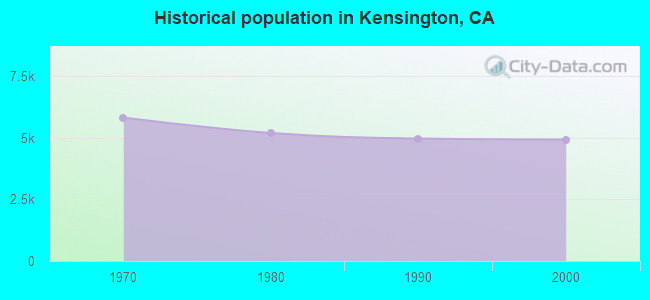
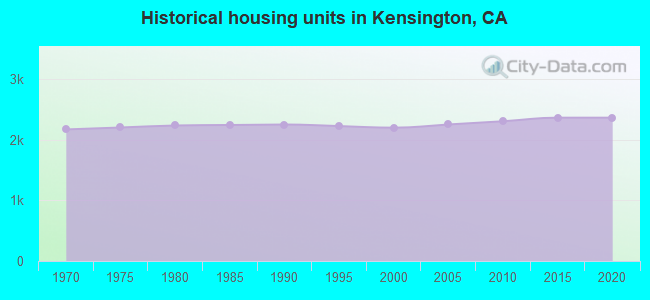
Population change since 2000: +2.9%
| Males: 2,384 | |
| Females: 2,693 |
| Median resident age: | 48.4 years |
| California median age: | 37.9 years |
Zip codes: 94708.
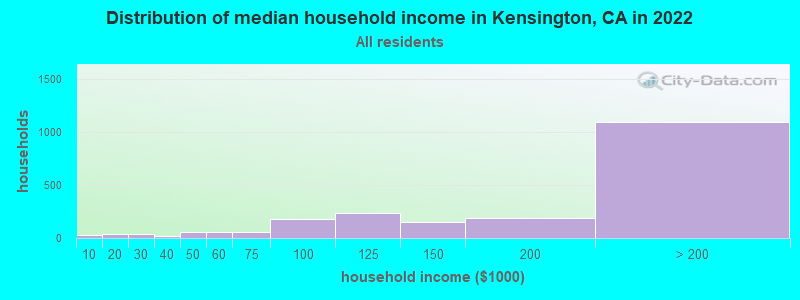
| Kensington: | $199,876 |
| CA: | $91,551 |
Estimated per capita income in 2022: $102,552 (it was $55,275 in 2000)
Kensington CDP income, earnings, and wages data
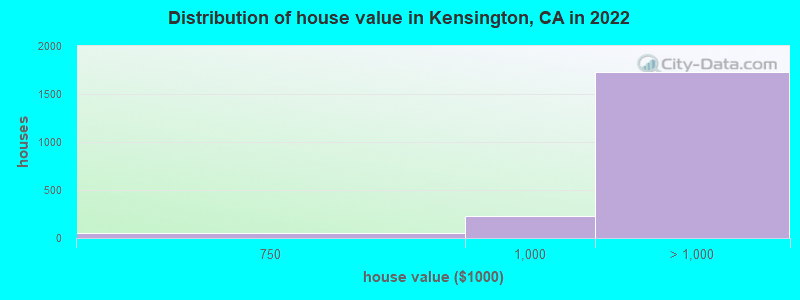
Estimated median house or condo value in 2022: over $1,000,000 (it was $423,800 in 2000)
| Kensington: | over $1,000,000 |
| CA: | $715,900 |
Mean prices in 2022: all housing units: over $1,000,000; detached houses: over $1,000,000; in 2-unit structures: $830,108
Median gross rent in 2022: $3,457.
(2.5% for White Non-Hispanic residents, 24.3% for Black residents, 8.6% for Hispanic or Latino residents, 100.0% for Native Hawaiian and other Pacific Islander residents, 2.4% for two or more races residents)
Detailed information about poverty and poor residents in Kensington, CA

Compare current foreclosures near Kensington, CA:
| Photo | Address | Area | Beds / Baths | Price | Details |
|---|---|---|---|---|---|

|
#1
Macarthur Blvd
Oakland, CA 94605
|
1,313 sq. feet
|
3 baths 3 beds |
$599,000
|
show details |

|
#2
Hastings Ave
Vallejo, CA 94589
|
1,104 sq. feet
|
2 baths 3 beds |
$529,000
|
show details |

|
#3
Limestone Dr
Vallejo, CA 94589
|
1,677 sq. feet
|
2 baths 4 beds |
$609,000
|
show details |

|
#4
Thorndale Dr Apt 435
San Rafael, CA 94903
|
1,096 sq. feet
|
2 baths 2 beds |
$149,900
|
show details |

|
#5
2nd St
Richmond, CA 94801
|
887 sq. feet
|
1 baths 3 beds |
$364,000
|
show details |

|
#6
Thorndale Dr Apt 206
San Rafael, CA 94903
|
660 sq. feet
|
1 baths 1 beds |
$59,900
|
show details |

|
#7
Ritchie St
Oakland, CA 94605
|
2,208 sq. feet
|
2 baths 3 beds |
show details | |

|
#8
El Portal Dr Apt D
San Pablo, CA 94806
|
1,058 sq. feet
|
2 baths 2 beds |
show details | |

|
#9
Mohr Ln Apt C
Concord, CA 94518
|
870 sq. feet
|
1 baths 2 beds |
show details | |

|
#10
Kelsey St
Richmond, CA 94801
|
1,080 sq. feet
|
3 baths 4 beds |
show details |
| Photo | Address | Area | Beds / Baths | Price | Details |
|---|---|---|---|---|---|

|
#11
83rd Ave
Oakland, CA 94621
|
1,304 sq. feet
|
1 baths 3 beds |
show details | |

|
#12
California Ave
Mill Valley, CA 94941
|
2,678 sq. feet
|
3 baths 3 beds |
show details | |

|
#13
Vienna St
San Francisco, CA 94112
|
760 sq. feet
|
1 baths 3 beds |
show details | |

|
#14
Lincoln Ave
Richmond, CA 94804
|
795 sq. feet
|
1 baths 2 beds |
show details | |

|
#15
Heide Ct
El Sobrante, CA 94803
|
4,151 sq. feet
|
3 baths 5 beds |
show details | |

|
#16
Grovenor Dr
Castro Valley, CA 94546
|
2,184 sq. feet
|
2 baths 4 beds |
show details | |

|
#17
E 31st St
Oakland, CA 94602
|
688 sq. feet
|
1 baths 2 beds |
show details | |

|
#18
Vermont St
San Francisco, CA 94107
|
1,520 sq. feet
|
2 baths 2 beds |
show details | |

|
#19
Oakdale Ave
Oakland, CA 94605
|
2,020 sq. feet
|
3 baths 3 beds |
show details | |

|
#20
72nd Ave
Oakland, CA 94621
|
1,170 sq. feet
|
2 baths 3 beds |
show details |
| Photo | Address | Area | Beds / Baths | Price | Details |
|---|---|---|---|---|---|

|
#21
31st Ave
San Francisco, CA 94116
|
1,115 sq. feet
|
1 baths 2 beds |
show details | |

|
#22
Begonia Dr
San Leandro, CA 94578
|
2,741 sq. feet
|
3 baths 5 beds |
show details | |

|
#23
Russell St
Vallejo, CA 94591
|
840 sq. feet
|
1 baths 2 beds |
show details | |

|
#24
Acapulco Rd
San Leandro, CA 94577
|
1,196 sq. feet
|
2 baths 3 beds |
show details | |

|
#25
101st Ave
Oakland, CA 94603
|
1,134 sq. feet
|
1 baths 3 beds |
show details | |

|
#26
Overland Ave
Emeryville, CA 94608
|
- sq. feet
|
- baths - beds |
$72,950
|
show details |

|
#27
Warner Ct
San Rafael, CA 94901
|
1,664 sq. feet
|
2 baths 4 beds |
show details | |

|
#28
Kelvin Rd
El Sobrante, CA 94803
|
1,718 sq. feet
|
1 baths 3 beds |
show details | |

|
#29
Mark Ave
Vallejo, CA 94589
|
1,457 sq. feet
|
2 baths 4 beds |
show details | |

|
#30
Los Angeles St
Emeryville, CA 94608
|
803 sq. feet
|
1 baths 2 beds |
show details |
| Photo | Address | Area | Beds / Baths | Price | Details |
|---|---|---|---|---|---|

|
#31
Marcella St
San Leandro, CA 94578
|
1,426 sq. feet
|
1 baths 3 beds |
show details | |

|
#32
Vale Rd Apt 35
San Pablo, CA 94806
|
1,858 sq. feet
|
3 baths 3 beds |
show details | |

|
#33
Daniels Ave
Vallejo, CA 94590
|
1,782 sq. feet
|
2 baths 4 beds |
show details | |

|
#34
F St
Oakland, CA 94603
|
842 sq. feet
|
1 baths 2 beds |
show details | |

|
#35
Highland Dr
Concord, CA 94520
|
1,188 sq. feet
|
2 baths 3 beds |
show details | |

|
#36
36th St
Richmond, CA 94805
|
1,116 sq. feet
|
1 baths 2 beds |
show details | |

|
#37
Georgia St
Vallejo, CA 94591
|
868 sq. feet
|
1 baths 2 beds |
show details | |

|
#38
Whyte Park Ave
Walnut Creek, CA 94595
|
2,389 sq. feet
|
2 baths 3 beds |
show details | |

|
#39
Olima St
Sausalito, CA 94965
|
- sq. feet
|
2 baths 4 beds |
show details | |

|
#40
Byxbee St
San Francisco, CA 94132
|
800 sq. feet
|
1 baths 1 beds |
show details |
| Photo | Address | Area | Beds / Baths | Price | Details |
|---|---|---|---|---|---|

|
#41
Duperu Dr
Crockett, CA 94525
|
2,476 sq. feet
|
3 baths 4 beds |
show details | |

|
#42
Garfield St
San Francisco, CA 94132
|
1,355 sq. feet
|
1 baths 3 beds |
show details | |

|
#43
Endicott St
San Leandro, CA 94579
|
1,164 sq. feet
|
1 baths 2 beds |
show details | |

|
#44
Holloway Ave
San Francisco, CA 94132
|
1,110 sq. feet
|
5 baths 1 beds |
show details | |

|
#45
Cayuga Ave
San Francisco, CA 94112
|
800 sq. feet
|
1 baths 2 beds |
show details | |

|
#46
Minerva St
San Francisco, CA 94112
|
878 sq. feet
|
1 baths 2 beds |
show details | |

|
#47
Leonard St
Vallejo, CA 94589
|
1,620 sq. feet
|
2 baths 3 beds |
show details | |

|
#48
86th Ave
Oakland, CA 94621
|
835 sq. feet
|
1 baths 2 beds |
show details | |

|
#49
Munich St
San Francisco, CA 94112
|
1,103 sq. feet
|
1 baths 2 beds |
show details | |

|
Check over 1 million property listings on Foreclosure.com!
|
browse all offers | |||


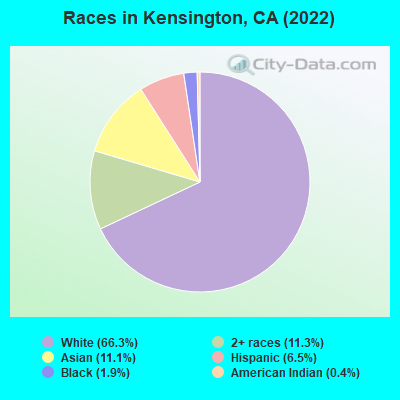
- 3,50166.3%White alone
- 59811.3%Two or more races
- 58611.1%Asian alone
- 3446.5%Hispanic
- 1011.9%Black alone
- 220.4%American Indian alone
Type |
2009 |
2010 |
2011 |
2012 |
2013 |
2014 |
2015 |
2016 |
2017 |
2018 |
2019 |
2020 |
2021 |
2022 |
|---|---|---|---|---|---|---|---|---|---|---|---|---|---|---|
| Murders (per 100,000) | 0 (0.0) | 0 (0.0) | 1 (19.5) | 1 (19.3) | 0 (0.0) | 0 (0.0) | 0 (0.0) | 0 (0.0) | 0 (0.0) | 0 (0.0) | 0 (0.0) | 0 (0.0) | 0 (0.0) | 0 (0.0) |
| Rapes (per 100,000) | 0 (0.0) | 0 (0.0) | 0 (0.0) | 0 (0.0) | 0 (0.0) | 1 (18.9) | 0 (0.0) | 0 (0.0) | 1 (18.5) | 0 (0.0) | 1 (18.5) | 0 (0.0) | 0 (0.0) | 0 (0.0) |
| Robberies (per 100,000) | 1 (18.6) | 0 (0.0) | 1 (19.5) | 3 (57.9) | 0 (0.0) | 0 (0.0) | 0 (0.0) | 0 (0.0) | 1 (18.5) | 0 (0.0) | 1 (18.5) | 0 (0.0) | 0 (0.0) | 0 (0.0) |
| Assaults (per 100,000) | 2 (37.1) | 2 (39.4) | 1 (19.5) | 0 (0.0) | 5 (95.6) | 1 (18.9) | 1 (18.8) | 3 (55.9) | 1 (18.5) | 2 (37.0) | 3 (55.5) | 3 (59.1) | 0 (0.0) | 2 (39.8) |
| Burglaries (per 100,000) | 34 (631.1) | 37 (728.8) | 28 (545.1) | 30 (578.6) | 36 (688.3) | 16 (303.0) | 21 (394.1) | 20 (372.9) | 13 (240.9) | 13 (240.7) | 15 (277.4) | 10 (197.0) | 3 (59.5) | 22 (437.5) |
| Thefts (per 100,000) | 54 (1,002) | 61 (1,201) | 51 (992.8) | 45 (867.9) | 35 (669.2) | 25 (473.4) | 52 (975.8) | 36 (671.1) | 29 (537.3) | 30 (555.6) | 25 (462.4) | 66 (1,300) | 20 (396.6) | 70 (1,392) |
| Auto thefts (per 100,000) | 8 (148.5) | 12 (236.4) | 14 (272.5) | 10 (192.9) | 14 (267.7) | 5 (94.7) | 13 (243.9) | 0 (0.0) | 7 (129.7) | 5 (92.6) | 8 (148.0) | 5 (98.5) | 10 (198.3) | 16 (318.2) |
| Arson (per 100,000) | 0 (0.0) | 0 (0.0) | 0 (0.0) | 2 (38.6) | 2 (38.2) | 0 (0.0) | 0 (0.0) | 0 (0.0) | 1 (18.5) | 0 (0.0) | 0 (0.0) | 0 (0.0) | 1 (19.8) | 0 (0.0) |
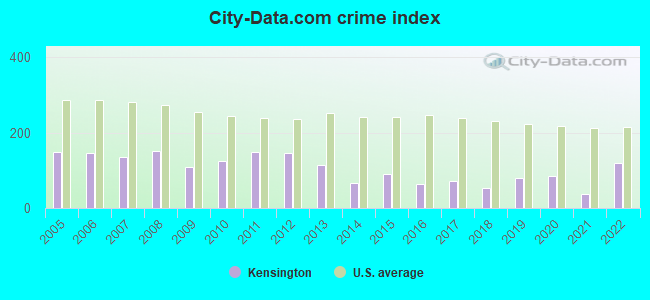
| City-Data.com crime index | 109.2 | 125.9 | 148.3 | 146.6 | 115.5 | 66.7 | 89.9 | 64.1 | 72.8 | 53.9 | 81.2 | 85.5 | 35.9 | 119.7 |
The City-Data.com crime index weighs serious crimes and violent crimes more heavily. Higher means more crime, U.S. average is 246.1. It adjusts for the number of visitors and daily workers commuting into cities.
Crime rate in Kensington detailed stats: murders, rapes, robberies, assaults, burglaries, thefts, arson
Full-time law enforcement employees in 2021, including police officers: 6 (6 officers - 5 male; 1 female).
| Officers per 1,000 residents here: | 1.19 |
| California average: | 2.30 |
 Recent articles from our blog. Our writers, many of them Ph.D. graduates or candidates, create easy-to-read articles on a wide variety of topics.

 | One day in San Diego....Ideas? (26 replies) |
| Independent wealthy, with multigen. family where to move? (70 replies) |
| Possible Move to San Diego - Need some feedback on some towns (41 replies) |
| Where to live in SD as DINKs (35 replies) |
| Quietest Berkeley/Oakland hoods near BART (25 replies) |
| Kensington/Np/Normal Heights a good compromise? (4 replies) |
Latest news from Kensington, CA collected exclusively by city-data.com from local newspapers, TV, and radio stations
Ancestries: European (14.0%), English (7.9%), Danish (6.0%), Irish (4.9%), French (4.1%), Northern European (3.2%).
Current Local Time: PST time zone
Elevation: 600 feet
Land area: 1.15 square miles.
Population density: 4,425 people per square mile (average).
698 residents are foreign born (6.6% Asia, 5.0% Europe, 1.3% Latin America).
| This place: | 13.2% |
| California: | 26.5% |
Median real estate property taxes paid for housing units with mortgages in 2022: $10,187 (0.7%)
Median real estate property taxes paid for housing units with no mortgage in 2022: $4,943 (0.4%)
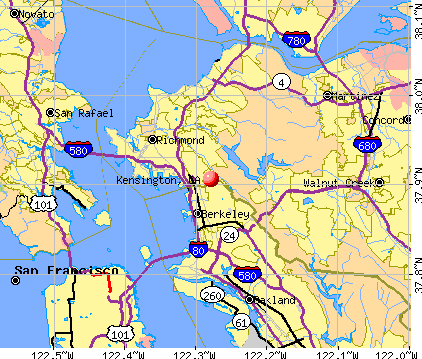
Nearest city with pop. 50,000+: Berkeley, CA  (2.4 miles , pop. 102,743).
Nearest city with pop. 200,000+: West Contra Costa, CA (4.1 miles , pop. 236,008).
Nearest city with pop. 1,000,000+: Los Angeles, CA (342.7 miles , pop. 3,694,820).
Nearest cities:
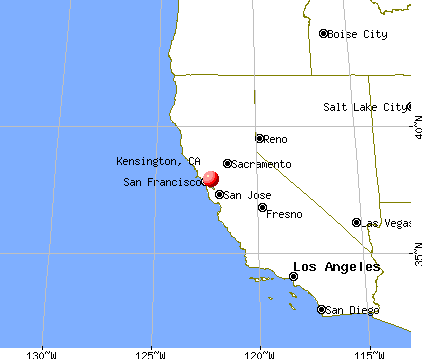
), ), )Latitude: 37.91 N, Longitude: 122.28 W
Daytime population change due to commuting: -407 (-7.7%)
Workers who live and work in this place: 1,487 (58.1%)
Area code commonly used in this area: 510
| Here: | 4.5% |
| California: | 5.1% |
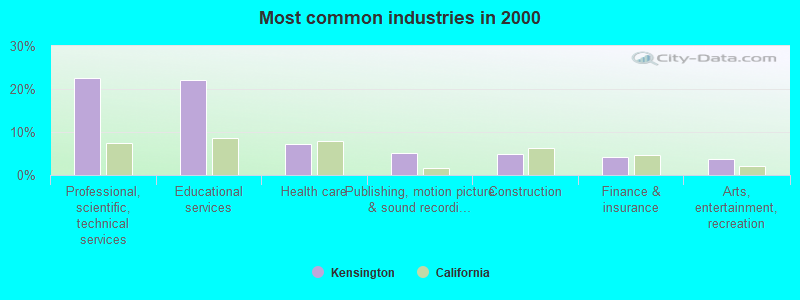
- Professional, scientific, technical services (22.6%)
- Educational services (22.1%)
- Health care (7.3%)
- Publishing, motion picture & sound recording industries (5.0%)
- Construction (4.9%)
- Finance & insurance (4.1%)
- Arts, entertainment, recreation (3.8%)
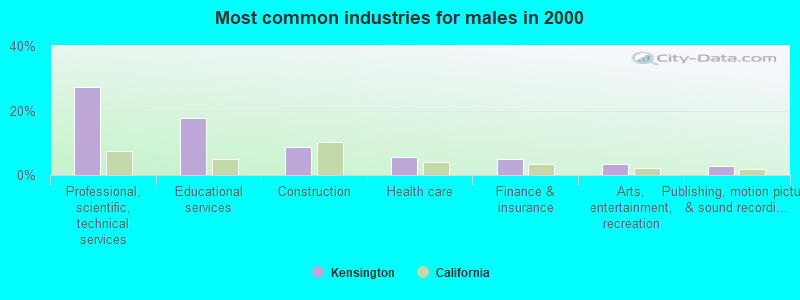
- Professional, scientific, technical services (27.2%)
- Educational services (17.7%)
- Construction (8.7%)
- Health care (5.7%)
- Finance & insurance (5.1%)
- Arts, entertainment, recreation (3.3%)
- Publishing, motion picture & sound recording industries (2.9%)
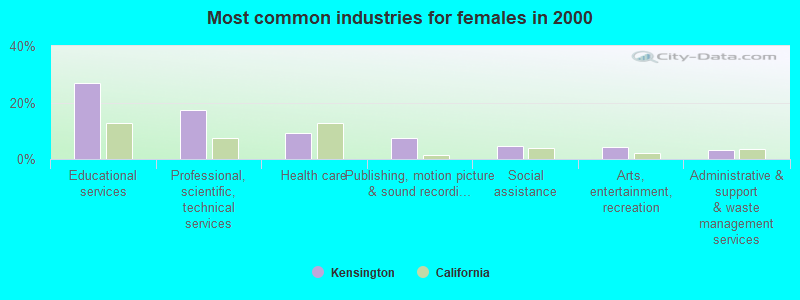
- Educational services (27.1%)
- Professional, scientific, technical services (17.3%)
- Health care (9.2%)
- Publishing, motion picture & sound recording industries (7.5%)
- Social assistance (4.7%)
- Arts, entertainment, recreation (4.4%)
- Administrative & support & waste management services (3.3%)
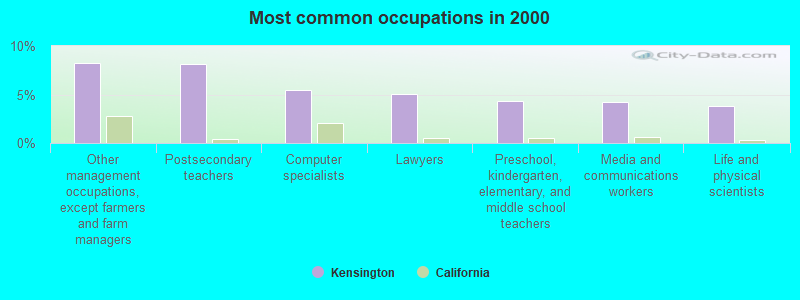
- Other management occupations, except farmers and farm managers (8.2%)
- Postsecondary teachers (8.2%)
- Computer specialists (5.5%)
- Lawyers (5.0%)
- Preschool, kindergarten, elementary, and middle school teachers (4.3%)
- Media and communications workers (4.3%)
- Life and physical scientists (3.8%)
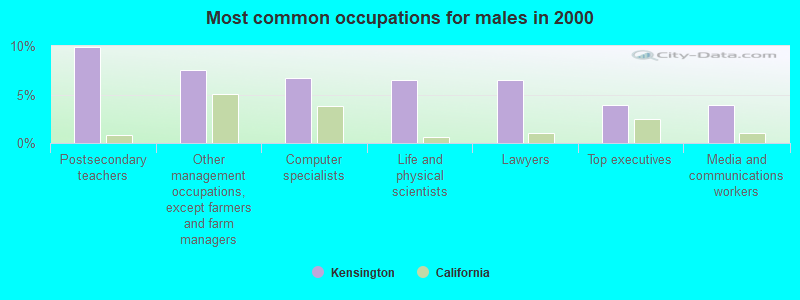
- Postsecondary teachers (9.9%)
- Other management occupations, except farmers and farm managers (7.5%)
- Computer specialists (6.7%)
- Life and physical scientists (6.4%)
- Lawyers (6.4%)
- Top executives (3.9%)
- Media and communications workers (3.9%)
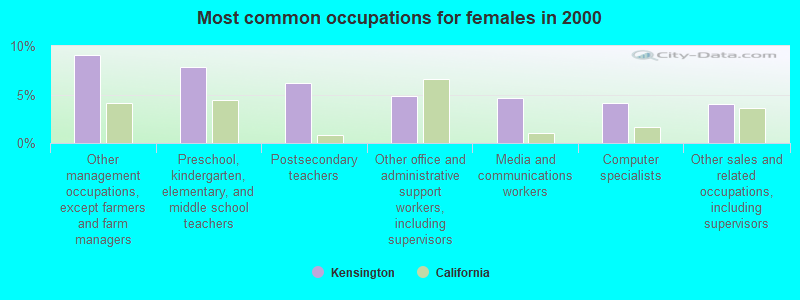
- Other management occupations, except farmers and farm managers (9.0%)
- Preschool, kindergarten, elementary, and middle school teachers (7.9%)
- Postsecondary teachers (6.2%)
- Other office and administrative support workers, including supervisors (4.9%)
- Media and communications workers (4.6%)
- Computer specialists (4.1%)
- Other sales and related occupations, including supervisors (4.1%)
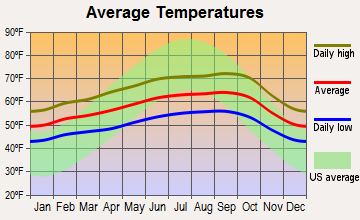
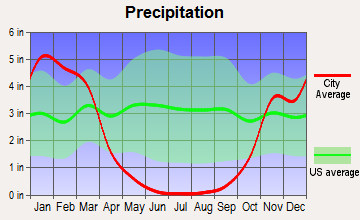
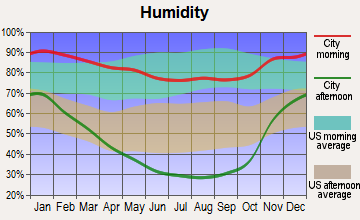
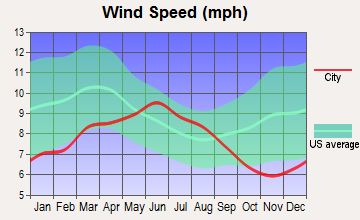
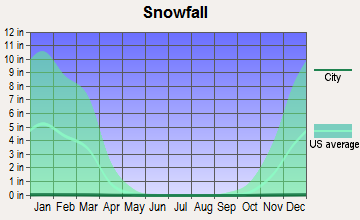
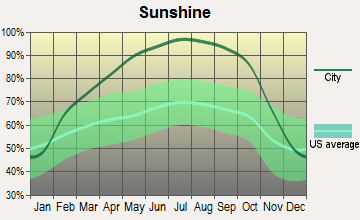
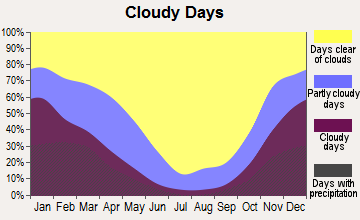
Average climate in Kensington, California
Based on data reported by over 4,000 weather stations
|
|

(lower is better)
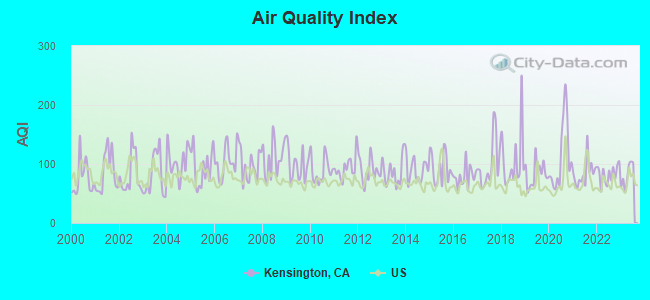
Air Quality Index (AQI) level in 2023 was 81.2. This is about average.
| City: | 81.2 |
| U.S.: | 72.6 |
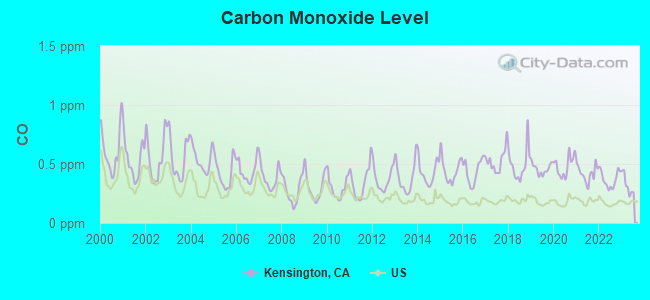
Carbon Monoxide (CO) [ppm] level in 2023 was 0.323. This is worse than average. Closest monitor was 2.3 miles away from the city center.
| City: | 0.323 |
| U.S.: | 0.251 |
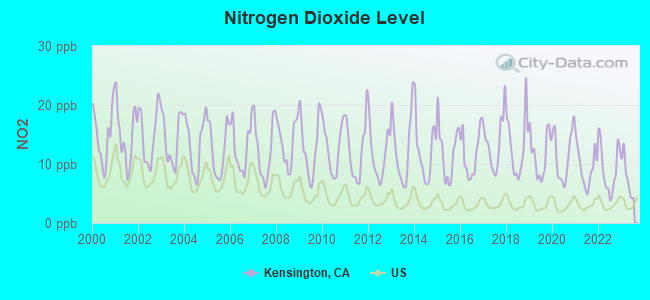
Nitrogen Dioxide (NO2) [ppb] level in 2023 was 7.82. This is significantly worse than average. Closest monitor was 2.1 miles away from the city center.
| City: | 7.82 |
| U.S.: | 5.11 |
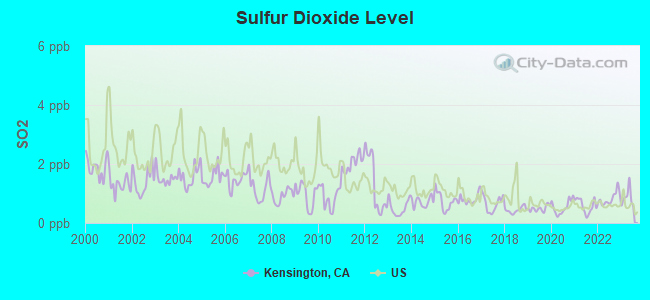
Sulfur Dioxide (SO2) [ppb] level in 2023 was 0.868. This is significantly better than average. Closest monitor was 2.1 miles away from the city center.
| City: | 0.868 |
| U.S.: | 1.515 |
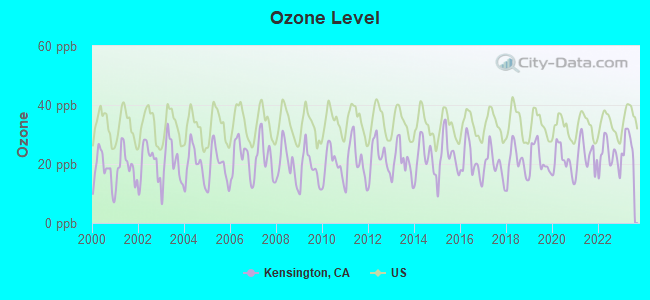
Ozone [ppb] level in 2023 was 26.9. This is better than average. Closest monitor was 2.3 miles away from the city center.
| City: | 26.9 |
| U.S.: | 33.3 |
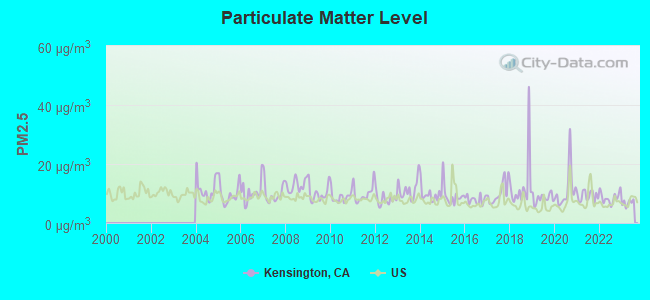
Particulate Matter (PM2.5) [µg/m3] level in 2023 was 6.82. This is about average. Closest monitor was 3.1 miles away from the city center.
| City: | 6.82 |
| U.S.: | 8.11 |
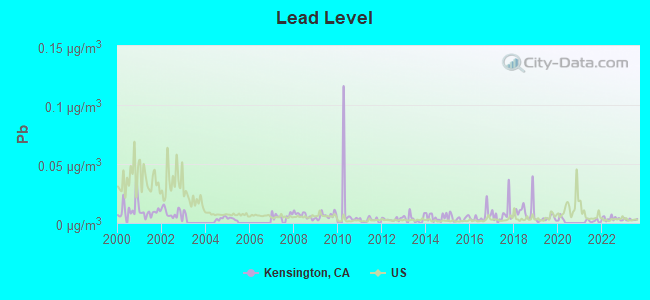
Lead (Pb) [µg/m3] level in 2023 was 0.00290. This is significantly better than average. Closest monitor was 2.1 miles away from the city center.
| City: | 0.00290 |
| U.S.: | 0.00931 |
Earthquake activity:
Kensington-area historical earthquake activity is significantly above California state average. It is 7536% greater than the overall U.S. average.On 4/18/1906 at 13:12:21, a magnitude 7.9 (7.9 UK, Class: Major, Intensity: VIII - XII) earthquake occurred 39.9 miles away from the city center, causing $524,000,000 total damage
On 10/18/1989 at 00:04:15, a magnitude 7.1 (6.5 MB, 7.1 MS, 6.9 MW, 7.0 ML) earthquake occurred 61.7 miles away from Kensington center, causing 62 deaths (62 shaking deaths) and 3757 injuries, causing $1,305,032,704 total damage
On 11/4/1927 at 13:51:53, a magnitude 7.5 (7.5 UK) earthquake occurred 218.2 miles away from the city center
On 7/21/1952 at 11:52:14, a magnitude 7.7 (7.7 UK) earthquake occurred 271.4 miles away from Kensington center, causing $50,000,000 total damage
On 1/31/1922 at 13:17:28, a magnitude 7.6 (7.6 UK) earthquake occurred 260.8 miles away from the city center
On 4/25/1992 at 18:06:04, a magnitude 7.2 (6.3 MB, 7.1 MS, 7.2 MW, 7.1 MW, Depth: 9.4 mi) earthquake occurred 194.4 miles away from the city center, causing $75,000,000 total damage
Magnitude types: body-wave magnitude (MB), local magnitude (ML), surface-wave magnitude (MS), moment magnitude (MW)
Natural disasters:
The number of natural disasters in Contra Costa County (18) is near the US average (15).Major Disasters (Presidential) Declared: 11
Emergencies Declared: 3
Causes of natural disasters: Floods: 13, Storms: 7, Winter Storms: 7, Mudslides: 5, Landslides: 4, Drought: 1, Earthquake: 1, Hurricane: 1, Tornado: 1, Wind: 1, Other: 1 (Note: some incidents may be assigned to more than one category).
Hospitals and medical centers near Kensington:
- CARLSON CONV HOSP (Nursing Home, about 2 miles away; EL CERRITO, CA)
- SHIELDS NURSING CENTER (Nursing Home, about 2 miles away; EL CERRITO, CA)
- BLIZE HEALTHCARE (Home Health Center, about 2 miles away; ALBANY, CA)
- EL CERRITO DIALYSIS CENTER (Dialysis Facility, about 2 miles away; EL CERRITO, CA)
- CHAPARRAL HOUSE (Nursing Home, about 3 miles away; BERKELEY, CA)
- ALTA BATES - HERRICK HOSPITAL D/P SNF (Nursing Home, about 3 miles away; BERKELEY, CA)
- ALTA BATES SUMMIT MED CTR - HERRICK CAMPUS D/P SNF (Nursing Home, about 3 miles away; BERKELEY, CA)
Amtrak stations near Kensington:
- 3 miles: BERKELEY (3RD ST. & UNIVERSITY AVE.) . Services: partially wheelchair accessible, public payphones, free short-term parking, free long-term parking, call for taxi service, public transit connection.
- 5 miles: RICHMOND (16TH ST. & MACDONALD AVE.) . Services: fully wheelchair accessible, enclosed waiting area, public restrooms, public payphones, free short-term parking, call for taxi service, public transit connection.
- 5 miles: EMERYVILLE (5885 LANDREGAN ST.) . Services: ticket office, fully wheelchair accessible, enclosed waiting area, public restrooms, public payphones, snack bar, free short-term parking, free long-term parking, call for taxi service, public transit connection.
Colleges/universities with over 2000 students nearest to Kensington:
- Berkeley City College (about 3 miles; Berkeley, CA; Full-time enrollment: 3,146)
- University of California-Berkeley (about 3 miles; Berkeley, CA; FT enrollment: 37,127)
- Contra Costa College (about 6 miles; San Pablo, CA; FT enrollment: 4,249)
- Laney College (about 8 miles; Oakland, CA; FT enrollment: 5,668)
- College of Alameda (about 9 miles; Alameda, CA; FT enrollment: 3,071)
- Merritt College (about 11 miles; Oakland, CA; FT enrollment: 2,842)
- Saint Mary's College of California (about 11 miles; Moraga, CA; FT enrollment: 4,200)
Public elementary/middle school in Kensington:
- KENSINGTON ELEMENTARY (Students: 380, Location: 90 HIGHLAND BLVD., Grades: KG-6)
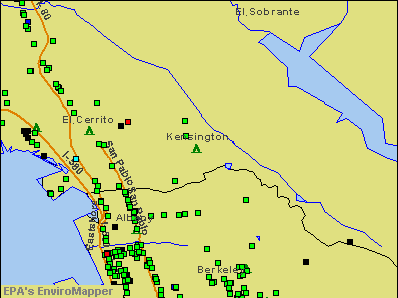
Points of interest:
Notable locations in Kensington: Summit Booster Station El Cerrito Pumping Plant (A), Kensington Branch Contra Costa County Library (B), Kensington Fire Protection District (C). Display/hide their locations on the map
Church in Kensington: Berkeley Park Chapel Community Church (A). Display/hide its location on the map
Cemetery: Sunset View Cemetery (1). Display/hide its location on the map
Reservoir: Summit Reservoir (A). Display/hide its location on the map
| This place: | 2.3 people |
| California: | 2.9 people |
| This place: | 64.4% |
| Whole state: | 68.7% |
| This place: | 6.1% |
| Whole state: | 7.2% |
Likely homosexual households (counted as self-reported same-sex unmarried-partner households)
- Lesbian couples: 1.0% of all households
- Gay men: 1.0% of all households
Banks with branches in Kensington (2011 data):
- Mechanics Bank: Kensington Branch at 279 Arlington Avenue, branch established on 1896/01/01. Info updated 2011/03/24: Bank assets: $2,991.7 mil, Deposits: $2,573.6 mil, headquarters in Richmond, CA, positive income, Commercial Lending Specialization, 31 total offices
For population 15 years and over in Kensington:
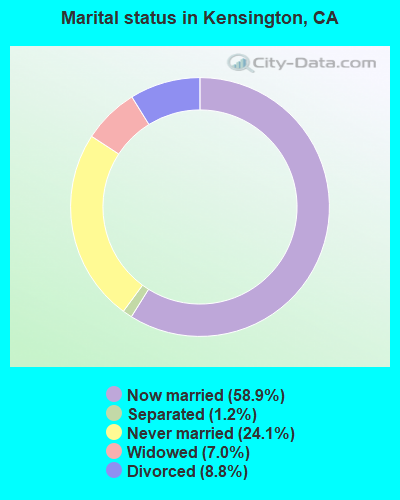
- Never married: 24.1%
- Now married: 58.9%
- Separated: 1.2%
- Widowed: 7.0%
- Divorced: 8.8%
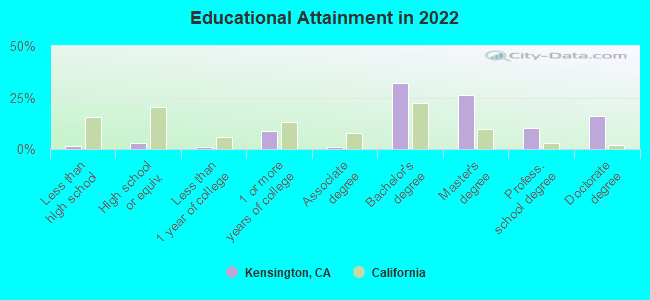
For population 25 years and over in Kensington:
- High school or higher: 98.6%
- Bachelor's degree or higher: 83.4%
- Graduate or professional degree: 50.9%
- Unemployed: 1.8%
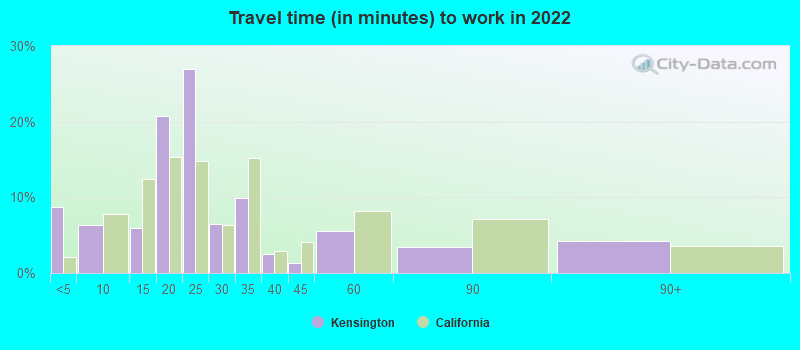
- Mean travel time to work (commute): 16.9 minutes
| Here: | 9.4 |
| California average: | 15.5 |


Graphs represent county-level data. Detailed 2008 Election Results
Religion statistics for Kensington, CA (based on Contra Costa County data)


| Religion | Adherents | Congregations |
|---|---|---|
| Catholic | 228,400 | 34 |
| Evangelical Protestant | 81,120 | 352 |
| Other | 48,553 | 123 |
| Mainline Protestant | 32,693 | 101 |
| Black Protestant | 10,395 | 34 |
| Orthodox | 2,435 | 8 |
| None | 645,429 | - |
Food Environment Statistics:
| This county: | 1.78 / 10,000 pop. |
| California: | 2.14 / 10,000 pop. |
| This county: | 0.05 / 10,000 pop. |
| California: | 0.04 / 10,000 pop. |
| This county: | 0.51 / 10,000 pop. |
| California: | 0.62 / 10,000 pop. |
| Contra Costa County: | 1.75 / 10,000 pop. |
| California: | 1.49 / 10,000 pop. |
| Here: | 6.73 / 10,000 pop. |
| California: | 7.42 / 10,000 pop. |
| Contra Costa County: | 7.1% |
| California: | 7.3% |
| Contra Costa County: | 22.2% |
| State: | 21.3% |
| This county: | 16.8% |
| California: | 17.9% |
Health and Nutrition:
| Here: | 58.1% |
| California: | 49.4% |
| Kensington: | 56.9% |
| State: | 48.0% |
| This city: | 27.7 |
| State: | 28.1 |
| Kensington: | 16.3% |
| State: | 20.2% |
| This city: | 9.6% |
| State: | 11.2% |
| Kensington: | 7.0 |
| State: | 6.8 |
| Here: | 33.9% |
| California: | 31.5% |
| This city: | 62.2% |
| State: | 56.4% |
| This city: | 79.6% |
| California: | 80.9% |
More about Health and Nutrition of Kensington, CA Residents
6.37% of this county's 2021 resident taxpayers lived in other counties in 2020 ($134,084 average adjusted gross income)
| Here: | 6.37% |
| California average: | 5.19% |
0.01% of residents moved from foreign countries ($98 average AGI)
Contra Costa County: 0.01% California average: 0.03%
Top counties from which taxpayers relocated into this county between 2020 and 2021:
| from Alameda County, CA | |
| from San Francisco County, CA | |
| from Santa Clara County, CA |
7.09% of this county's 2020 resident taxpayers moved to other counties in 2021 ($123,334 average adjusted gross income)
| Here: | 7.09% |
| California average: | 6.14% |
0.01% of residents moved to foreign countries ($92 average AGI)
Contra Costa County: 0.01% California average: 0.02%
Top counties to which taxpayers relocated from this county between 2020 and 2021:
| to Alameda County, CA | |
| to Solano County, CA | |
| to San Francisco County, CA |
Businesses in Kensington, CA
- Ace Hardware: 1
- FedEx: 1
Strongest AM radio stations in Kensington:
- KNEW (910 AM; 20 kW; OAKLAND, CA; Owner: AMFM RADIO LICENSES, L.L.C.)
- KTRB (860 AM; 50 kW; MODESTO, CA; Owner: PAPPAS RADIO OF CALIFORNIA, A CALIFORNIA LIMITED PARTNERSHIP)
- KIQI (1010 AM; 35 kW; SAN FRANCISCO, CA; Owner: RADIO UNICA OF SAN FRANCISCO LICENSE CORP.)
- KFRC (610 AM; 5 kW; SAN FRANCISCO, CA; Owner: INFINITY BROADCASTING CORPORATION OF LOS ANGELES)
- KABL (960 AM; 5 kW; OAKLAND, CA; Owner: AMFM RADIO LICENSES, L.L.C.)
- KCBS (740 AM; 50 kW; SAN FRANCISCO, CA; Owner: INFINITY BROADCASTING OPERATIONS, INC.)
- KMZT (1510 AM; 8 kW; SAN RAFAEL, CA; Owner: MOUNT WILSON FM BROADCASTERS, INC.)
- KTCT (1050 AM; 50 kW; SAN MATEO, CA; Owner: SUSQUEHANNA RADIO CORP.)
- KFAX (1100 AM; 50 kW; SAN FRANCISCO, CA; Owner: GOLDEN GATE BROADCASTING CO, INC.)
- KNBR (680 AM; 50 kW; SAN FRANCISCO, CA; Owner: KNBR LICO, INC.)
- KMKY (1310 AM; 5 kW; OAKLAND, CA; Owner: KGO-AM RADIO, INC.)
- KGO (810 AM; 50 kW; SAN FRANCISCO, CA; Owner: KGO-AM RADIO, INC.)
- KSFO (560 AM; 5 kW; SAN FRANCISCO, CA; Owner: KGO-AM RADIO, INC.)
Strongest FM radio stations in Kensington:
- KALX (90.7 FM; BERKELEY, CA; Owner: UNIVERSITY OF CALIFORNIA)
- KLLC (97.3 FM; SAN FRANCISCO, CA; Owner: INFINITY BROADCASTING OPERATIONS, INC.)
- K249DJ (97.7 FM; SAN PABLO, CA; Owner: EL CERRITO HIGH SCHOOL)
- KKSF-FM1 (103.7 FM; PLEASANTON, ETC., CA; Owner: AMFM RADIO LICENSES, L.L.C.)
- KSFB-FM (100.7 FM; SAN RAFAEL, CA; Owner: GOLDEN GATE BROADCASTING COMPANY, INC.)
- KBLX-FM2 (102.9 FM; PLEASANTON, CA; Owner: ICBC BROADCAST HOLDINGS -CA, INC.)
- KSOL-FM3 (98.9 FM; PLEASANTON, CA; Owner: TMS LICENSE CALIFORNIA, INC)
- KFRC-FM3 (99.7 FM; WALNUT CREEK, CA; Owner: INFINITY KFRC-FM, INC.)
- KZBR-FM1 (95.7 FM; WALNUT CREEK, CA; Owner: BONNEVILLE HOLDING COMPANY)
- KDFC-FM1 (102.1 FM; LAFAYETTE, CA; Owner: BONNEVILLE HOLDING COMPANY)
- KOIT-FM2 (96.5 FM; MARTINEZ, ETC., CA; Owner: BONNEVILLE HOLDING CO. C/O KOIT(FM))
- KIOI-FM1 (101.3 FM; WALNUT CREEK, CA; Owner: AMFM RADIO LICENSES, L.L.C.)
- KISQ-FM3 (98.1 FM; CONCORD, CA; Owner: AMFM RADIO LICENSES, L.L.C.)
- KFJO (92.1 FM; WALNUT CREEK, CA; Owner: CHASE RADIO PROPERTIES, L.L.C.)
- KMEL-FM1 (106.1 FM; CONCORD, CA; Owner: AMFM RADIO LICENSES, L.L.C.)
- KDFC-FM (102.1 FM; SAN FRANCISCO, CA; Owner: BONNEVILLE HOLDING COMPANY)
- KOIT-FM (96.5 FM; SAN FRANCISCO, CA; Owner: BONNEVILLE HOLDING COMPANY)
- KKSF (103.7 FM; SAN FRANCISCO, CA; Owner: AMFM RADIO LICENSES, L.L.C.)
- KFOG (104.5 FM; SAN FRANCISCO, CA; Owner: KFFG LICO, INC)
- KECG (88.1 FM; EL CERRITO, CA; Owner: EL CERRITO HIGH SCHOOL)
TV broadcast stations around Kensington:
- KQED (Channel 9; SAN FRANCISCO, CA; Owner: KQED, INC.)
- KGO-TV (Channel 7; SAN FRANCISCO, CA; Owner: KGO TELEVISION, INC.)
- KPIX-TV (Channel 5; SAN FRANCISCO, CA; Owner: CBS BROADCASTING INC.)
- KTVU (Channel 2; OAKLAND, CA; Owner: KTVU PARTNERSHIP)
- KRON-TV (Channel 4; SAN FRANCISCO, CA; Owner: YOUNG BROADCASTING OF SAN FRANCISCO, INC.)
- KMTP-TV (Channel 32; SAN FRANCISCO, CA; Owner: MINORITY TELEVISION PROJECT)
- KBHK-TV (Channel 44; SAN FRANCISCO, CA; Owner: VIACOM TELEVISION STATIONS GROUP OF SAN FRANCISCO INC.)
- KBWB (Channel 20; SAN FRANCISCO, CA; Owner: KBWB LICENSE, INC.)
- KFSF (Channel 66; VALLEJO, CA; Owner: TELEFUTURA SAN FRANCISCO LLC)
- KCNS (Channel 38; SAN FRANCISCO, CA; Owner: WRAY, INC.)
- KCSM-TV (Channel 60; SAN MATEO, CA; Owner: SAN MATEO COUNTY COMMUNITY COLLEGE DISTRICT)
- KOVR (Channel 13; STOCKTON, CA; Owner: SCI - SACRAMENTO LICENSEE, LLC)
- KXTV (Channel 10; SACRAMENTO, CA; Owner: KXTV, INC.)
- KSPX (Channel 29; SACRAMENTO, CA; Owner: PAXSON SACRAMENTO LICENSE, INC.)
- KCRA-TV (Channel 3; SACRAMENTO, CA; Owner: KCRA HEARST-ARGYLE TELEVISION, INC.)
- KTNC-TV (Channel 42; CONCORD, CA; Owner: KTNC LICENSE, LLC)
- KTXL (Channel 40; SACRAMENTO, CA; Owner: CHANNEL 40, INC.)
- KUVS (Channel 19; MODESTO, CA; Owner: KUVS LICENSE PARTNERSHIP, G.P.)
- KQCA (Channel 58; STOCKTON, CA; Owner: KCRA HEARST-ARGYLE TELEVISION, INC.)
- KVIE (Channel 6; SACRAMENTO, CA; Owner: KVIE, INC.)
- KMAX-TV (Channel 31; SACRAMENTO, CA; Owner: UPN STATIONS GROUP INC.)
- KTSF (Channel 26; SAN FRANCISCO, CA; Owner: LINCOLN BROADCASTING COMPANY, A CALIFORNIA LP)
- KFTL (Channel 64; STOCKTON, CA; Owner: FAMILY STATIONS, INC.)
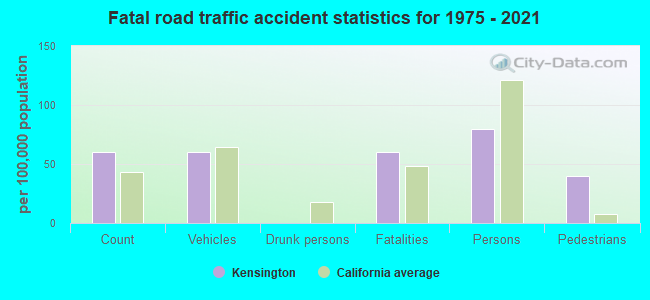
Kensington fatal accident list:
Aug 5, 1991 12:35 AM, Kerravenue, Vehicles: 1, Persons: 1, Pedestrians: 1, Fatalities: 1
Jan 6, 1986 08:15 AM, Franciscan, Vehicles: 1, Persons: 1, Fatalities: 1
FCC Registered Broadcast Land Mobile Towers:
1- Lat: 37.913778 Lon: -122.279111, Call Sign: WQEJ734,
Assigned Frequencies: 467.787 MHz, 467.837 MHz, 467.850 MHz, 467.875 MHz, 467.900 MHz, Grant Date: 11/28/2015, Expiration Date: 02/14/2026, Certifier: Jill Houghton, Registrant: Federal License Management, 1784 E. 3rd Street Suite 269, Williamsport, PA 17701-3862, Phone: (570) 505-3894, Fax: (570) 651-9032, Email:
FCC Registered Microwave Towers:
1- Sunset Drive (Lat: 37.907694 Lon: -122.294667), Overall height: 17.7 m, Call Sign: WPNK622,
Assigned Frequencies: 7000.00 MHz, Grant Date: 10/10/1989, Expiration Date: 12/01/1998, Cancellation Date: 09/03/1996, Registrant: West Coast United Broadcasting Co., 45 Franklin Street, San Francisco, CA 94102
FCC Registered Amateur Radio Licenses:
72 (See the full list of FCC Registered Amateur Radio Licenses in Kensington)FAA Registered Aircraft:
2- Aircraft: PIPER PA-28-140 (Category: Land, Seats: 4, Weight: Up to 12,499 Pounds, Speed: 107 mph), Engine: LYCOMING 0-320 SERIES (180 HP) (Reciprocating)
N-Number: 3945K, N3945K, N-3945K, Serial Number: 28-23821, Year manufactured: 1967, Airworthiness Date: 10/11/1967, Certificate Issue Date: 10/19/2004
Registrant (Individual): Knute A Fisher, 144 Highland Blvd, Kensington, CA 94708 - Aircraft: BEECH B36TC (Category: Land, Seats: 6, Weight: Up to 12,499 Pounds), Engine: CONT MOTOR TSIO-520 SER (300 HP) (Reciprocating)
N-Number: 5599V, N5599V, N-5599V, Serial Number: EA-500, Year manufactured: 1989, Airworthiness Date: 12/11/1989, Certificate Issue Date: 09/08/2015
Registrant (Individual): Eldon G Hoachlander, 252 Stanford Ave, Kensington, CA 94708
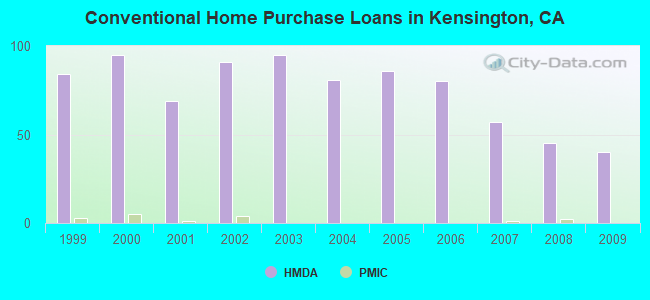
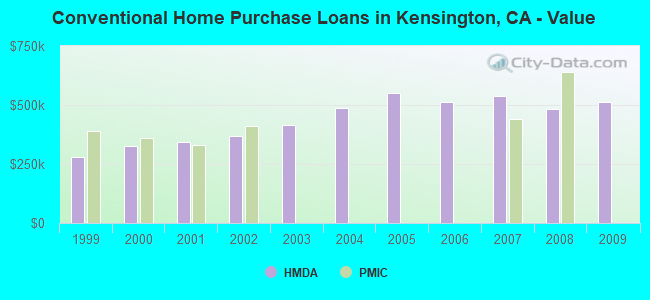
| Home Mortgage Disclosure Act Aggregated Statistics For Year 2009 (Based on 2 full tracts) | ||||||||||
| A) FHA, FSA/RHS & VA Home Purchase Loans | B) Conventional Home Purchase Loans | C) Refinancings | D) Home Improvement Loans | F) Non-occupant Loans on < 5 Family Dwellings (A B C & D) | ||||||
|---|---|---|---|---|---|---|---|---|---|---|
| Number | Average Value | Number | Average Value | Number | Average Value | Number | Average Value | Number | Average Value | |
| LOANS ORIGINATED | 6 | $639,667 | 40 | $511,600 | 281 | $384,288 | 10 | $274,300 | 8 | $297,375 |
| APPLICATIONS APPROVED, NOT ACCEPTED | 0 | $0 | 3 | $426,667 | 28 | $396,393 | 0 | $0 | 2 | $320,000 |
| APPLICATIONS DENIED | 0 | $0 | 7 | $504,857 | 47 | $477,723 | 0 | $0 | 5 | $341,000 |
| APPLICATIONS WITHDRAWN | 0 | $0 | 4 | $670,000 | 36 | $409,528 | 4 | $268,000 | 3 | $363,667 |
| FILES CLOSED FOR INCOMPLETENESS | 0 | $0 | 1 | $568,000 | 11 | $422,091 | 0 | $0 | 2 | $317,500 |
Detailed HMDA statistics for the following Tracts: 3910.00 , 3920.00
| Private Mortgage Insurance Companies Aggregated Statistics For Year 2009 (Based on 1 full tract) | ||
| A) Conventional Home Purchase Loans | ||
|---|---|---|
| Number | Average Value | |
| LOANS ORIGINATED | 0 | $0 |
| APPLICATIONS APPROVED, NOT ACCEPTED | 1 | $544,000 |
| APPLICATIONS DENIED | 0 | $0 |
| APPLICATIONS WITHDRAWN | 0 | $0 |
| FILES CLOSED FOR INCOMPLETENESS | 0 | $0 |
Detailed PMIC statistics for the following Tracts: 3910.00 , 3920.00
2005 - 2018 National Fire Incident Reporting System (NFIRS) incidents
- Fire incident types reported to NFIRS in Kensington, CA
- 6563.7%Structure Fires
- 2221.6%Outside Fires
- 109.8%Other
- 54.9%Mobile Property/Vehicle Fires
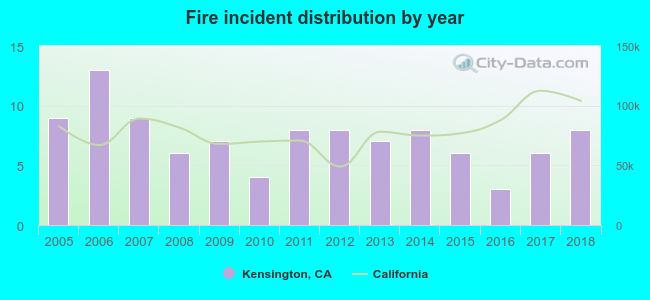 Based on the data from the years 2005 - 2018 the average number of fires per year is 7. The highest number of fires - 13 took place in 2006, and the least - 3 in 2016. The data has a decreasing trend.
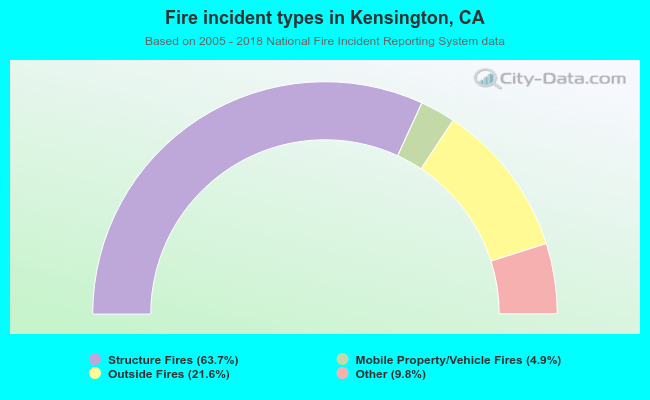 When looking into fire subcategories, the most reports belonged to: Structure Fires (63.7%), and Outside Fires (21.6%).
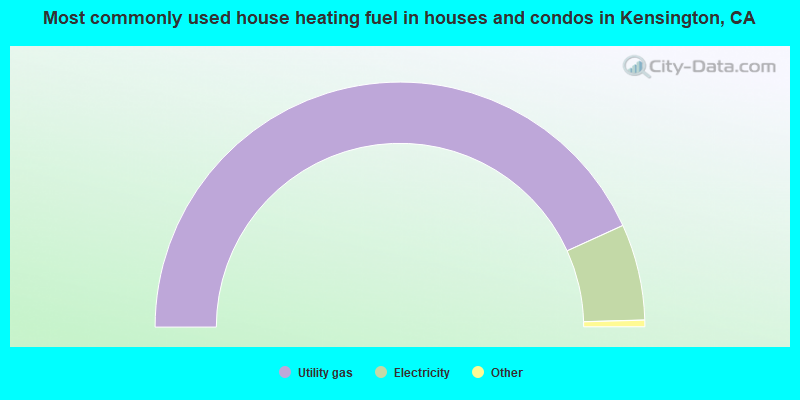
- 86.5%Utility gas
- 12.7%Electricity
- 0.4%No fuel used
- 0.4%Bottled, tank, or LP gas
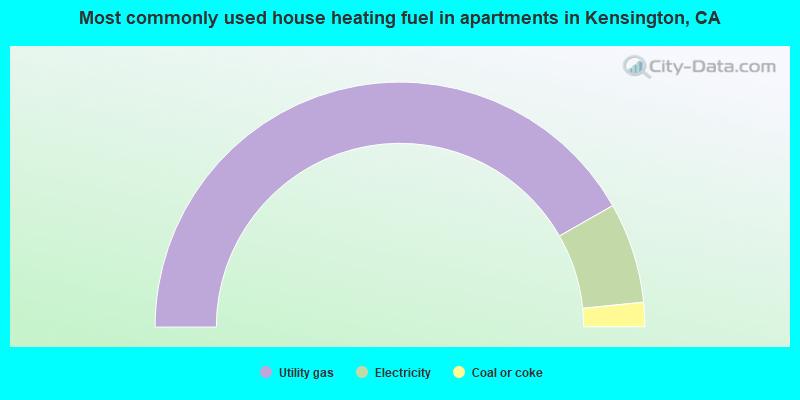
- 83.5%Utility gas
- 13.3%Electricity
- 3.2%Coal or coke
Kensington compared to California state average:
- Median household income above state average.
- Median house value above state average.
- Unemployed percentage significantly below state average.
- Black race population percentage below state average.
- Hispanic race population percentage significantly below state average.
- Median age significantly above state average.
- Foreign-born population percentage below state average.
- Renting percentage significantly below state average.
- Length of stay since moving in significantly above state average.
- Number of rooms per house above state average.
- House age significantly above state average.
- Percentage of population with a bachelor's degree or higher significantly above state average.
Kensington on our top lists:
- #8 on the list of "Top 101 cities with largest percentage of females in occupations: arts, design, entertainment, sports, and media occupations (population 5,000+)"
- #13 on the list of "Top 101 cities with the most people taking subway or elevated to work (population 5,000+)"
- #22 on the list of "Top 101 cities with the least people driving a car to work alone (population 5,000+)"
- #23 on the list of "Top 101 cities with the most people having Master's or Doctorate degrees (population 5,000+)"
- #30 on the list of "Top 100 best educated cities (highest percentage of bachelor degree holding residents) (pop. 5,000+)"
- #49 on the list of "Top 101 cities with the largest percentage of likely homosexual households (counted as self-reported same-sex unmarried-partner households) (population 5,000+)"
- #51 on the list of "Top 101 cities with the most people having Doctorate degrees (population 500+)"
- #54 on the list of "Top 101 cities with largest percentage of females in industries: professional, scientific, and technical services (population 5,000+)"
- #55 on the list of "Top 101 cities with the largest percentage of likely gay men couples (counted as self-reported male-male unmarried-partner households) (population 5,000+)"
- #58 on the list of "Top 101 cities with largest percentage of males in occupations: life, physical, and social science occupations (population 5,000+)"
- #63 on the list of "Top 101 cities with the most residents born in Other Northern Europe (population 500+)"
- #72 on the list of "Top 101 cities with largest percentage of females in occupations: life, physical, and social science occupations (population 5,000+)"
- #76 on the list of "Top 101 cities with largest percentage of males in industries: professional, scientific, and technical services (population 5,000+)"
- #76 on the list of "Top 101 cities with the most residents born in Western Europe (population 500+)"
- #80 on the list of "Top 101 cities with the largest percentage of likely lesbian couples (counted as self-reported female-female unmarried-partner households) (population 5,000+)"
- #81 on the list of "Top 101 cities with the most residents born in Netherlands (population 500+)"
- #86 on the list of "Top 101 cities with the most residents born in Germany (population 500+)"
- #93 on the list of "Top 101 cities with the lowest number of assaults per 100,000 residents (population 5,000+)"
- #97 on the list of "Top 101 cities with the most residents born in Iraq (population 500+)"
- #24 (94708) on the list of "Top 101 zip codes with the largest percentage of taxpayers reporting profit/loss from business in 2012 (pop 5,000+)"
- #77 (94708) on the list of "Top 101 zip codes with the largest percentage of taxpayers reporting taxable interest in 2012 (pop 5,000+)"
- #95 (94708) on the list of "Top 101 zip codes with the largest percentage of taxpayers reporting net capital gain/loss in 2012 (pop 5,000+)"
- #10 on the list of "Top 101 counties with the largest increase in the number of infant deaths per 1000 residents 2000-2006 to 2007-2013 (pop. 50,000+)"
- #15 on the list of "Top 101 counties with the lowest Sulfur Oxides Annual air pollution readings in 2012 (µg/m3)"
- #17 on the list of "Top 101 counties with the highest Nitrogen Dioxide air pollution readings in 2012 (ppm)"
- #31 on the list of "Top 101 counties with the highest percentage of residents that drank alcohol in the past 30 days"
- #34 on the list of "Top 101 counties with the highest surface withdrawal of fresh water for public supply (pop. 50,000+)"

|
|
Total of 529 patent applications in 2008-2024.