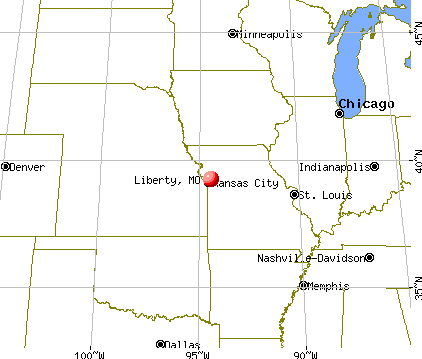
Liberty, Missouri
Liberty: Ice in Days Inn Parking Lot - December 2007
Liberty: I-35 in Liberty
Liberty: Double Rainbows Over Liberty MO

Liberty: The country side of Liberty
Liberty: December 2007 Snow
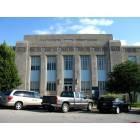
Liberty: Clay County Courthouse
- add
your
Submit your own pictures of this city and show them to the world
- OSM Map
- General Map
- Google Map
- MSN Map
Population change since 2000: +17.3%
 |
| Males: 15,360 | |
| Females: 15,415 |
| Median resident age: | 37.8 years |
| Missouri median age: | 39.1 years |
Zip codes: 64068.
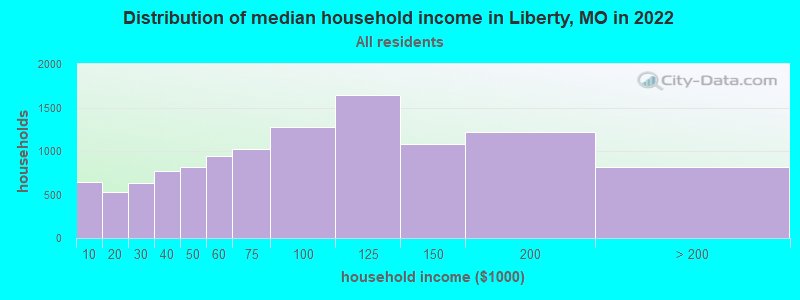
| Liberty: | $86,337 |
| MO: | $64,811 |
Estimated per capita income in 2022: $38,357 (it was $23,415 in 2000)
Liberty city income, earnings, and wages data
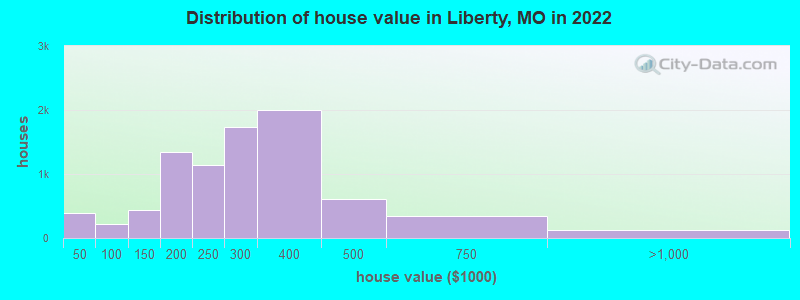
Estimated median house or condo value in 2022: $278,574 (it was $118,800 in 2000)
| Liberty: | $278,574 |
| MO: | $221,200 |
Mean prices in 2022: all housing units: $291,407; detached houses: $296,280; townhouses or other attached units: $204,427; in 2-unit structures: $281,004; in 3-to-4-unit structures: $176,364; in 5-or-more-unit structures: $217,987; mobile homes: $76,781
Median gross rent in 2022: $1,016.
(7.2% for White Non-Hispanic residents, 14.7% for Black residents, 7.7% for Hispanic or Latino residents, 43.4% for American Indian residents, 66.7% for Native Hawaiian and other Pacific Islander residents, 14.6% for other race residents, 7.3% for two or more races residents)
Detailed information about poverty and poor residents in Liberty, MO


Compare current foreclosures in Liberty, MO:
| Photo | Address | Area | Beds / Baths | Price | Details |
|---|---|---|---|---|---|

|
#1
Walker Ct
Liberty, MO 64068
|
1,216 sq. feet
|
2 baths 3 beds |
show details | |

|
#2
Avondale St
Liberty, MO 64068
|
884 sq. feet
|
2 baths 3 beds |
show details | |

|
#3
Northwyck Dr
Liberty, MO 64068
|
1,258 sq. feet
|
2 baths 3 beds |
show details | |

|
#4
Current Pl
Liberty, MO 64068
|
1,348 sq. feet
|
2 baths 3 beds |
show details | |

|
#5
Maple Woods Dr
Liberty, MO 64068
|
1,768 sq. feet
|
2 baths 3 beds |
show details | |

|
#6
Camelot Dr
Liberty, MO 64068
|
1,322 sq. feet
|
3 baths 4 beds |
show details | |

|
#7
Ted Ct
Liberty, MO 64068
|
1,878 sq. feet
|
2 baths 3 beds |
show details | |

|
#8
Holt Dr
Liberty, MO 64068
|
1,348 sq. feet
|
2 baths 3 beds |
show details | |

|
#9
Richfield Ct
Liberty, MO 64068
|
1,046 sq. feet
|
3 baths 3 beds |
show details | |

|
#10
Maple St
Liberty, MO 64068
|
900 sq. feet
|
2 baths 2 beds |
show details |
| Photo | Address | Area | Beds / Baths | Price | Details |
|---|---|---|---|---|---|

|
#11
Ridgeway Dr
Liberty, MO 64068
|
972 sq. feet
|
3 baths 4 beds |
show details | |

|
#12
Oxford Ct
Liberty, MO 64068
|
1,358 sq. feet
|
2 baths 3 beds |
show details | |

|
#13
Willis Dr
Liberty, MO 64068
|
1,460 sq. feet
|
2 baths 3 beds |
show details | |

|
#14
N Lightburne St
Liberty, MO 64068
|
1,578 sq. feet
|
1 baths 4 beds |
show details | |

|
#15
N Jefferson Ave
Liberty, MO 64068
|
1,240 sq. feet
|
1 baths 3 beds |
show details | |

|
#16
Cypress St
Liberty, MO 64068
|
1,600 sq. feet
|
2 baths 3 beds |
show details | |

|
#17
S Leonard St
Liberty, MO 64068
|
1,267 sq. feet
|
2 baths 3 beds |
show details | |

|
#18
Larkspur Dr
Liberty, MO 64068
|
1,213 sq. feet
|
2 baths 4 beds |
show details | |

|
#19
Amesbury Ave
Liberty, MO 64068
|
1,460 sq. feet
|
3 baths 3 beds |
show details | |

|
#20
Dexter St
Liberty, MO 64068
|
1,112 sq. feet
|
3 baths 4 beds |
show details |
| Photo | Address | Area | Beds / Baths | Price | Details |
|---|---|---|---|---|---|

|
#21
S Jewell St
Liberty, MO 64068
|
2,002 sq. feet
|
1 baths 3 beds |
show details | |

|
#22
W Franklin St
Liberty, MO 64068
|
1,046 sq. feet
|
2 baths 3 beds |
show details | |

|
#23
Sherman Dr
Liberty, MO 64068
|
1,539 sq. feet
|
2 baths 3 beds |
show details | |

|
#24
Sherman Dr
Liberty, MO 64068
|
1,665 sq. feet
|
3 baths 3 beds |
show details | |

|
#25
Dover Ct
Liberty, MO 64068
|
1,554 sq. feet
|
2 baths 3 beds |
show details | |

|
#26
N Grover St
Liberty, MO 64068
|
728 sq. feet
|
1 baths 2 beds |
show details | |

|
#27
S Forrest Ave
Liberty, MO 64068
|
1,526 sq. feet
|
3 baths 3 beds |
show details | |

|
#28
Campbell Dr
Liberty, MO 64068
|
1,182 sq. feet
|
- baths 3 beds |
show details | |

|
#29
N Mohican Dr
Liberty, MO 64068
|
- sq. feet
|
- baths - beds |
show details | |

|
#30
Harrison Ave Apt 2n
Liberty, MO 64068
|
- sq. feet
|
- baths - beds |
show details |
| Photo | Address | Area | Beds / Baths | Price | Details |
|---|---|---|---|---|---|

|
#31
Catalpa St
Liberty, MO 64068
|
- sq. feet
|
- baths - beds |
show details | |

|
#32
Crescent Dr
Liberty, MO 64068
|
- sq. feet
|
- baths - beds |
show details | |

|
#33
Spring Ave
Liberty, MO 64068
|
- sq. feet
|
- baths - beds |
show details | |

|
#34
Sherrill Ave
Liberty, MO 64068
|
- sq. feet
|
- baths - beds |
show details | |

|
#35
La Chateau Dr
Liberty, MO 64068
|
- sq. feet
|
- baths - beds |
show details | |

|
#36
Southview Dr, Trlr 6
Liberty, MO 64068
|
- sq. feet
|
- baths - beds |
show details | |

|
#37
Missouri Ct Apt 228
Liberty, MO 64068
|
- sq. feet
|
- baths - beds |
show details | |

|
#38
Northpoint Ave
Liberty, MO 64068
|
- sq. feet
|
- baths - beds |
show details | |

|
#39
NE Us Highway 69, Trlr 38
Liberty, MO 64068
|
- sq. feet
|
- baths - beds |
show details | |

|
#40
S Lincoln St
Liberty, MO 64068
|
- sq. feet
|
- baths - beds |
show details |
| Photo | Address | Area | Beds / Baths | Price | Details |
|---|---|---|---|---|---|

|
#41
Missouri Ct Apt 516
Liberty, MO 64068
|
- sq. feet
|
- baths - beds |
show details | |

|
#42
Loughrey St
Liberty, MO 64068
|
- sq. feet
|
- baths - beds |
show details | |

|
#43
Fulton Rd Apt D
Liberty, MO 64068
|
- sq. feet
|
- baths - beds |
show details | |

|
#44
Glendale Rd
Liberty, MO 64068
|
- sq. feet
|
- baths - beds |
show details | |

|
#45
Dains Ct
Liberty, MO 64068
|
- sq. feet
|
- baths - beds |
show details | |

|
#46
Spring Ave
Liberty, MO 64068
|
- sq. feet
|
- baths - beds |
show details | |

|
#47
Kingbird Ct
Liberty, MO 64068
|
- sq. feet
|
- baths - beds |
show details | |

|
#48
NE Us Highway 69, Trlr 9
Liberty, MO 64068
|
- sq. feet
|
- baths - beds |
show details | |

|
#49
Missouri Ct Apt 419
Liberty, MO 64068
|
- sq. feet
|
- baths - beds |
show details | |

|
Check over 1 million property listings on Foreclosure.com!
|
browse all offers | |||


- 25,43982.7%White alone
- 1,8506.0%Hispanic
- 1,4704.8%Black alone
- 1,1113.6%Two or more races
- 4971.6%Asian alone
- 1150.4%Other race alone
- 710.2%American Indian alone
- 460.1%Native Hawaiian and Other
Pacific Islander alone
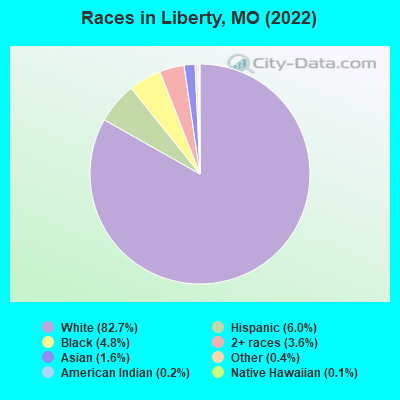
Races in Liberty detailed stats: ancestries, foreign born residents, place of birth
According to our research of Missouri and other state lists, there were 42 registered sex offenders living in Liberty, Missouri as of April 19, 2024.
The ratio of all residents to sex offenders in Liberty is 738 to 1.
The ratio of registered sex offenders to all residents in this city is lower than the state average.
Type |
2009 |
2010 |
2011 |
2012 |
2013 |
2014 |
2015 |
2016 |
2017 |
2018 |
2019 |
2020 |
2022 |
|---|---|---|---|---|---|---|---|---|---|---|---|---|---|
| Murders (per 100,000) | 0 (0.0) | 2 (6.9) | 0 (0.0) | 0 (0.0) | 1 (3.3) | 0 (0.0) | 2 (6.5) | 0 (0.0) | 0 (0.0) | 0 (0.0) | 1 (3.1) | 0 (0.0) | 0 (0.0) |
| Rapes (per 100,000) | 6 (19.3) | 9 (30.9) | 1 (3.4) | 9 (30.4) | 8 (26.7) | 7 (23.1) | 11 (35.9) | 20 (65.1) | 13 (42.1) | 6 (18.8) | 8 (24.9) | 2 (6.2) | 11 (36.1) |
| Robberies (per 100,000) | 3 (9.7) | 9 (30.9) | 13 (44.4) | 7 (23.6) | 10 (33.3) | 5 (16.5) | 10 (32.6) | 8 (26.1) | 11 (35.7) | 6 (18.8) | 7 (21.8) | 7 (21.6) | 0 (0.0) |
| Assaults (per 100,000) | 29 (93.3) | 21 (72.0) | 42 (143.6) | 41 (138.5) | 39 (130.0) | 52 (171.5) | 41 (133.7) | 55 (179.2) | 48 (155.6) | 81 (254.4) | 43 (133.9) | 69 (212.8) | 11 (36.1) |
| Burglaries (per 100,000) | 87 (280.0) | 102 (349.9) | 95 (324.7) | 113 (381.6) | 106 (353.3) | 113 (372.7) | 155 (505.4) | 74 (241.1) | 61 (197.7) | 69 (216.7) | 61 (190.0) | 36 (111.0) | 37 (121.4) |
| Thefts (per 100,000) | 413 (1,329) | 420 (1,441) | 345 (1,179) | 400 (1,351) | 400 (1,333) | 379 (1,250) | 398 (1,298) | 328 (1,068) | 408 (1,323) | 383 (1,203) | 375 (1,168) | 306 (943.7) | 207 (679.4) |
| Auto thefts (per 100,000) | 42 (135.2) | 45 (154.4) | 36 (123.1) | 76 (256.6) | 31 (103.3) | 58 (191.3) | 43 (140.2) | 58 (188.9) | 74 (239.9) | 59 (185.3) | 61 (190.0) | 77 (237.5) | 51 (167.4) |
| Arson (per 100,000) | 7 (22.5) | 9 (30.9) | 5 (17.1) | 9 (30.4) | 6 (20.0) | 9 (29.7) | 2 (6.5) | 2 (6.5) | 2 (6.5) | 1 (3.1) | 2 (6.2) | 2 (6.2) | 1 (3.3) |
| City-Data.com crime index | 120.6 | 156.6 | 124.5 | 160.4 | 150.3 | 149.1 | 176.8 | 170.5 | 161.5 | 149.7 | 134.7 | 118.5 | 85.2 |
The City-Data.com crime index weighs serious crimes and violent crimes more heavily. Higher means more crime, U.S. average is 246.1. It adjusts for the number of visitors and daily workers commuting into cities.
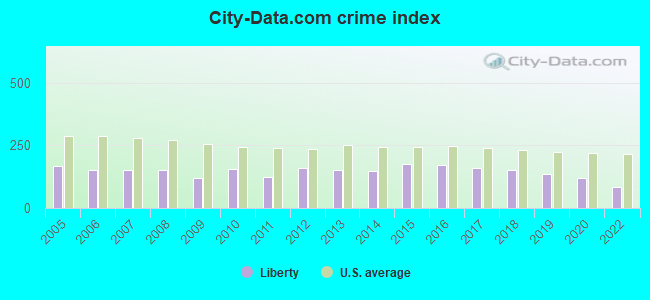
Crime rate in Liberty detailed stats: murders, rapes, robberies, assaults, burglaries, thefts, arson
Full-time law enforcement employees in 2019, including police officers: 56 (39 officers - 35 male; 4 female).
| Officers per 1,000 residents here: | 1.21 |
| Missouri average: | 2.48 |
 Recent articles from our blog. Our writers, many of them Ph.D. graduates or candidates, create easy-to-read articles on a wide variety of topics.

 | National WW1/Liberty Musuem (8 replies) |
| KCMO vs Liberty taxes (1 reply) |
| Older Homes in Liberty, MO (6 replies) |
| I want to relocate to either GrandView,Lees Summit,or Liberty (2 replies) |
| Liberty Missouri schools and living compared to OP (7 replies) |
| Kansas City MO vs Liberty taxes and the earnings tax (0 replies) |
Latest news from Liberty, MO collected exclusively by city-data.com from local newspapers, TV, and radio stations
Ancestries: German (18.4%), English (12.8%), American (12.2%), Irish (7.9%), European (5.0%), Swedish (3.1%).
Current Local Time: CST time zone
Incorporated in 1861
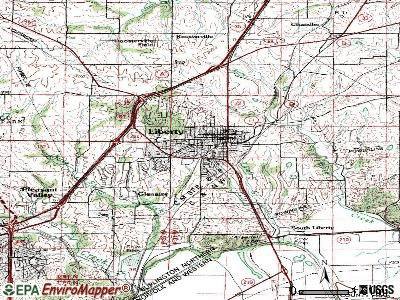
Elevation: 889 feet
Land area: 27.0 square miles.
Population density: 1,142 people per square mile (low).
778 residents are foreign born (0.7% Europe, 0.7% Latin America, 0.7% Asia).
| This city: | 2.5% |
| Missouri: | 4.2% |
Median real estate property taxes paid for housing units with mortgages in 2022: $2,986 (1.0%)
Median real estate property taxes paid for housing units with no mortgage in 2022: $2,618 (1.0%)
Nearest city with pop. 50,000+: Independence, MO  (11.2 miles , pop. 113,288).
Nearest city with pop. 200,000+: Kansas City, MO (13.3 miles , pop. 441,545).
Nearest city with pop. 1,000,000+: Chicago, IL (397.5 miles , pop. 2,896,016).
Nearest cities:
), ), ), ), )Latitude: 39.24 N, Longitude: 94.43 W
Daytime population change due to commuting: +8,392 (+27.3%)
Workers who live and work in this city: 6,211 (41.2%)
Area code: 816
Liberty, Missouri accommodation & food services, waste management - Economy and Business Data
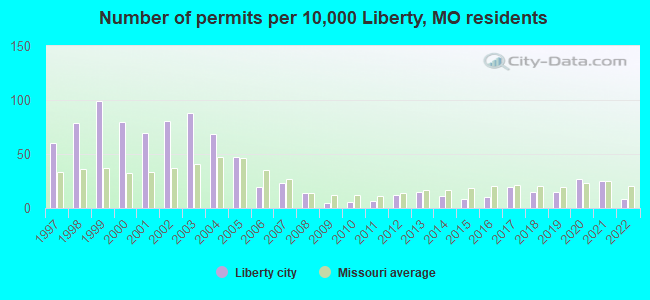
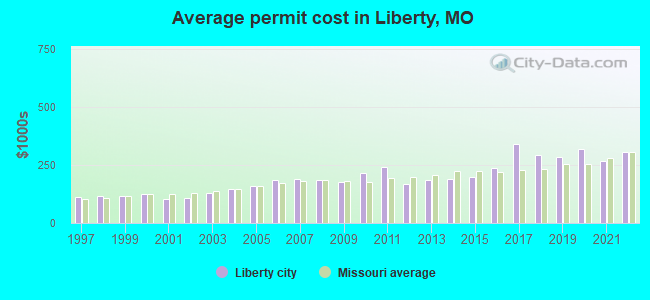
Single-family new house construction building permits:
- 2022: 21 buildings, average cost: $307,900
- 2021: 66 buildings, average cost: $268,700
- 2020: 71 buildings, average cost: $318,300
- 2019: 40 buildings, average cost: $285,200
- 2018: 39 buildings, average cost: $294,300
- 2017: 51 buildings, average cost: $340,800
- 2016: 27 buildings, average cost: $237,300
- 2015: 22 buildings, average cost: $200,100
- 2014: 30 buildings, average cost: $191,400
- 2013: 39 buildings, average cost: $187,200
- 2012: 31 buildings, average cost: $168,100
- 2011: 17 buildings, average cost: $241,900
- 2010: 14 buildings, average cost: $215,800
- 2009: 11 buildings, average cost: $178,700
- 2008: 36 buildings, average cost: $186,100
- 2007: 61 buildings, average cost: $189,600
- 2006: 50 buildings, average cost: $186,900
- 2005: 125 buildings, average cost: $160,800
- 2004: 180 buildings, average cost: $146,400
- 2003: 231 buildings, average cost: $127,900
- 2002: 211 buildings, average cost: $110,200
- 2001: 181 buildings, average cost: $102,800
- 2000: 208 buildings, average cost: $127,300
- 1999: 261 buildings, average cost: $117,300
- 1998: 207 buildings, average cost: $114,900
- 1997: 157 buildings, average cost: $112,600
| Here: | 2.8% |
| Missouri: | 2.8% |
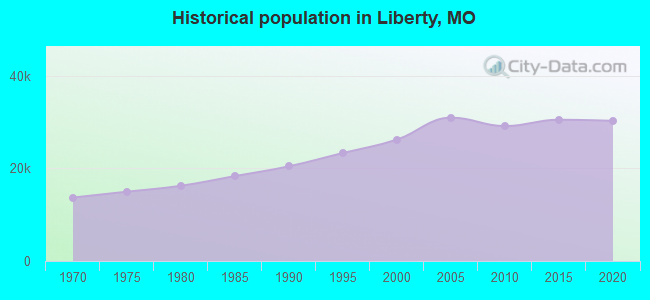
Population change in the 1990s: +5,515 (+26.6%).
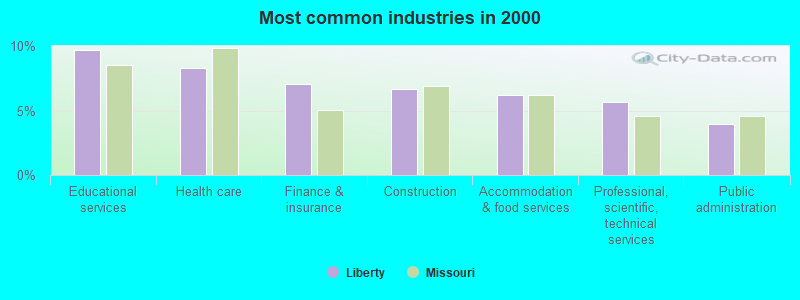
- Educational services (9.7%)
- Health care (8.3%)
- Finance & insurance (7.0%)
- Construction (6.7%)
- Accommodation & food services (6.2%)
- Professional, scientific, technical services (5.7%)
- Public administration (4.0%)
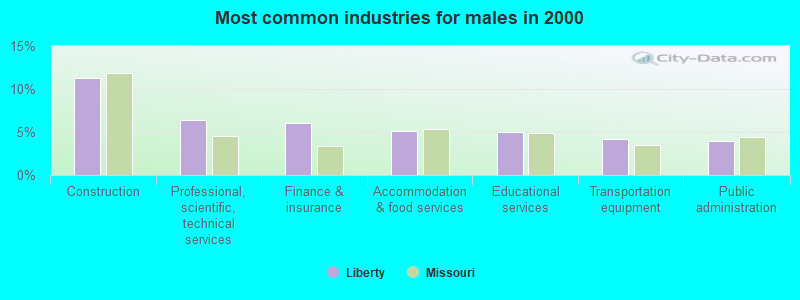
- Construction (11.3%)
- Professional, scientific, technical services (6.4%)
- Finance & insurance (6.1%)
- Accommodation & food services (5.1%)
- Educational services (5.0%)
- Transportation equipment (4.2%)
- Public administration (3.9%)
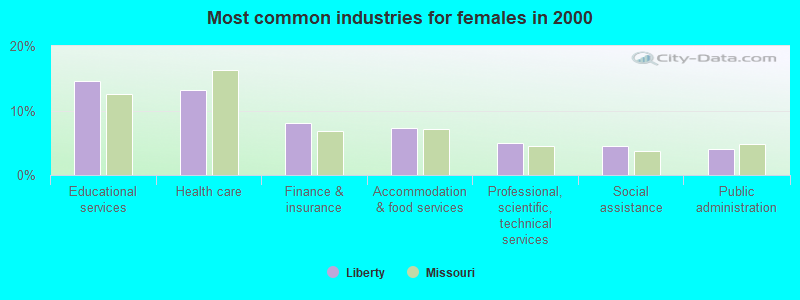
- Educational services (14.6%)
- Health care (13.2%)
- Finance & insurance (8.0%)
- Accommodation & food services (7.3%)
- Professional, scientific, technical services (4.9%)
- Social assistance (4.5%)
- Public administration (4.0%)
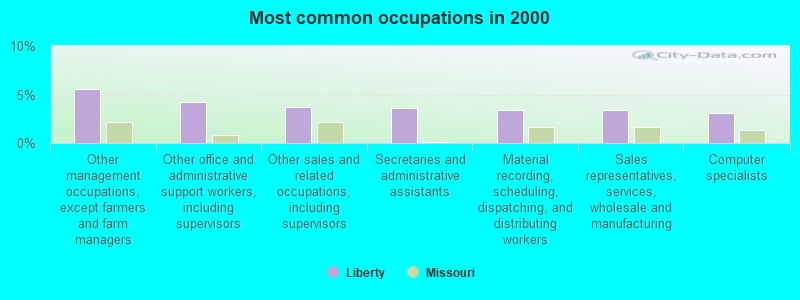
- Other management occupations, except farmers and farm managers (5.6%)
- Other office and administrative support workers, including supervisors (4.2%)
- Other sales and related occupations, including supervisors (3.7%)
- Secretaries and administrative assistants (3.6%)
- Material recording, scheduling, dispatching, and distributing workers (3.4%)
- Sales representatives, services, wholesale and manufacturing (3.4%)
- Computer specialists (3.0%)
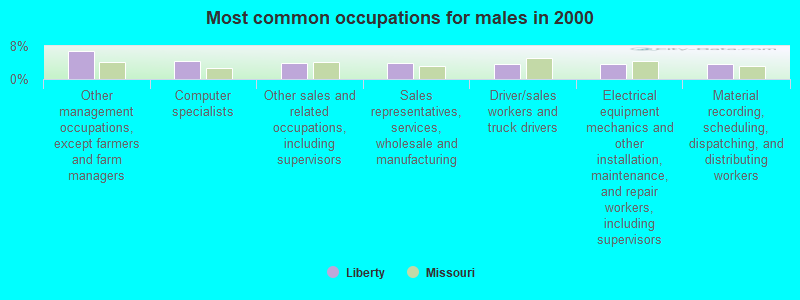
- Other management occupations, except farmers and farm managers (6.8%)
- Computer specialists (4.3%)
- Other sales and related occupations, including supervisors (4.0%)
- Sales representatives, services, wholesale and manufacturing (3.8%)
- Driver/sales workers and truck drivers (3.8%)
- Electrical equipment mechanics and other installation, maintenance, and repair workers, including supervisors (3.7%)
- Material recording, scheduling, dispatching, and distributing workers (3.6%)
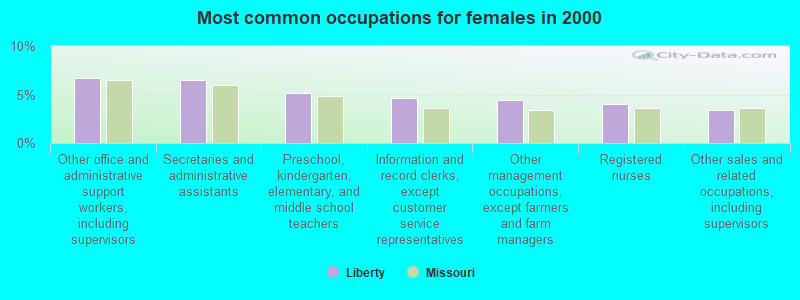
- Other office and administrative support workers, including supervisors (6.7%)
- Secretaries and administrative assistants (6.4%)
- Preschool, kindergarten, elementary, and middle school teachers (5.1%)
- Information and record clerks, except customer service representatives (4.6%)
- Other management occupations, except farmers and farm managers (4.4%)
- Registered nurses (4.0%)
- Other sales and related occupations, including supervisors (3.4%)
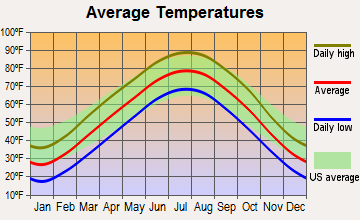
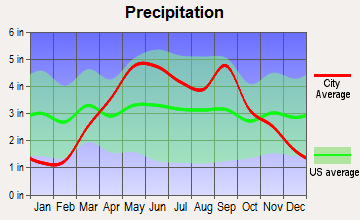
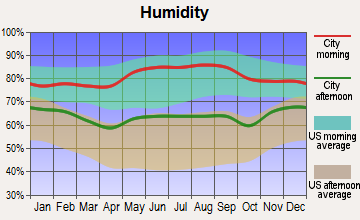
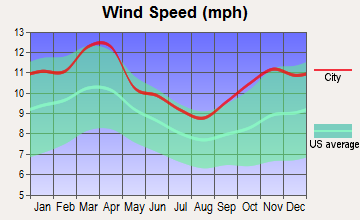
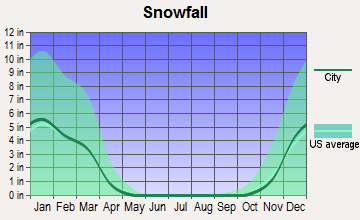
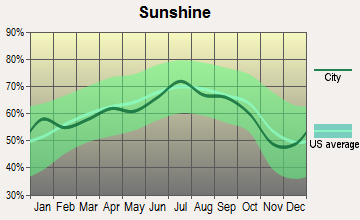
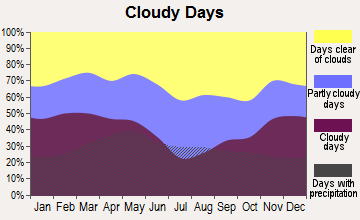
Average climate in Liberty, Missouri
Based on data reported by over 4,000 weather stations
|
|


(lower is better)
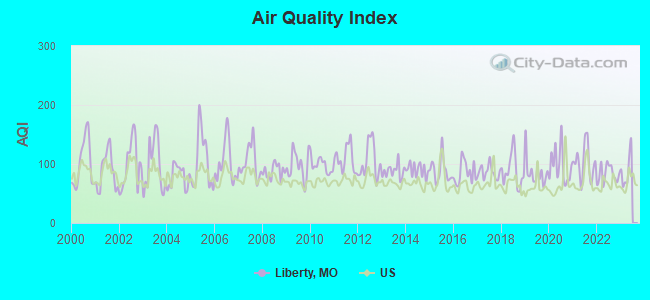
Air Quality Index (AQI) level in 2022 was 82.8. This is about average.
| City: | 82.8 |
| U.S.: | 72.6 |
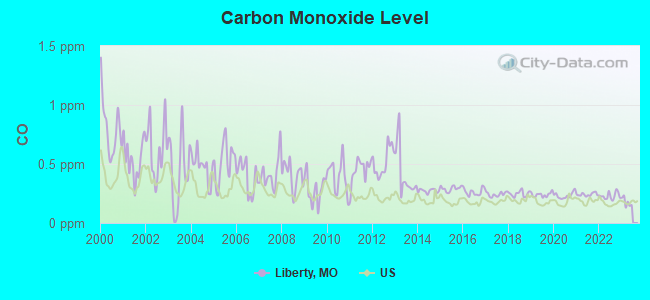
Carbon Monoxide (CO) [ppm] level in 2022 was 0.229. This is about average. Closest monitor was 8.4 miles away from the city center.
| City: | 0.229 |
| U.S.: | 0.251 |
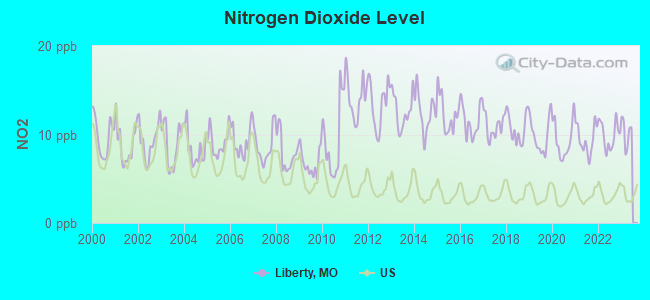
Nitrogen Dioxide (NO2) [ppb] level in 2022 was 9.94. This is significantly worse than average. Closest monitor was 5.1 miles away from the city center.
| City: | 9.94 |
| U.S.: | 5.11 |
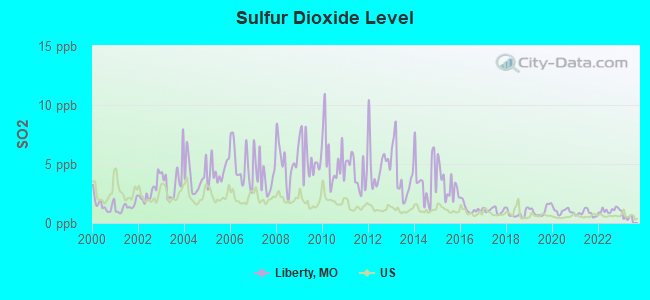
Sulfur Dioxide (SO2) [ppb] level in 2022 was 1.07. This is significantly better than average. Closest monitor was 5.5 miles away from the city center.
| City: | 1.07 |
| U.S.: | 1.51 |
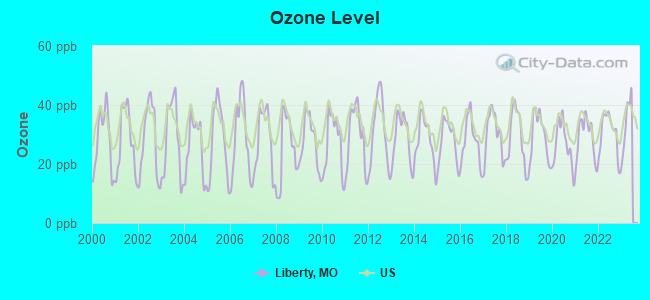
Ozone [ppb] level in 2022 was 30.3. This is about average. Closest monitor was 3.6 miles away from the city center.
| City: | 30.3 |
| U.S.: | 33.3 |
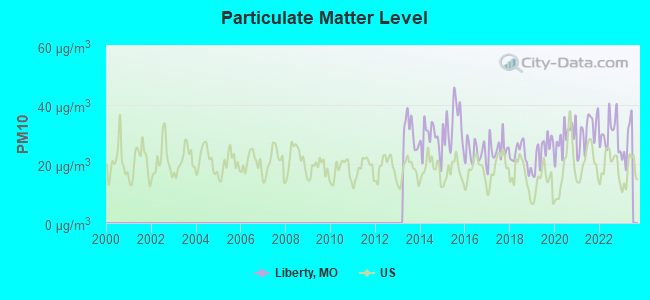
Particulate Matter (PM10) [µg/m3] level in 2022 was 30.3. This is significantly worse than average. Closest monitor was 9.2 miles away from the city center.
| City: | 30.3 |
| U.S.: | 19.2 |
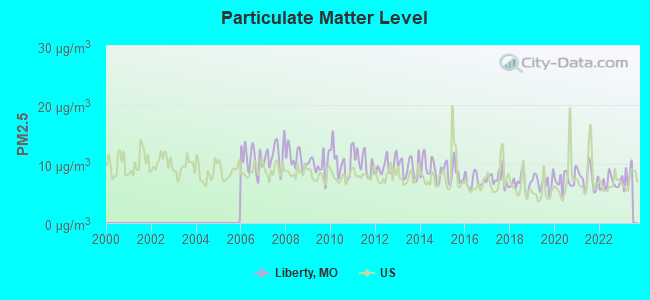
Particulate Matter (PM2.5) [µg/m3] level in 2022 was 6.73. This is better than average. Closest monitor was 5.1 miles away from the city center.
| City: | 6.73 |
| U.S.: | 8.11 |
Tornado activity:
Liberty-area historical tornado activity is slightly above Missouri state average. It is 97% greater than the overall U.S. average.
On 5/20/1957, a category F5 (max. wind speeds 261-318 mph) tornado 18.1 miles away from the Liberty city center killed 44 people and injured 207 people and caused between $500,000 and $5,000,000 in damages.
On 5/4/2003, a category F4 (max. wind speeds 207-260 mph) tornado 2.4 miles away from the city center injured 13 people and caused $31 million in damages.
Earthquake activity:
Liberty-area historical earthquake activity is significantly above Missouri state average. It is 476% greater than the overall U.S. average.On 9/3/2016 at 12:02:44, a magnitude 5.8 (5.8 MW, Depth: 3.5 mi, Class: Moderate, Intensity: VI - VII) earthquake occurred 237.9 miles away from the city center
On 11/6/2011 at 03:53:10, a magnitude 5.7 (5.7 MW, Depth: 3.2 mi) earthquake occurred 286.9 miles away from Liberty center
On 11/12/2014 at 21:40:00, a magnitude 4.9 (4.9 MW, Depth: 2.5 mi, Class: Light, Intensity: IV - V) earthquake occurred 220.6 miles away from Liberty center
On 11/7/2016 at 01:44:24, a magnitude 5.0 (5.0 MW, Depth: 2.8 mi) earthquake occurred 259.8 miles away from the city center
On 2/13/2016 at 17:07:06, a magnitude 5.1 (5.1 MW, Depth: 5.2 mi) earthquake occurred 301.4 miles away from the city center
On 4/18/2008 at 09:36:59, a magnitude 5.4 (5.1 MB, 4.8 MS, 5.4 MW, 5.2 MW) earthquake occurred 356.5 miles away from the city center
Magnitude types: body-wave magnitude (MB), surface-wave magnitude (MS), moment magnitude (MW)
Natural disasters:
The number of natural disasters in Clay County (24) is greater than the US average (15).Major Disasters (Presidential) Declared: 16
Emergencies Declared: 6
Causes of natural disasters: Floods: 17, Storms: 14, Tornadoes: 7, Winter Storms: 3, Drought: 1, Heavy Rain: 1, Hurricane: 1, Ice Storm: 1, Wind: 1, Other: 1 (Note: some incidents may be assigned to more than one category).
Main business address for: FERRELLGAS PARTNERS L P (RETAIL-MISCELLANEOUS RETAIL), FERRELLGAS FINANCE CORP (RETAIL-MISCELLANEOUS RETAIL), FERRELLGAS PARTNERS FINANCE CORP (RETAIL-MISCELLANEOUS RETAIL).
Hospitals and medical centers in Liberty:
- LIBERTY HOSPITAL (Government - Hospital District or Authority, provides emergency services, 2525 GLENN HENDREN DR)
- LIBERTY HOSPITAL HOSPICE (1134 WEST KANSAS)
- REGIONAL HOSPICE II (16 WESTWOODS DRIVE)
- ASHTON COURT CARE AND REHABILITATION CENTRE (1200 WEST COLLEGE STREET)
- LIBERTY TERRACE HEALTHCARE AND REHABILITATION CTR (2201 GLENN HENDREN DR)
- PLEASANT VALLEY MANOR CARE CENTER (6814 SOBBIE ROAD)
- LIBERTY DIALYSIS (2525 GLENN HENDREN DR.)
- LIBERTY HOSPITAL HOME HEALTH (2525 GLENN HENDREN)
Airports and heliports located in Liberty:
- Liberty Landing Airport (4MO4) (Runways: 1, Air Taxi Ops: 100, Itinerant Ops: 2,500, Local Ops: 4,500)
- Roosterville Airport (0N0) (Runways: 1, Itinerant Ops: 500, Local Ops: 3,000)
- Liberty Hospital Heliport (8MO2)
Amtrak stations near Liberty:
- 11 miles: INDEPENDENCE (600 S. GRAND AVE.) . Services: free short-term parking, call for taxi service.
- 14 miles: KANSAS CITY (2200 MAIN ST.) . Services: ticket office, fully wheelchair accessible, enclosed waiting area, public restrooms, public payphones, snack bar, free short-term parking, paid long-term parking, call for car rental service, taxi stand, public transit connection.
College/University in Liberty:
Colleges/universities with over 2000 students nearest to Liberty:
- Grantham University (about 13 miles; Kansas City, MO; Full-time enrollment: 8,385)
- Park University (about 14 miles; Parkville, MO; FT enrollment: 9,131)
- Metropolitan Community College-Kansas City (about 15 miles; Kansas City, MO; FT enrollment: 12,834)
- University of Missouri-Kansas City (about 17 miles; Kansas City, MO; FT enrollment: 10,544)
- Rockhurst University (about 17 miles; Kansas City, MO; FT enrollment: 2,013)
- Kansas City Kansas Community College (about 20 miles; Kansas City, KS; FT enrollment: 4,718)
- Wright Career College (about 25 miles; Overland Park, KS; FT enrollment: 3,107)
Public high schools in Liberty:
- LIBERTY HIGH (Students: 1,928, Location: 200 BLUEJAY DR, Grades: 9-12)
- LIBERTY NORTH HIGH SCHOOL (Students: 770, Location: 1000 N.E. 104TH STREET, Grades: 9-12)
- JUVENILE JUSTICE CTR. (Students: 1, Location: 650 CONISTOR LN, Grades: 6-12)
- LIBERTY ACADEMY (Location: 8 VICTORY LN, Grades: 9-12)
Biggest public elementary/middle schools in Liberty:
- LILLIAN SCHUMACHER ELEM. (Students: 614, Location: 425 CLAYWOODS PKWY, Grades: KG-5)
- LEWIS AND CLARK ELEM. (Students: 595, Location: 1407 NASHUA RD, Grades: KG-5)
- SOUTH VALLEY MIDDLE (Students: 562, Location: 1000 MIDJAY DR, Grades: 6-8)
- WARREN HILLS ELEM. (Students: 522, Location: 1251 CAMILLE ST, Grades: KG-5)
- RIDGEVIEW ELEM. (Students: 446, Location: 701 THORNTON, Grades: KG-5)
- MANOR HILL ELEM. (Students: 431, Location: 1400 SKYLINE DR, Grades: KG-5)
- ALEXANDER DONIPHAN ELEM. (Students: 424, Location: 1900 CLAY DR, Grades: KG-5)
- EPIC ELEMENTARY (Students: 338, Location: 650 CONISTOR LANE, Grades: KG-5)
- FRANKLIN ELEM. (Students: 274, Location: 201 W MILL, Grades: KG-5)
- DISCOVERY MIDDLE SCHOOL (Location: 800 MIDJAY DRIVE, Grades: 6-8)
Private elementary/middle school in Liberty:
User-submitted facts and corrections:
- Liberty United Methodist Church is located at 1001 Sunset
Points of interest:
Notable locations in Liberty: Clayview Country Club (A), Claycrest Golf Course (B), Bement (C), Liberty Commons (D), Crossroads West (E), Brown Hall (F), Browing Hall (G), Pryor Leadership Development Center (H), Pillsbury Music Center (I), Yates-Gill College Union (J), Liberty Fire Department Station 2 (K), White Science Center (L), Spratt Sports Complex (M), Melrose Hall (N), Marston Hall (O), Jones Hall (P), Jewell Hall (Q), Mabee Center (R), Semple Hall (S), Hester Alumni Hall (T). Display/hide their locations on the map
Shopping Center: Liberty Landing Shopping Center (1). Display/hide its location on the map
Main business address in Liberty include: FERRELLGAS PARTNERS L P (A), FERRELLGAS FINANCE CORP (B), FERRELLGAS PARTNERS FINANCE CORP (C). Display/hide their locations on the map
Churches in Liberty include: Saint James Roman Catholic Church (A), Grand River Chapel (B), Saint Andrews Church (C), Saint Stephen Church (D), Union Church (E), Calvary Church (F). Display/hide their locations on the map
Cemeteries: Fairview Cemetery (1), New Hope Cemetery (2), Baker Cemetery (3), Glenridge Cemetery (4). Display/hide their locations on the map
Reservoirs: Hendron Lake (A), William L Howard Lake (B), Number 174 Reservoir (C), Number 175 Reservoir (D), Number 176 Reservoir (E), Holly Lake (F), Dd Fellows Home Lake (G). Display/hide their locations on the map
Streams, rivers, and creeks: Cates Branch (A), Little Shoal Creek (B), Town Branch (C). Display/hide their locations on the map
Parks in Liberty include: Moore Park (1), Barnes Memorial Fountain (2), Greene Stadium (3), Bennett Park (4). Display/hide their locations on the map
Tourist attractions: Clay County Museum & Historical Society (14 North Main Street) (1), Jesse James Bank Museum (103 North Water Street) (2), Shoal Creek Living History Museum (Cultural Attractions- Events- & Facilities; 7000 Northeast Barry Road) (3), Martha Lafite Thompson Nature Sanctuary (Cultural Attractions- Events- & Facilities; 407 North La Frenz Road) (4), Ole Bill's Museum (801 North State Route 291) (5), American Style Ballroom Dance Lessons (Arcades & Amusements; 135 North Missouri Street) (6). Display/hide their approximate locations on the map
Hotels: James Inn Bed & Breakfast & Day Spa (342 North Water Street) (1), Liberty/NE Kansas City Area (115 North Stewart Road) (2), Days Inn Liberty (209 North 291 Highway) (3). Display/hide their approximate locations on the map
Court: Clay County - Family Court (351 East Kansas Street) (1). Display/hide its approximate location on the map
Birthplace of: Craig Stevens (actor) - Actor, Ken Boyer - Baseball player and coach, Art Thomason - Baseball player, Nick Robinson - College basketball player (Stanford Cardinal), Ike Martin - Football player.
Drinking water stations with addresses in Liberty and their reported violations in the past:
CLAY CO PWSD 2 (Population served: 3,182, Purch surface water):Past health violations:CLAY CO PWSD 4 (Population served: 1,516, Purch groundwater):
- MCL, Monthly (TCR) - In OCT-2008, Contaminant: Coliform. Follow-up actions: St Public Notif requested (NOV-03-2008), St Violation/Reminder Notice (NOV-03-2008), St Public Notif received (NOV-03-2008), St Compliance achieved (JAN-22-2014)
Past health violations:CLAY CO PWSD 5 (Population served: 1,020, Purch surface water):Past monitoring violations:
- MCL, Monthly (TCR) - In AUG-2009, Contaminant: Coliform. Follow-up actions: St Public Notif requested (AUG-28-2009), St Violation/Reminder Notice (AUG-28-2009), St Public Notif received (SEP-30-2009), St Compliance achieved (JAN-22-2014)
- One minor monitoring violation
Past monitoring violations:
- 2 routine major monitoring violations
| This city: | 2.6 people |
| Missouri: | 2.5 people |
| This city: | 71.4% |
| Whole state: | 65.3% |
| This city: | 5.6% |
| Whole state: | 6.7% |
Likely homosexual households (counted as self-reported same-sex unmarried-partner households)
- Lesbian couples: 0.4% of all households
- Gay men: 0.2% of all households
People in group quarters in Liberty in 2010:
- 715 people in college/university student housing
- 294 people in local jails and other municipal confinement facilities
- 277 people in nursing facilities/skilled-nursing facilities
- 46 people in residential treatment centers for adults
- 12 people in group homes intended for adults
- 10 people in correctional facilities intended for juveniles
- 4 people in group homes for juveniles (non-correctional)
People in group quarters in Liberty in 2000:
- 632 people in college dormitories (includes college quarters off campus)
- 233 people in nursing homes
- 178 people in local jails and other confinement facilities (including police lockups)
- 91 people in religious group quarters
- 79 people in other noninstitutional group quarters
- 24 people in homes for the mentally retarded
- 17 people in unknown juvenile institutions
- 16 people in homes for the mentally ill
- 8 people in homes or halfway houses for drug/alcohol abuse
- 2 people in hospitals/wards and hospices for chronically ill
- 2 people in other hospitals or wards for chronically ill
Banks with most branches in Liberty (2011 data):
- Bank Midwest, National Association: Liberty Branch # 12 at 950 Sutton Place, branch established on 1996/08/26; Liberty North Branch #28 at 1580 N Church Road, branch established on 2001/01/12. Info updated 2012/03/19: Bank assets: $6,237.6 mil, Deposits: $5,064.6 mil, headquarters in Kansas City, MO, positive income, 138 total offices, Holding Company: Nbh Holdings Corp.
- U.S. Bank National Association: South 291 Hwy Price Chopper at 896 South 291 Hwy, branch established on 2011/02/28; Liberty at 1909 West Kansas Street, branch established on 2009/12/07. Info updated 2012/01/30: Bank assets: $330,470.8 mil, Deposits: $236,091.5 mil, headquarters in Cincinnati, OH, positive income, 3121 total offices, Holding Company: U.S. Bancorp
- Clay County Savings Bank: at 1178 West Kansas Street, branch established on 1922/01/01; 134 North Water Street Branch at 134 North Water Street, branch established on 2000/08/07. Info updated 2011/07/21: Bank assets: $97.3 mil, Deposits: $83.2 mil, local headquarters, negative income in the last year, Commercial Lending Specialization, 5 total offices
- Bank of America, National Association: Liberty Plaza Branch at 110 South Stewart Road, branch established on 1973/05/14. Info updated 2009/11/18: Bank assets: $1,451,969.3 mil, Deposits: $1,077,176.8 mil, headquarters in Charlotte, NC, positive income, 5782 total offices, Holding Company: Bank Of America Corporation
- PATRIOTS BANK: Patriots Bank at 913 West Liberty Drive, branch established on 2003/11/05. Info updated 2011/06/13: Bank assets: $85.1 mil, Deposits: $76.5 mil, local headquarters, negative income in the last year, Commercial Lending Specialization, 4 total offices, Holding Company: Liberty First Bancshares, Inc.
- KCB Bank: Liberty Branch at 930 West Liberty Drive, branch established on 2006/11/15. Info updated 2006/10/19: Bank assets: $172.5 mil, Deposits: $144.9 mil, headquarters in Kearney, MO, positive income, Commercial Lending Specialization, 5 total offices, Holding Company: Bancshares Of Missouri, Inc.
- Farmers Bank & Trust, National Association: Liberty Branch at 1175 West Kansas Avenue, branch established on 2001/05/04. Info updated 2011/07/22: Bank assets: $648.9 mil, Deposits: $454.2 mil, headquarters in Great Bend, KS, positive income, Agricultural Specialization, 9 total offices, Holding Company: Farmers Enterprises, Inc.
- BMO Harris Bank National Association: Liberty Branch at 105 North Stewart Court Suite 100, branch established on 2005/02/09. Info updated 2011/07/14: Bank assets: $97,264.0 mil, Deposits: $75,624.6 mil, headquarters in Chicago, IL, positive income, 717 total offices, Holding Company: Bank Of Montreal
- Bank of the West: Liberty Branch at 850 South State Route 291, branch established on 1992/11/02. Info updated 2009/11/16: Bank assets: $62,408.3 mil, Deposits: $43,995.2 mil, headquarters in San Francisco, CA, positive income, 647 total offices, Holding Company: Bnp Paribas
- 5 other banks with 5 local branches
For population 15 years and over in Liberty:
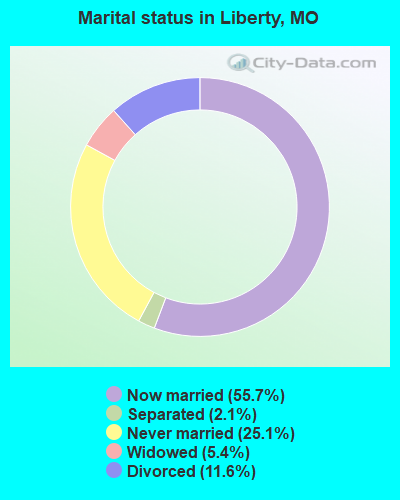
- Never married: 25.1%
- Now married: 55.7%
- Separated: 2.1%
- Widowed: 5.4%
- Divorced: 11.6%
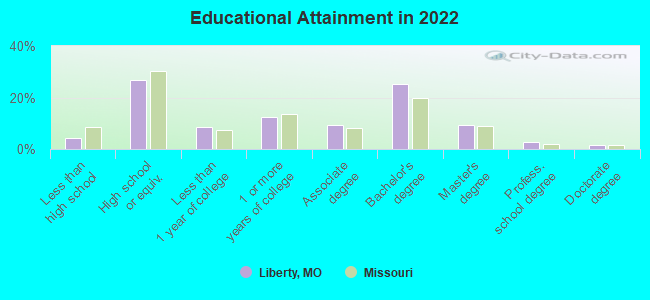
For population 25 years and over in Liberty:
- High school or higher: 95.7%
- Bachelor's degree or higher: 38.3%
- Graduate or professional degree: 12.8%
- Unemployed: 3.5%
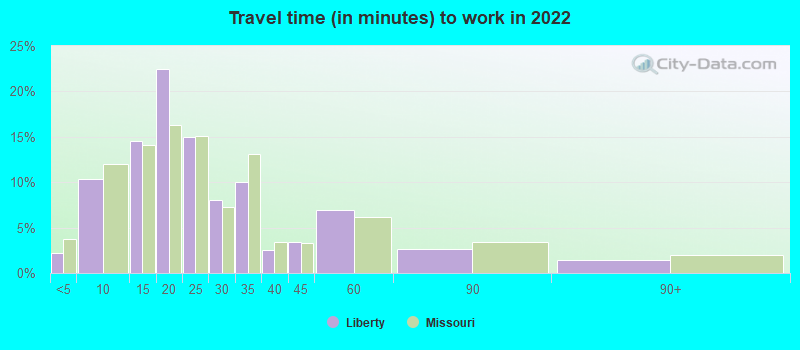
- Mean travel time to work (commute): 18.4 minutes
| Here: | 10.2 |
| Missouri average: | 11.1 |
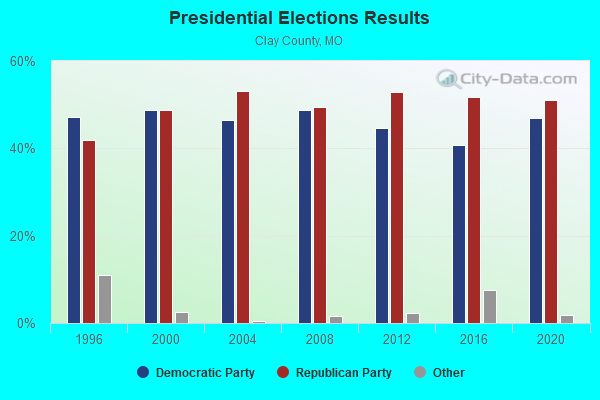
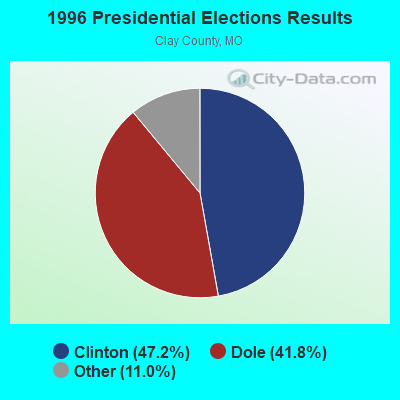
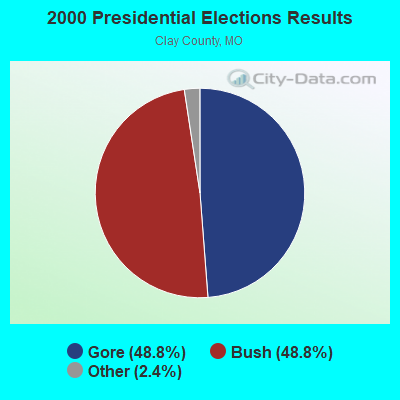
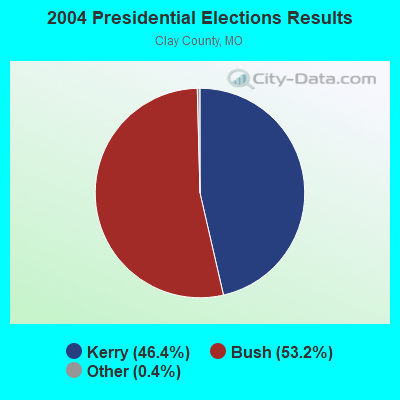
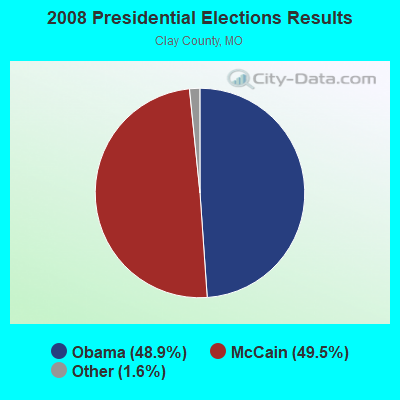
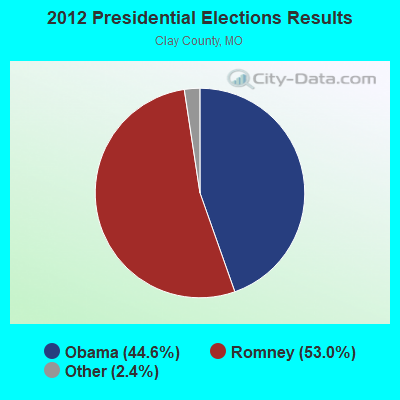
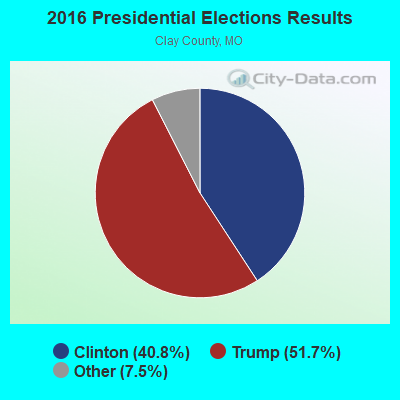
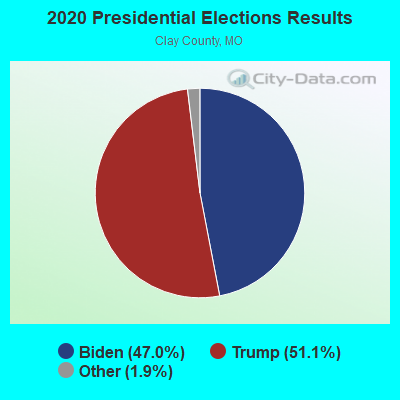
Graphs represent county-level data. Detailed 2008 Election Results
Religion statistics for Liberty, MO (based on Clay County data)
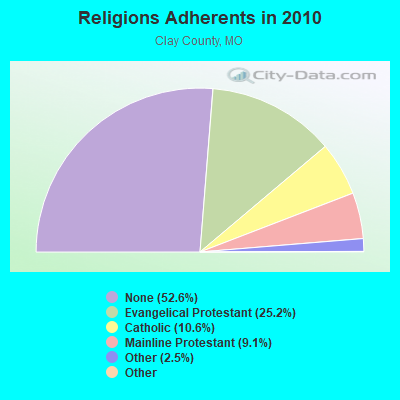
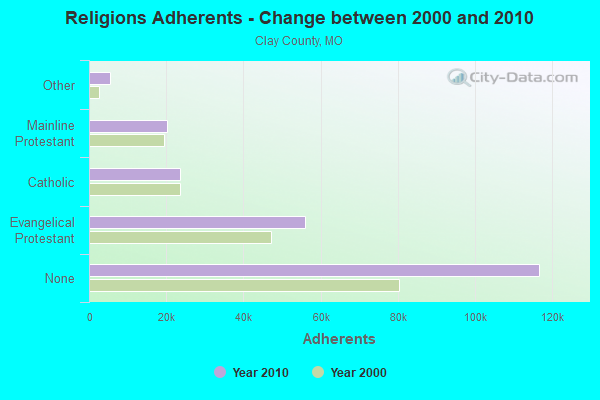
| Religion | Adherents | Congregations |
|---|---|---|
| Evangelical Protestant | 55,953 | 140 |
| Catholic | 23,511 | 9 |
| Mainline Protestant | 20,193 | 41 |
| Other | 5,454 | 23 |
| Black Protestant | 125 | 1 |
| Orthodox | 44 | 1 |
| None | 116,659 | - |
Food Environment Statistics:
| This county: | 1.56 / 10,000 pop. |
| Missouri: | 1.88 / 10,000 pop. |
| Clay County: | 0.14 / 10,000 pop. |
| Missouri: | 0.18 / 10,000 pop. |
| Clay County: | 0.28 / 10,000 pop. |
| Missouri: | 0.60 / 10,000 pop. |
| Clay County: | 3.12 / 10,000 pop. |
| Missouri: | 4.34 / 10,000 pop. |
| This county: | 6.38 / 10,000 pop. |
| Missouri: | 7.37 / 10,000 pop. |
| This county: | 7.9% |
| State: | 8.8% |
| This county: | 30.5% |
| Missouri: | 29.6% |
| Clay County: | 12.2% |
| Missouri: | 13.5% |
Health and Nutrition:
| This city: | 49.4% |
| State: | 50.9% |
| Here: | 46.6% |
| Missouri: | 48.6% |
| This city: | 28.9 |
| Missouri: | 28.7 |
| This city: | 22.7% |
| Missouri: | 20.6% |
| Liberty: | 11.0% |
| Missouri: | 10.1% |
| This city: | 6.8 |
| Missouri: | 6.8 |
| Liberty: | 33.9% |
| Missouri: | 34.3% |
| This city: | 56.8% |
| State: | 57.5% |
| This city: | 78.9% |
| Missouri: | 79.3% |
More about Health and Nutrition of Liberty, MO Residents
| Local government employment and payroll (March 2022) | |||||
| Function | Full-time employees | Monthly full-time payroll | Average yearly full-time wage | Part-time employees | Monthly part-time payroll |
|---|---|---|---|---|---|
| Firefighters | 54 | $374,021 | $83,116 | 0 | $0 |
| Police Protection - Officers | 37 | $282,572 | $91,645 | 0 | $0 |
| Parks and Recreation | 31 | $139,260 | $53,907 | 80 | $45,213 |
| Sewerage | 23 | $105,158 | $54,865 | 0 | $0 |
| Financial Administration | 21 | $125,735 | $71,849 | 1 | $2,400 |
| Other Government Administration | 18 | $126,750 | $84,500 | 9 | $5,717 |
| Water Supply | 14 | $75,842 | $65,007 | 0 | $0 |
| Streets and Highways | 13 | $77,639 | $71,667 | 0 | $0 |
| Police - Other | 11 | $53,612 | $58,486 | 6 | $10,027 |
| Other and Unallocable | 10 | $55,681 | $66,817 | 1 | $1,408 |
| Housing and Community Development (Local) | 3 | $11,970 | $47,880 | 0 | $0 |
| Judicial and Legal | 2 | $8,665 | $51,990 | 2 | $3,250 |
| Welfare | 1 | $2,719 | $32,628 | 2 | $2,271 |
| Fire - Other | 1 | $4,616 | $55,392 | 0 | $0 |
| Totals for Government | 239 | $1,444,238 | $72,514 | 101 | $70,287 |
Liberty government finances - Expenditure in 2021 (per resident):
- Construction - Sewerage: $15,126,000 ($491.50)
Regular Highways: $1,551,000 ($50.40)
Central Staff Services: $223,000 ($7.25)
Parks and Recreation: $91,000 ($2.96)
- Current Operations - Sewerage: $8,940,000 ($290.50)
Police Protection: $7,935,000 ($257.84)
Local Fire Protection: $5,371,000 ($174.52)
Water Utilities: $5,065,000 ($164.58)
Parks and Recreation: $4,965,000 ($161.33)
Regular Highways: $4,823,000 ($156.72)
Housing and Community Development: $4,721,000 ($153.40)
Central Staff Services: $2,952,000 ($95.92)
Solid Waste Management: $1,790,000 ($58.16)
Financial Administration: $837,000 ($27.20)
General Public Buildings: $367,000 ($11.93)
Protective Inspection and Regulation - Other: $305,000 ($9.91)
Judicial and Legal Services: $272,000 ($8.84)
Health - Other: $236,000 ($7.67)
General - Other: $174,000 ($5.65)
Miscellaneous Commercial Activities - Other: $61,000 ($1.98)
- General - Interest on Debt: $6,000 ($0.19)
- Other Capital Outlay - Local Fire Protection: $628,000 ($20.41)
Housing and Community Development: $481,000 ($15.63)
Water Utilities: $421,000 ($13.68)
- Total Salaries and Wages: $17,999,000 ($584.86)
Liberty government finances - Revenue in 2021 (per resident):
- Charges - Sewerage: $8,961,000 ($291.18)
Parks and Recreation: $2,672,000 ($86.82)
Other: $2,028,000 ($65.90)
Solid Waste Management: $1,747,000 ($56.77)
Miscellaneous Commercial Activities: $48,000 ($1.56)
- Federal Intergovernmental - Other: $371,000 ($12.06)
- Local Intergovernmental - Highways: $596,000 ($19.37)
- Miscellaneous - General Revenue - Other: $828,000 ($26.90)
Fines and Forfeits: $582,000 ($18.91)
Interest Earnings: $78,000 ($2.53)
- Revenue - Water Utilities: $5,085,000 ($165.23)
- State Intergovernmental - Other: $10,000 ($0.32)
- Tax - General Sales and Gross Receipts: $16,573,000 ($538.52)
Property: $7,391,000 ($240.16)
Public Utilities Sales: $4,486,000 ($145.77)
Other Selective Sales: $1,688,000 ($54.85)
Other License: $441,000 ($14.33)
Occupation and Business License - Other: $359,000 ($11.67)
Tobacco Products Sales: $96,000 ($3.12)
Alcoholic Beverage License: $36,000 ($1.17)
Liberty government finances - Cash and Securities in 2021 (per resident):
- Other Funds - Cash and Securities: $62,514,000 ($2031.32)
- Sinking Funds - Cash and Securities: $21,945,000 ($713.08)
8.80% of this county's 2021 resident taxpayers lived in other counties in 2020 ($56,910 average adjusted gross income)
| Here: | 8.80% |
| Missouri average: | 7.67% |
0.02% of residents moved from foreign countries ($156 average AGI)
Clay County: 0.02% Missouri average: 0.02%
Top counties from which taxpayers relocated into this county between 2020 and 2021:
| from Jackson County, MO | |
| from Platte County, MO | |
| from Johnson County, KS |
| Businesses in Liberty, MO | ||||
| Name | Count | Name | Count | |
|---|---|---|---|---|
| Advance Auto Parts | 1 | Long John Silver's | 1 | |
| Arby's | 1 | Lowe's | 1 | |
| Baskin-Robbins | 1 | MasterBrand Cabinets | 5 | |
| Blockbuster | 1 | McDonald's | 1 | |
| CVS | 1 | OfficeMax | 1 | |
| Caribou Coffee | 1 | Olive Garden | 1 | |
| Chevrolet | 1 | Pizza Hut | 1 | |
| Chick-Fil-A | 1 | Popeyes | 1 | |
| Chipotle | 1 | Red Robin | 1 | |
| Cricket Wireless | 1 | SONIC Drive-In | 1 | |
| Curves | 1 | Sears | 1 | |
| Days Inn | 1 | Sleep Inn | 1 | |
| Domino's Pizza | 1 | Starbucks | 1 | |
| Fashion Bug | 1 | Subway | 1 | |
| FedEx | 6 | Super 8 | 1 | |
| Firestone Complete Auto Care | 1 | T-Mobile | 1 | |
| GNC | 1 | Taco Bell | 1 | |
| H&R Block | 1 | True Value | 1 | |
| IHOP | 1 | U-Haul | 2 | |
| Jimmy John's | 1 | UPS | 7 | |
| Kincaid | 1 | Walgreens | 1 | |
| Kmart | 1 | Wendy's | 1 | |
| Lane Furniture | 1 | |||
Strongest AM radio stations in Liberty:
- KKHK (1250 AM; 25 kW; KANSAS CITY, KS)
- WHB (810 AM; 50 kW; KANSAS CITY, MO; Owner: UNION BROADCASTING, INC.)
- KCMO (710 AM; 10 kW; KANSAS CITY, MO; Owner: SUSQUEHANNA KANSAS CITY PARTNERSHIP)
- KCXL (1140 AM; 0 kW; LIBERTY, MO; Owner: ALPINE BROADCASTING CORPORATION)
- KGGN (890 AM; daytime; 1 kW; GLADSTONE, MO; Owner: MORTENSON BROADCASTING COMPANY, INC.)
- KCTE (1510 AM; daytime; 10 kW; INDEPENDENCE, MO; Owner: UNION BROADCASTING, INC.)
- KCCV (760 AM; daytime; 6 kW; OVERLAND PARK, KS; Owner: BOTT BROADCASTING COMPANY)
- KPHN (1190 AM; 5 kW; KANSAS CITY, MO; Owner: ABC, INC.)
- KXTR (1660 AM; 10 kW; KANSAS CITY, KS; Owner: ENTERCOM KANSAS CITY LICENSE, LLC)
- KCSP (610 AM; 5 kW; KANSAS CITY, MO; Owner: ENTERCOM KANSAS CITY LICENSE, LLC)
- KMBZ (980 AM; 5 kW; KANSAS CITY, MO; Owner: ENTERCOM KANSAS CITY LICENSE, LLC)
- KEXS (1090 AM; daytime; 1 kW; EXCELSIOR SPRINGS, MO; Owner: JEFFCO TELEVISION CORP.)
- KCNW (1380 AM; 2 kW; FAIRWAY, KS; Owner: KANSAS CITY RADIO, INC.)
Strongest FM radio stations in Liberty:
- KWJC (91.9 FM; LIBERTY, MO; Owner: WILLIAM JEWELL COLLEGE)
- KSRC (102.1 FM; KANSAS CITY, MO; Owner: INFINITY RADIO OPERATIONS INC.)
- WDAF-FM (106.5 FM; LIBERTY, MO; Owner: ENTERCOM KANSAS CITY LICENSE, LLC)
- KUDL (98.1 FM; KANSAS CITY, KS; Owner: ENTERCOM KANSAS CITY LICENSE, LLC)
- KBEQ-FM (104.3 FM; KANSAS CITY, MO; Owner: INFINITY RADIO SUBSIDIARY OPERATIONS INC.)
- KCUR-FM (89.3 FM; KANSAS CITY, MO; Owner: CURATORS OF UNIVERSITY OF MISSOURI)
- KZPL (97.3 FM; LEE'S SUMMIT, MO; Owner: UNION FIRST BROADCASTING, LLC)
- KCMO-FM (94.9 FM; KANSAS CITY, MO; Owner: SUSQUEHANNA KANSAS CITY PARTNERSHIP)
- KQRC-FM (98.9 FM; LEAVENWORTH, KS; Owner: ENTERCOM KANSAS CITY LICENSE, LLC)
- KRBZ (96.5 FM; KANSAS CITY, MO; Owner: ENTERCOM KANSAS CITY LICENSE, LLC)
- KYYS (99.7 FM; KANSAS CITY, MO; Owner: ENTERCOM KANSAS CITY LICENSE, LLC)
- KLJC (88.5 FM; KANSAS CITY, MO; Owner: CALVARY BIBLE COLLEGE)
- KMXV (93.3 FM; KANSAS CITY, MO; Owner: INFINITY RADIO OPERATIONS INC.)
- KFKF-FM (94.1 FM; KANSAS CITY, KS; Owner: INFINITY RADIO SUBSIDIARY OPERATIONS INC.)
- KPRS (103.3 FM; KANSAS CITY, MO; Owner: CARTER BROADCAST GROUP, INC.)
- KKFI (90.1 FM; KANSAS CITY, MO; Owner: MID-COAST RADIO PROJECT, INC.)
- KMJK (107.3 FM; LEXINGTON, MO; Owner: ALLUR-KANSAS CITY, INC.)
- KCFX (101.1 FM; HARRISONVILLE, MO; Owner: SUSQUEHANNA KANSAS CITY PARTNERSHIP)
- KAYX (92.5 FM; RICHMOND, MO; Owner: BOTT COMMUNICATIONS, INC.)
- KCCV-FM (92.3 FM; OLATHE, KS; Owner: BOTT BROADCASTING COMPANY)
TV broadcast stations around Liberty:
- KMBC-TV (Channel 9; KANSAS CITY, MO; Owner: KMBC HEARST-ARGYLE TELEVISION, INC.)
- KCPT (Channel 19; KANSAS CITY, MO; Owner: PUBLIC TELEVISION 19, INC.)
- KSMO-TV (Channel 62; KANSAS CITY, MO; Owner: KSMO LICENSEE, INC.)
- KCWE (Channel 29; KANSAS CITY, MO; Owner: KCWE-TV, INC.)
- KCTV (Channel 5; KANSAS CITY, MO; Owner: MEREDITH CORPORATION)
- K48FS (Channel 48; KANSAS CITY, MO; Owner: WORD OF GOD FELLOWSHIP, INC.)
- KSHB-TV (Channel 41; KANSAS CITY, MO; Owner: SCRIPPS HOWARD BROADCASTING COMPANY)
- KPXE (Channel 50; KANSAS CITY, MO; Owner: PAXSON KANSAS CITY LICENSE, INC.)
- WDAF-TV (Channel 4; KANSAS CITY, MO; Owner: WDAF LICENSE, INC.)
- KMCI (Channel 38; LAWRENCE, KS; Owner: SCRIPPS HOWARD BROADCASTING COMPANY)
- K35CT (Channel 35; KANSAS CITY, MO; Owner: WORD OF GOD FELLOWSHIP, INC.)
- K26CR (Channel 26; KANSAS CITY, MO; Owner: VENTANA TELEVISION, INC.)
- KTAJ (Channel 16; ST. JOSEPH, MO; Owner: TRINITY BROADCASTING NETWORK)
- National Bridge Inventory (NBI) Statistics
- 47Number of bridges
- 702ft / 214mTotal length
- $2,143,000Total costs
- 533,702Total average daily traffic
- 65,549Total average daily truck traffic
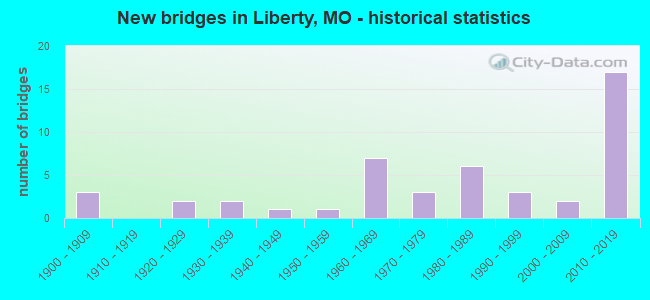
- New bridges - historical statistics
- 31900-1909
- 21920-1929
- 21930-1939
- 11940-1949
- 11950-1959
- 71960-1969
- 31970-1979
- 61980-1989
- 31990-1999
- 22000-2009
- 172010-2019
FCC Registered Antenna Towers: 124 (See the full list of FCC Registered Antenna Towers)
FCC Registered Commercial Land Mobile Towers: 2 (See the full list of FCC Registered Commercial Land Mobile Towers in Liberty, MO)
FCC Registered Private Land Mobile Towers: 2 (See the full list of FCC Registered Private Land Mobile Towers)
FCC Registered Broadcast Land Mobile Towers: 23 (See the full list of FCC Registered Broadcast Land Mobile Towers)
FCC Registered Microwave Towers: 25 (See the full list of FCC Registered Microwave Towers in this town)
FCC Registered Paging Towers: 6 (See the full list of FCC Registered Paging Towers)
FCC Registered Maritime Coast & Aviation Ground Towers: 1 (See the full list of FCC Registered Maritime Coast & Aviation Ground Towers)
FCC Registered Amateur Radio Licenses: 215 (See the full list of FCC Registered Amateur Radio Licenses in Liberty)
FAA Registered Aircraft Manufacturers and Dealers: 1 (See the full list of FAA Registered Manufacturers and Dealers in Liberty)
FAA Registered Aircraft: 41 (See the full list of FAA Registered Aircraft)
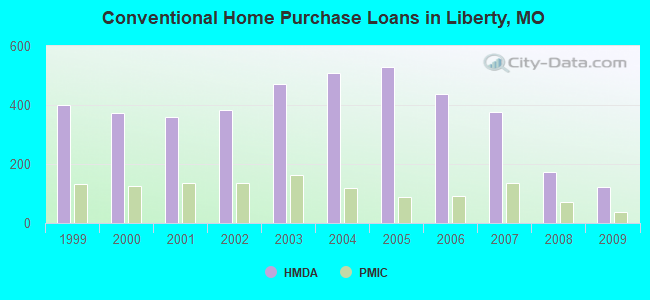
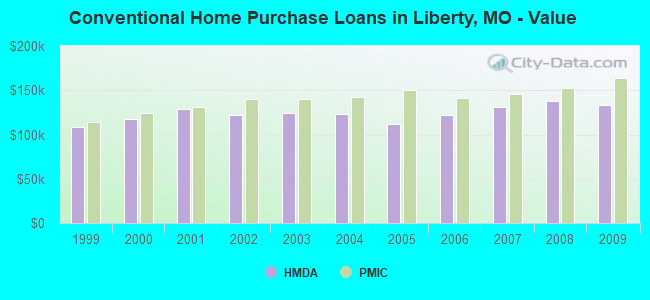
| Home Mortgage Disclosure Act Aggregated Statistics For Year 2009 (Based on 2 full and 3 partial tracts) | ||||||||||||
| A) FHA, FSA/RHS & VA Home Purchase Loans | B) Conventional Home Purchase Loans | C) Refinancings | D) Home Improvement Loans | F) Non-occupant Loans on < 5 Family Dwellings (A B C & D) | G) Loans On Manufactured Home Dwelling (A B C & D) | |||||||
|---|---|---|---|---|---|---|---|---|---|---|---|---|
| Number | Average Value | Number | Average Value | Number | Average Value | Number | Average Value | Number | Average Value | Number | Average Value | |
| LOANS ORIGINATED | 139 | $136,603 | 123 | $132,875 | 568 | $155,644 | 24 | $53,834 | 41 | $86,436 | 3 | $65,090 |
| APPLICATIONS APPROVED, NOT ACCEPTED | 9 | $130,149 | 16 | $111,622 | 53 | $146,376 | 4 | $7,740 | 6 | $68,095 | 1 | $60,710 |
| APPLICATIONS DENIED | 13 | $132,504 | 16 | $154,792 | 163 | $168,447 | 20 | $40,804 | 7 | $165,760 | 1 | $20,590 |
| APPLICATIONS WITHDRAWN | 15 | $140,597 | 8 | $151,024 | 120 | $151,455 | 5 | $54,628 | 3 | $64,017 | 0 | $0 |
| FILES CLOSED FOR INCOMPLETENESS | 2 | $114,870 | 1 | $136,810 | 24 | $170,857 | 0 | $0 | 0 | $0 | 0 | $0 |
Detailed HMDA statistics for the following Tracts: 0208.01 , 0208.02, 0214.01, 0214.02, 0216.00
| Private Mortgage Insurance Companies Aggregated Statistics For Year 2009 (Based on 2 full and 3 partial tracts) | ||||||
| A) Conventional Home Purchase Loans | B) Refinancings | C) Non-occupant Loans on < 5 Family Dwellings (A & B) | ||||
|---|---|---|---|---|---|---|
| Number | Average Value | Number | Average Value | Number | Average Value | |
| LOANS ORIGINATED | 37 | $163,828 | 37 | $175,955 | 0 | $0 |
| APPLICATIONS APPROVED, NOT ACCEPTED | 3 | $201,027 | 6 | $163,722 | 0 | $0 |
| APPLICATIONS DENIED | 4 | $287,548 | 5 | $179,948 | 0 | $0 |
| APPLICATIONS WITHDRAWN | 2 | $99,095 | 4 | $161,935 | 0 | $0 |
| FILES CLOSED FOR INCOMPLETENESS | 1 | $72,640 | 0 | $0 | 1 | $72,640 |
Detailed PMIC statistics for the following Tracts: 0208.01 , 0208.02, 0214.01, 0214.02, 0216.00
2002 - 2018 National Fire Incident Reporting System (NFIRS) incidents
- Fire incident types reported to NFIRS in Liberty, MO
- 50838.8%Outside Fires
- 44834.3%Structure Fires
- 19915.2%Mobile Property/Vehicle Fires
- 15311.7%Other
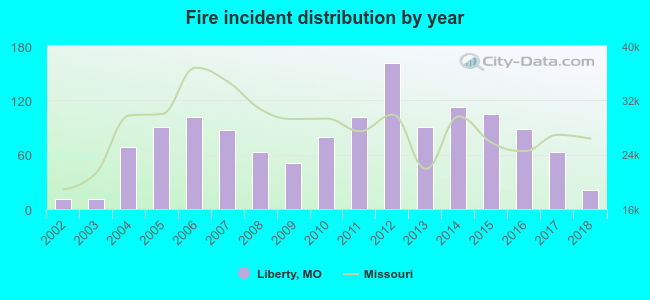 According to the data from the years 2002 - 2018 the average number of fire incidents per year is 77. The highest number of fires - 161 took place in 2012, and the least - 11 in 2002. The data has an increasing trend.
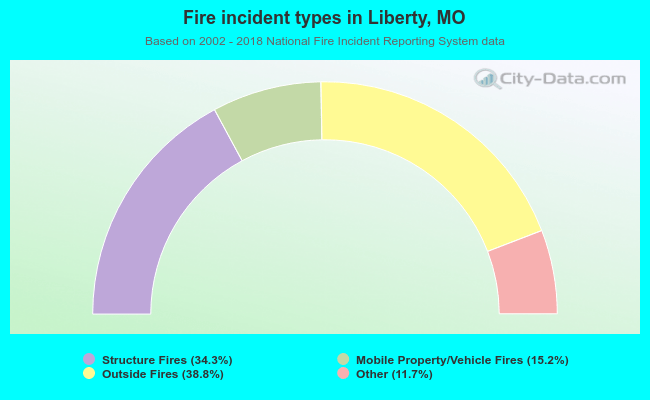 When looking into fire subcategories, the most incidents belonged to: Outside Fires (38.8%), and Structure Fires (34.3%).
Fire-safe hotels and motels in Liberty, Missouri:
- Sleep Inn & Suites And Indoor Water Park, 1840 N Church Rd, Liberty, Missouri 64068 , Phone: (816) 335-4402, Fax: (816) 407-1264
- Value Place, 1911 Industrial Dr, Liberty, Missouri 64068 , Phone: (816) 415-3330, Fax: (816) 415-3331
- TownePlace Suites Kansas City/Liberty, 130 S Stewart Rd, Liberty, Missouri 64068 , Phone: (816) 415-9200, Fax: (816) 415-9202
| Most common first names in Liberty, MO among deceased individuals | ||
| Name | Count | Lived (average) |
|---|---|---|
| Mary | 176 | 80.3 years |
| John | 141 | 74.5 years |
| William | 122 | 74.3 years |
| James | 120 | 73.8 years |
| Robert | 106 | 71.3 years |
| Charles | 98 | 74.7 years |
| Helen | 85 | 81.8 years |
| George | 77 | 76.0 years |
| Dorothy | 70 | 77.2 years |
| Margaret | 61 | 83.3 years |
| Most common last names in Liberty, MO among deceased individuals | ||
| Last name | Count | Lived (average) |
|---|---|---|
| Smith | 70 | 79.1 years |
| Williams | 42 | 74.6 years |
| Thomas | 41 | 75.9 years |
| Miller | 37 | 77.9 years |
| Johnson | 34 | 76.2 years |
| Jones | 32 | 76.9 years |
| Wilson | 31 | 78.3 years |
| Moore | 30 | 80.1 years |
| Taylor | 29 | 79.6 years |
| Brown | 27 | 75.5 years |
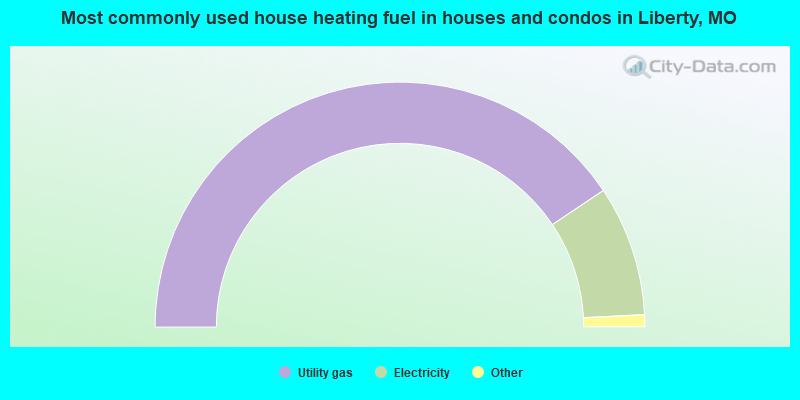
- 81.2%Utility gas
- 17.2%Electricity
- 1.2%Bottled, tank, or LP gas
- 0.2%Wood
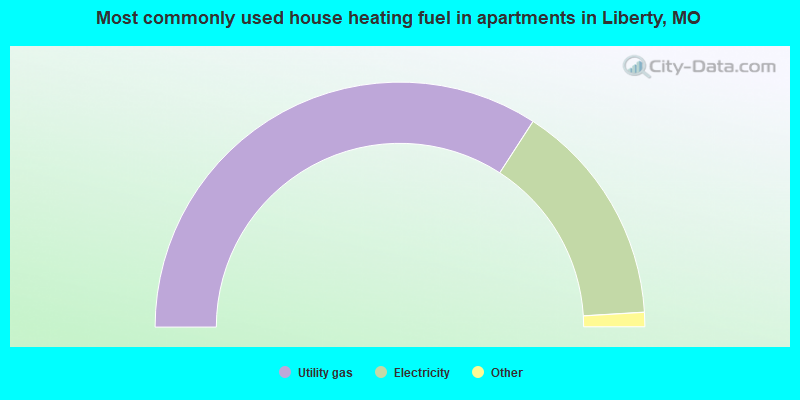
- 68.3%Utility gas
- 29.8%Electricity
- 1.2%Bottled, tank, or LP gas
- 0.4%Wood
- 0.3%No fuel used
Liberty compared to Missouri state average:
- Unemployed percentage significantly below state average.
- Black race population percentage below state average.
- Length of stay since moving in above state average.
- Percentage of population with a bachelor's degree or higher above state average.

|
|
Total of 174 patent applications in 2008-2024.