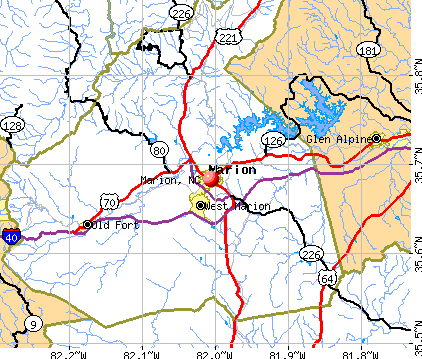
Marion, North Carolina
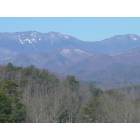
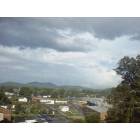
Marion: View of the mountains
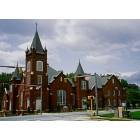
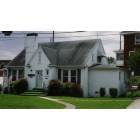
Marion: Marion Historic District

Marion: I-40 eastbound approaching Marion, NC
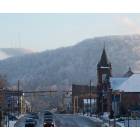
Marion: Main Street Marion, NC heading North
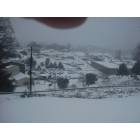
Marion: VIEW OF MARION FROM THE WEST-WINTER
Marion: Main Street Marion, NC heading North

Marion: Mountain sunrise approaching Marion, NC, Interstate 40 eastbound
Marion: VIEW OF MARION FROM THE WEST
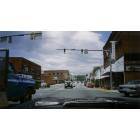
Marion: Main Street Marion, NC heading North
- add
your
Submit your own pictures of this city and show them to the world
- OSM Map
- General Map
- Google Map
- MSN Map
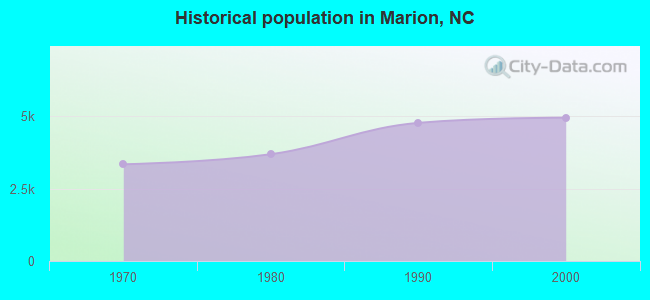
Population change since 2000: +51.6%
| Males: 4,139 | |
| Females: 3,353 |
| Median resident age: | 39.5 years |
| North Carolina median age: | 39.2 years |
| Marion: | $49,469 |
| NC: | $67,481 |
Estimated per capita income in 2022: $21,703 (it was $16,569 in 2000)
Marion city income, earnings, and wages data
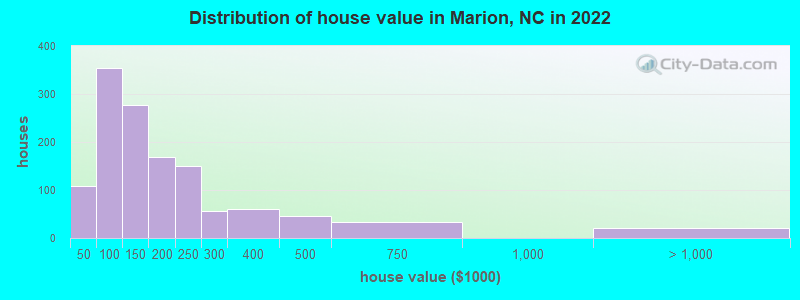
Estimated median house or condo value in 2022: $145,974 (it was $59,400 in 2000)
| Marion: | $145,974 |
| NC: | $280,600 |
Median gross rent in 2022: $631.
(16.4% for White Non-Hispanic residents, 19.9% for Black residents, 43.1% for Hispanic or Latino residents, 7.5% for American Indian residents, 30.7% for other race residents, 71.9% for two or more races residents)
Detailed information about poverty and poor residents in Marion, NC

Compare current foreclosures near Marion, NC:
| Photo | Address | Area | Beds / Baths | Price | Details |
|---|---|---|---|---|---|

|
#1
Ward Dr
Marion, NC 28752
|
1,066 sq. feet
|
1 baths 2 beds |
show details | |

|
#2
Bethel Church Rd
Marion, NC 28752
|
- sq. feet
|
2 baths 3 beds |
show details | |

|
#3
3rd St
Marion, NC 28752
|
- sq. feet
|
2 baths 3 beds |
show details | |

|
#4
Pineview St Apt 2
Marion, NC 28752
|
- sq. feet
|
- baths - beds |
show details | |

|
#5
Shady Ln
Marion, NC 28752
|
- sq. feet
|
- baths - beds |
show details | |

|
#6
Old Fort Sugar Hill Rd
Marion, NC 28752
|
- sq. feet
|
- baths - beds |
show details | |

|
#7
Mount Pleasant Church Rd
Marion, NC 28752
|
- sq. feet
|
- baths - beds |
show details | |

|
#8
Padgett Dr
Marion, NC 28752
|
- sq. feet
|
- baths - beds |
show details | |

|
#9
Ridgecrest Dr
Marion, NC 28752
|
- sq. feet
|
- baths - beds |
show details | |

|
#10
Calvary Dr
Marion, NC 28752
|
- sq. feet
|
- baths - beds |
show details |
| Photo | Address | Area | Beds / Baths | Price | Details |
|---|---|---|---|---|---|

|
#11
W Seagle St
Marion, NC 28752
|
- sq. feet
|
- baths - beds |
show details | |

|
#12
Smith Hill Rd
Marion, NC 28752
|
- sq. feet
|
- baths - beds |
show details | |

|
#13
Maxwell Dr
Marion, NC 28752
|
- sq. feet
|
- baths - beds |
show details | |

|
#14
Paradise Cir
Marion, NC 28752
|
- sq. feet
|
- baths - beds |
show details | |

|
#15
Cascade Dr
Marion, NC 28752
|
- sq. feet
|
- baths - beds |
show details | |

|
#16
Idlewood Dr
Marion, NC 28752
|
- sq. feet
|
- baths - beds |
show details | |

|
#17
Stroud St
Marion, NC 28752
|
- sq. feet
|
- baths - beds |
show details | |

|
#18
Secrest St
Morganton, NC 28655
|
1,372 sq. feet
|
1 baths 3 beds |
show details | |

|
#19
Watermill Rd
Morganton, NC 28655
|
1,825 sq. feet
|
2 baths 3 beds |
show details | |

|
#20
Cannonball St
Morganton, NC 28655
|
1,470 sq. feet
|
1 baths 3 beds |
show details |
| Photo | Address | Area | Beds / Baths | Price | Details |
|---|---|---|---|---|---|

|
#21
Hennessee St
Morganton, NC 28655
|
1,008 sq. feet
|
1 baths 3 beds |
show details | |

|
#22
Pitts Farm Dr
Morganton, NC 28655
|
1,102 sq. feet
|
1 baths 1 beds |
show details | |

|
#23
Quail Dr
Morganton, NC 28655
|
2,040 sq. feet
|
2 baths 3 beds |
show details | |

|
#24
Jamestown Rd
Morganton, NC 28655
|
1,875 sq. feet
|
1 baths 3 beds |
show details | |

|
#25
Crystal Creek Rd
Morganton, NC 28655
|
1,040 sq. feet
|
2 baths 3 beds |
show details | |

|
#26
Saint Marys Church Rd
Morganton, NC 28655
|
1,260 sq. feet
|
1 baths 3 beds |
show details | |

|
#27
Sweetbriar Rd N
Lake Lure, NC 28746
|
1,836 sq. feet
|
2 baths 3 beds |
show details | |

|
#28
Nc 181
Morganton, NC 28655
|
1,092 sq. feet
|
1 baths 2 beds |
show details | |

|
#29
Arrowhead Dr
Morganton, NC 28655
|
2,128 sq. feet
|
2 baths 4 beds |
show details | |

|
#30
Freemantown Rd
Rutherfordton, NC 28139
|
832 sq. feet
|
2 baths 2 beds |
show details |
| Photo | Address | Area | Beds / Baths | Price | Details |
|---|---|---|---|---|---|

|
#31
Us 221n Hwy
Rutherfordton, NC 28139
|
2,144 sq. feet
|
1 baths 3 beds |
show details | |

|
#32
Edgewood Cir
Morganton, NC 28655
|
1,144 sq. feet
|
1 baths 3 beds |
show details | |

|
#33
Us 64
Morganton, NC 28655
|
1,510 sq. feet
|
1 baths 3 beds |
show details | |

|
#34
Chambers Ave
Morganton, NC 28655
|
624 sq. feet
|
1 baths 2 beds |
show details | |

|
#35
Harbor View Ter
Morganton, NC 28655
|
3,892 sq. feet
|
3 baths 3 beds |
show details | |

|
#36
Almalene Dr
Spruce Pine, NC 28777
|
1,512 sq. feet
|
2 baths 3 beds |
show details | |

|
#37
Jeter Browning Rd
Nebo, NC 28761
|
1,080 sq. feet
|
1 baths 3 beds |
show details | |

|
#38
Us 70 W
Morganton, NC 28655
|
862 sq. feet
|
1 baths 3 beds |
show details | |

|
#39
Bill Epley Ave
Morganton, NC 28655
|
1,176 sq. feet
|
1 baths 3 beds |
show details | |

|
#40
Doe Ct
Morganton, NC 28655
|
1,620 sq. feet
|
2 baths 4 beds |
show details |
| Photo | Address | Area | Beds / Baths | Price | Details |
|---|---|---|---|---|---|

|
#41
Us 64
Morganton, NC 28655
|
1,008 sq. feet
|
1 baths - beds |
show details | |

|
#42
Jamestown Rd
Morganton, NC 28655
|
1,196 sq. feet
|
2 baths - beds |
show details | |

|
#43
Jamestown Rd
Morganton, NC 28655
|
1,196 sq. feet
|
2 baths - beds |
show details | |

|
#44
Bill Epley Ave
Morganton, NC 28655
|
840 sq. feet
|
1 baths - beds |
show details | |

|
#45
Horn Mill Rd
Union Mills, NC 28167
|
864 sq. feet
|
- baths 2 beds |
show details | |

|
#46
Big Bear Blvd
Old Fort, NC 28762
|
- sq. feet
|
- baths - beds |
show details | |

|
#47
Watson Price Rd
Morganton, NC 28655
|
- sq. feet
|
- baths - beds |
show details | |

|
#48
Paul Shuping Ave
Morganton, NC 28655
|
- sq. feet
|
- baths - beds |
show details | |

|
#49
Shuping Ave
Morganton, NC 28655
|
- sq. feet
|
- baths - beds |
show details | |

|
Check over 1 million property listings on Foreclosure.com!
|
browse all offers | |||


- 4,74460.7%White alone
- 1,48719.0%Hispanic
- 88711.3%Black alone
- 3714.7%Asian alone
- 2222.8%Two or more races
- 1121.4%American Indian alone
- 100.1%Other race alone
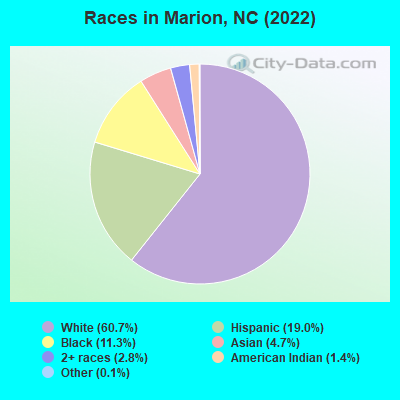
Races in Marion detailed stats: ancestries, foreign born residents, place of birth
According to our research of North Carolina and other state lists, there were 113 registered sex offenders living in Marion, North Carolina as of April 23, 2024.
The ratio of all residents to sex offenders in Marion is 71 to 1.
Type |
2009 |
2010 |
2011 |
2012 |
2013 |
2014 |
2015 |
2016 |
2017 |
2018 |
2019 |
2020 |
2021 |
2022 |
|---|---|---|---|---|---|---|---|---|---|---|---|---|---|---|
| Murders (per 100,000) | 0 (0.0) | 0 (0.0) | 1 (12.6) | 0 (0.0) | 0 (0.0) | 2 (25.3) | 1 (12.7) | 2 (25.6) | 0 (0.0) | 0 (0.0) | 0 (0.0) | 1 (12.7) | 0 (0.0) | 2 (26.2) |
| Rapes (per 100,000) | 1 (19.3) | 1 (12.8) | 0 (0.0) | 0 (0.0) | 0 (0.0) | 0 (0.0) | 2 (25.5) | 0 (0.0) | 0 (0.0) | 0 (0.0) | 1 (12.8) | 3 (38.2) | 3 (37.9) | 1 (13.1) |
| Robberies (per 100,000) | 8 (154.8) | 10 (127.6) | 6 (75.6) | 4 (50.4) | 4 (50.3) | 6 (75.9) | 7 (89.2) | 6 (76.7) | 3 (38.4) | 1 (13.2) | 1 (12.8) | 1 (12.7) | 1 (12.6) | 3 (39.3) |
| Assaults (per 100,000) | 23 (445.0) | 25 (319.0) | 19 (239.4) | 20 (252.1) | 26 (327.2) | 25 (316.3) | 15 (191.1) | 27 (345.0) | 31 (396.5) | 13 (171.5) | 10 (127.6) | 10 (127.2) | 5 (63.2) | 13 (170.3) |
| Burglaries (per 100,000) | 131 (2,535) | 136 (1,735) | 164 (2,066) | 184 (2,320) | 217 (2,731) | 185 (2,340) | 174 (2,217) | 179 (2,287) | 220 (2,814) | 156 (2,058) | 95 (1,212) | 111 (1,412) | 123 (1,554) | 92 (1,205) |
| Thefts (per 100,000) | 300 (5,805) | 285 (3,636) | 332 (4,183) | 362 (4,564) | 421 (5,299) | 407 (5,149) | 323 (4,115) | 403 (5,149) | 375 (4,796) | 264 (3,482) | 301 (3,841) | 283 (3,600) | 197 (2,489) | 190 (2,489) |
| Auto thefts (per 100,000) | 24 (464.4) | 17 (216.9) | 21 (264.6) | 14 (176.5) | 18 (226.6) | 21 (265.7) | 7 (89.2) | 30 (383.3) | 35 (447.6) | 24 (316.5) | 23 (293.5) | 45 (572.4) | 28 (353.7) | 31 (406.1) |
| Arson (per 100,000) | 8 (154.8) | 4 (51.0) | 3 (37.8) | 0 (0.0) | 0 (0.0) | 5 (63.3) | 2 (25.5) | 1 (12.8) | 2 (25.6) | 1 (13.2) | 0 (0.0) | 1 (12.7) | 0 (0.0) | 3 (39.3) |
| City-Data.com crime index | 597.7 | 396.5 | 428.9 | 424.6 | 501.8 | 527.6 | 437.8 | 539.8 | 515.4 | 346.9 | 301.5 | 373.9 | 283.4 | 325.2 |
The City-Data.com crime index weighs serious crimes and violent crimes more heavily. Higher means more crime, U.S. average is 246.1. It adjusts for the number of visitors and daily workers commuting into cities.
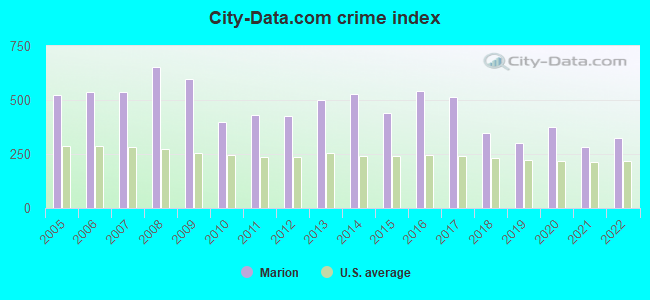
Crime rate in Marion detailed stats: murders, rapes, robberies, assaults, burglaries, thefts, arson
Full-time law enforcement employees in 2021, including police officers: 28 (26 officers - 21 male; 5 female).
| Officers per 1,000 residents here: | 3.28 |
| North Carolina average: | 2.27 |
 Recent articles from our blog. Our writers, many of them Ph.D. graduates or candidates, create easy-to-read articles on a wide variety of topics.


Latest news from Marion, NC collected exclusively by city-data.com from local newspapers, TV, and radio stations
Ancestries: American (15.8%), English (7.8%), Irish (7.8%), German (4.2%), Scotch-Irish (3.8%), European (3.0%).
Current Local Time: EST time zone
Elevation: 1395 feet
Land area: 3.40 square miles.
Population density: 2,201 people per square mile (low).
1,178 residents are foreign born (10.6% Latin America, 3.6% Asia).
| This city: | 15.1% |
| North Carolina: | 8.3% |
Median real estate property taxes paid for housing units with mortgages in 2022: $788 (0.5%)
Median real estate property taxes paid for housing units with no mortgage in 2022: $775 (0.6%)
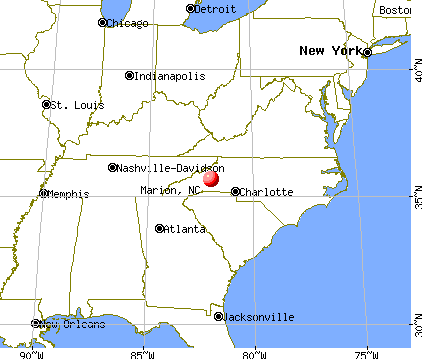
Nearest city with pop. 50,000+: Asheville, NC  (31.7 miles , pop. 68,889).
Nearest city with pop. 200,000+: Charlotte, NC (74.0 miles , pop. 540,828).
Nearest city with pop. 1,000,000+: Philadelphia, PA (478.8 miles , pop. 1,517,550).
Nearest cities:
), ), ), Latitude: 35.68 N, Longitude: 82.01 W
Daytime population change due to commuting: +4,875 (+62.3%)
Workers who live and work in this city: 1,023 (40.4%)
Area code: 828
Marion, North Carolina accommodation & food services, waste management - Economy and Business Data
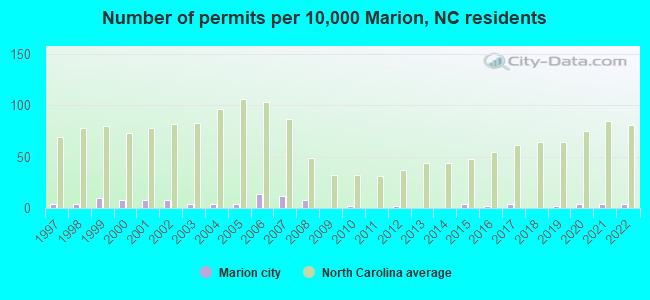
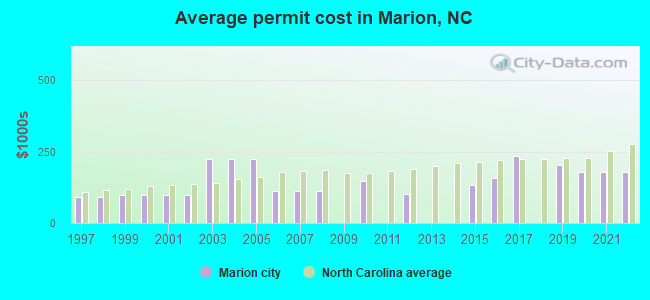
Single-family new house construction building permits:
- 2022: 2 buildings, average cost: $179,300
- 2021: 2 buildings, average cost: $179,300
- 2020: 2 buildings, average cost: $179,300
- 2019: 1 building, cost: $204,900
- 2017: 2 buildings, average cost: $234,900
- 2016: 1 building, cost: $159,000
- 2015: 2 buildings, average cost: $135,000
- 2012: 1 building, cost: $100,000
- 2010: 1 building, cost: $149,000
- 2008: 4 buildings, average cost: $114,300
- 2007: 6 buildings, average cost: $114,300
- 2006: 7 buildings, average cost: $114,300
- 2005: 2 buildings, average cost: $225,000
- 2004: 2 buildings, average cost: $225,000
- 2003: 2 buildings, average cost: $225,000
- 2002: 4 buildings, average cost: $99,000
- 2001: 4 buildings, average cost: $99,000
- 2000: 4 buildings, average cost: $99,000
- 1999: 5 buildings, average cost: $99,000
- 1998: 2 buildings, average cost: $91,000
- 1997: 2 buildings, average cost: $91,000
| Here: | 2.9% |
| North Carolina: | 3.2% |
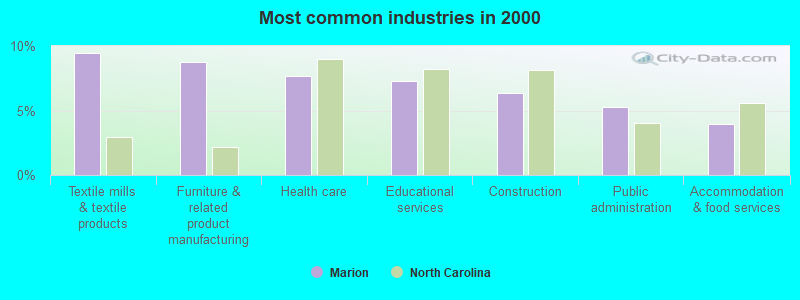
- Textile mills & textile products (9.4%)
- Furniture & related product manufacturing (8.7%)
- Health care (7.6%)
- Educational services (7.3%)
- Construction (6.3%)
- Public administration (5.2%)
- Accommodation & food services (4.0%)
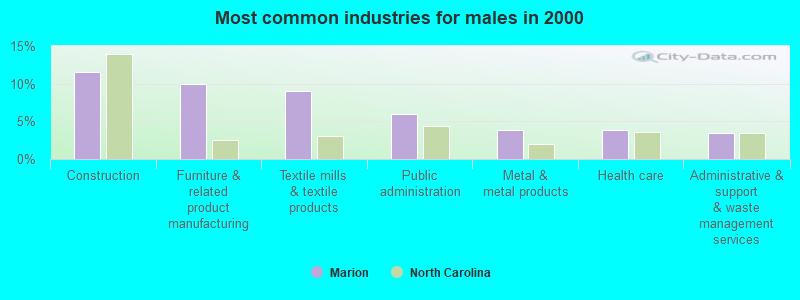
- Construction (11.5%)
- Furniture & related product manufacturing (10.0%)
- Textile mills & textile products (9.0%)
- Public administration (6.0%)
- Metal & metal products (3.9%)
- Health care (3.8%)
- Administrative & support & waste management services (3.5%)
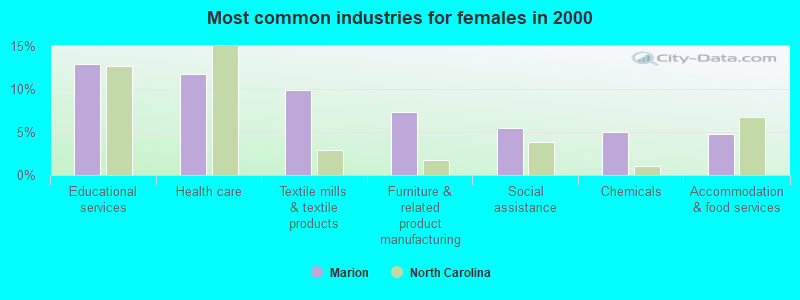
- Educational services (12.9%)
- Health care (11.8%)
- Textile mills & textile products (9.9%)
- Furniture & related product manufacturing (7.4%)
- Social assistance (5.4%)
- Chemicals (5.0%)
- Accommodation & food services (4.7%)
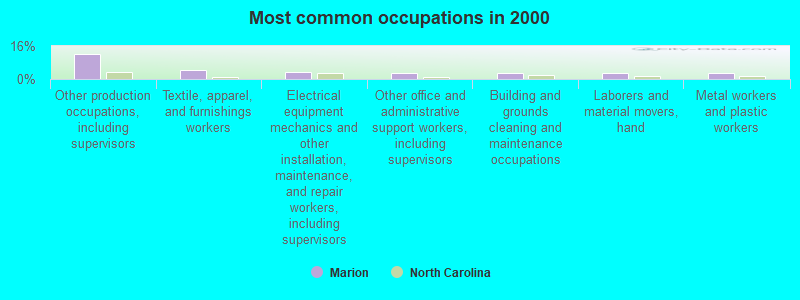
- Other production occupations, including supervisors (12.3%)
- Textile, apparel, and furnishings workers (4.5%)
- Electrical equipment mechanics and other installation, maintenance, and repair workers, including supervisors (3.2%)
- Other office and administrative support workers, including supervisors (3.1%)
- Building and grounds cleaning and maintenance occupations (3.0%)
- Laborers and material movers, hand (3.0%)
- Metal workers and plastic workers (2.9%)
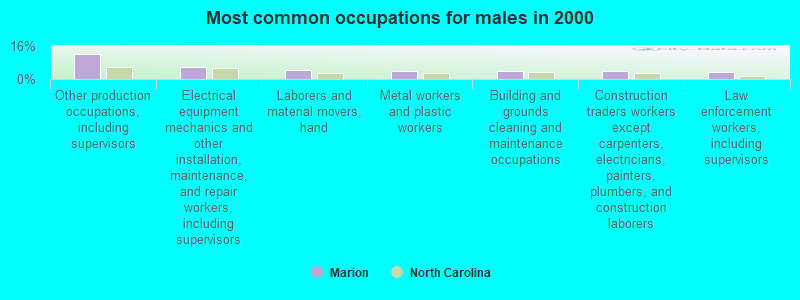
- Other production occupations, including supervisors (12.1%)
- Electrical equipment mechanics and other installation, maintenance, and repair workers, including supervisors (5.7%)
- Laborers and material movers, hand (4.5%)
- Metal workers and plastic workers (4.1%)
- Building and grounds cleaning and maintenance occupations (3.8%)
- Construction traders workers except carpenters, electricians, painters, plumbers, and construction laborers (3.7%)
- Law enforcement workers, including supervisors (3.3%)
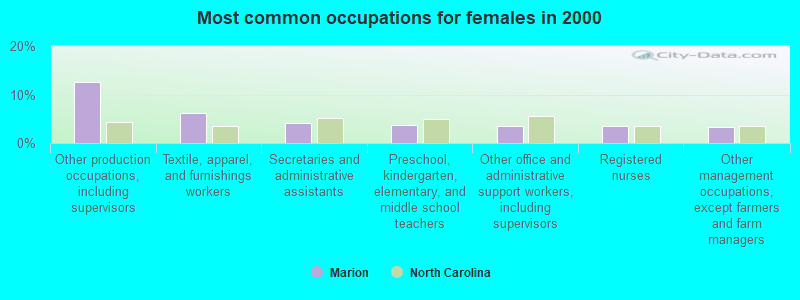
- Other production occupations, including supervisors (12.5%)
- Textile, apparel, and furnishings workers (6.2%)
- Secretaries and administrative assistants (4.0%)
- Preschool, kindergarten, elementary, and middle school teachers (3.6%)
- Other office and administrative support workers, including supervisors (3.5%)
- Registered nurses (3.4%)
- Other management occupations, except farmers and farm managers (3.3%)
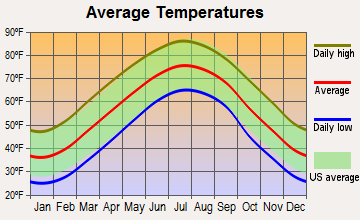
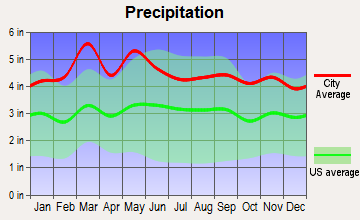
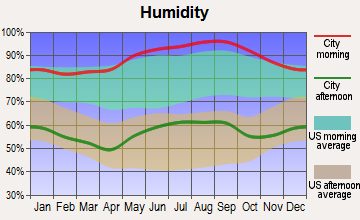
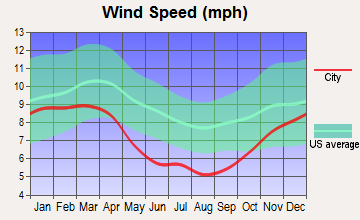
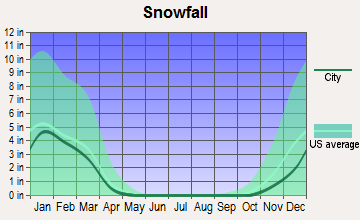
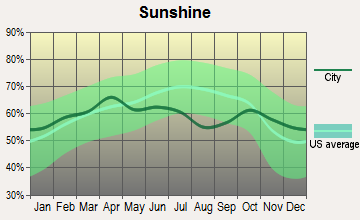
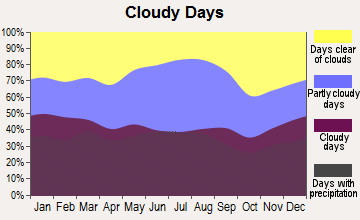
Average climate in Marion, North Carolina
Based on data reported by over 4,000 weather stations
|
|

(lower is better)
Air Quality Index (AQI) level in 2023 was 78.1. This is about average.
| City: | 78.1 |
| U.S.: | 72.6 |
Ozone [ppb] level in 2022 was 32.9. This is about average. Closest monitor was 11.3 miles away from the city center.
| City: | 32.9 |
| U.S.: | 33.3 |
Particulate Matter (PM2.5) [µg/m3] level in 2023 was 7.69. This is about average. Closest monitor was 0.7 miles away from the city center.
| City: | 7.69 |
| U.S.: | 8.11 |
Tornado activity:
Marion-area historical tornado activity is slightly below North Carolina state average. It is 35% smaller than the overall U.S. average.
On 5/5/1989, a category F4 (max. wind speeds 207-260 mph) tornado 28.1 miles away from the Marion city center killed 4 people and injured 52 people and caused between $5,000,000 and $50,000,000 in damages.
On 5/5/1989, a category F4 tornado 31.7 miles away from the city center killed 2 people and injured 35 people and caused between $500,000 and $5,000,000 in damages.
Earthquake activity:
Marion-area historical earthquake activity is significantly above North Carolina state average. It is 13% greater than the overall U.S. average.On 8/9/2020 at 12:07:37, a magnitude 5.1 (5.1 MW, Depth: 4.7 mi, Class: Moderate, Intensity: VI - VII) earthquake occurred 74.9 miles away from Marion center
On 8/23/2011 at 17:51:04, a magnitude 5.8 (5.8 MW, Depth: 3.7 mi) earthquake occurred 272.9 miles away from the city center
On 8/2/1974 at 08:52:09, a magnitude 4.9 (4.3 MB, 4.9 LG, Class: Light, Intensity: IV - V) earthquake occurred 128.2 miles away from the city center
On 7/27/1980 at 18:52:21, a magnitude 5.2 (5.1 MB, 4.7 MS, 5.0 UK, 5.2 UK) earthquake occurred 204.7 miles away from the city center
On 11/30/1973 at 07:48:41, a magnitude 4.7 (4.7 MB, 4.6 ML) earthquake occurred 110.1 miles away from Marion center
On 11/23/2006 at 10:42:57, a magnitude 4.3 (4.3 MB) earthquake occurred 102.0 miles away from Marion center
Magnitude types: regional Lg-wave magnitude (LG), body-wave magnitude (MB), local magnitude (ML), surface-wave magnitude (MS), moment magnitude (MW)
Natural disasters:
The number of natural disasters in McDowell County (13) is near the US average (15).Major Disasters (Presidential) Declared: 8
Emergencies Declared: 2
Causes of natural disasters: Floods: 4, Hurricanes: 3, Storms: 3, Tropical Storms: 2, Winter Storms: 2, Blizzard: 1, Ice Storm: 1, Snowfall: 1, Other: 1 (Note: some incidents may be assigned to more than one category).
Hospitals and medical centers in Marion:
Airports and heliports located in Marion:
- Shiflet Field Airport (9A9) (Runways: 1, Itinerant Ops: 1,000, Local Ops: 3,300, Military Ops: 50)
- Mcdowell Hospital Heliport (NC33)
College/University in Marion:
Colleges/universities with over 2000 students nearest to Marion:
- Western Piedmont Community College (about 19 miles; Morganton, NC; Full-time enrollment: 2,205)
- Isothermal Community College (about 25 miles; Spindale, NC; FT enrollment: 2,165)
- Caldwell Community College and Technical Institute (about 32 miles; Hudson, NC; FT enrollment: 3,636)
- University of North Carolina at Asheville (about 32 miles; Asheville, NC; FT enrollment: 3,312)
- Asheville-Buncombe Technical Community College (about 32 miles; Asheville, NC; FT enrollment: 6,992)
- Gardner-Webb University (about 36 miles; Boiling Springs, NC; FT enrollment: 4,241)
- Cleveland Community College (about 41 miles; Shelby, NC; FT enrollment: 2,541)
Public high schools in Marion:
- MCDOWELL HIGH (Location: 600 MCDOWELL HIGH SCHOOL DR, Grades: 9-12)
- MCDOWELL EARLY COLLEGE (Location: 54 COLLEGE DRIVE, Grades: 9-12)
- MCDOWELL AEC (Location: 176 LUKIN ST, Grades: 6-12)
Private high school in Marion:
Public elementary/middle schools in Marion:
- EAST MCDOWELL MIDDLE (Location: 676 STATE STREET, Grades: 6-8)
- EASTFIELD GLOBAL MAGNET (Location: 170 EASTFIELD SCHOOL ROAD, Grades: PK-5)
- GLENWOOD ELEMENTARY (Location: 1545 OLD HWY 221 SOUTH, Grades: PK-5)
- MARION ELEMENTARY (Location: 209 ROBERT STREET, Grades: PK-5)
- NORTH COVE ELEMENTARY (Location: 401 AMERICAN THREAD ROAD, Grades: PK-5)
- PLEASANT GARDENS ELEMENTARY (Location: 100 JOHN ROACH DRIVE, Grades: PK-5)
- WEST MARION ELEMENTARY (Location: 820 MARLER ROAD, Grades: PK-5)
- WEST MCDOWELL MIDDLE (Location: 346 MCDOWELL HIGH SCHOOL ROAD, Grades: 6-8)
User-submitted facts and corrections:
- whky dt/tv hickory, n.c. - power 2,000 kw
Points of interest:
Notable locations in Marion: Lady Marian Plaza (A), McDowell County Courthouse (B), Grandfather Ranger District Office (C), Marion City Hall (D). Display/hide their locations on the map
Churches in Marion include: Central Church (A), Bethlehem Church (B). Display/hide their locations on the map
Cemetery: Oak Grove Cemetery (1). Display/hide its location on the map
Tourist attractions: Historic Carson House (Museums; Hwy 70 W), Linville Caverns Inc (Recreation Areas; 19929 US221 North), Linaken Inc (165 Stockton Drive).
Hotels: Comfort Inn (178 US70 West), Comfort Inn Marion (178 Highway 70 West), Days Inn (4248 US221 South), Hampton Inn Marion (3560 US 221 South), Budget Inn (1814 North Main Street), Econo Lodge (2035 US221 North).
Birthplace of: Ron Jacobs (basketball) - Basketball coache, Roy Williams (coach) - Basketball player and coach, Pres Mull - Soilder, Barbara Loden - Film actor.
Drinking water stations with addresses in Marion and their reported violations in the past:
LAKE JAMES LANDING #2 (Population served: 660, Groundwater):Past monitoring violations:RIVERSIDE FOOD MART (Population served: 500, Groundwater):
- One routine major monitoring violation
Past monitoring violations:ZION HILL BAPTIST CHURCH (Population served: 225, Groundwater):
- One regular monitoring violation
Past monitoring violations:PROVIDENCE UMC (Population served: 200, Groundwater):
- 11 routine major monitoring violations
- One regular monitoring violation
Past monitoring violations:LAKE JAMES LANDING (Population served: 155, Groundwater):
- 11 routine major monitoring violations
- 3 regular monitoring violations
Past monitoring violations:NEALSVILLE CHURCH OF GOD (Population served: 150, Groundwater):
- 2 routine major monitoring violations
Past monitoring violations:ROCKY PASS FWB CHRUCH (Population served: 150, Groundwater):
- One routine major monitoring violation
- 5 regular monitoring violations
Past monitoring violations:LUCKY STRIKE MINERS DINER (Population served: 137, Groundwater):
- 2 regular monitoring violations
Past monitoring violations:
- 7 routine major monitoring violations
Drinking water stations with addresses in Marion that have no violations reported:
- MARION TRAVEL PLAZA (Population served: 400, Primary Water Source Type: Groundwater)
- YOGI BEAR`S JELLYSTONE PRK REC AREA (Population served: 200, Primary Water Source Type: Groundwater)
- YOGI BEAR`S JELLYSTONE PARK (Population served: 200, Primary Water Source Type: Groundwater)
- NEW HORIZON FELLOWSHIP CHURCH (Population served: 125, Primary Water Source Type: Groundwater)
- WEST COURT NO 2 (Population served: 100, Primary Water Source Type: Groundwater)
- FAITH MISSION BAPTIST CHURCH (Population served: 85, Primary Water Source Type: Groundwater)
- TRIPLE C CAMPGROUND (Population served: 75, Primary Water Source Type: Groundwater)
- FAIRVIEW FWB CHURCH (Population served: 75, Primary Water Source Type: Groundwater)
- MOUNTAIN STREAM RV PARK (Population served: 50, Primary Water Source Type: Groundwater)
| This city: | 2.4 people |
| North Carolina: | 2.5 people |
| This city: | 61.2% |
| Whole state: | 66.7% |
| This city: | 6.9% |
| Whole state: | 5.9% |
Likely homosexual households (counted as self-reported same-sex unmarried-partner households)
- Lesbian couples: 0.3% of all households
- Gay men: 0.2% of all households
People in group quarters in Marion in 2010:
- 785 people in state prisons
- 197 people in nursing facilities/skilled-nursing facilities
- 114 people in local jails and other municipal confinement facilities
- 84 people in other noninstitutional facilities
- 41 people in emergency and transitional shelters (with sleeping facilities) for people experiencing homelessness
- 15 people in residential treatment centers for adults
- 5 people in workers' group living quarters and job corps centers
People in group quarters in Marion in 2000:
- 99 people in local jails and other confinement facilities (including police lockups)
- 50 people in nursing homes
- 44 people in other noninstitutional group quarters
- 19 people in homes for the mentally retarded
- 18 people in other nonhousehold living situations
- 7 people in homes or halfway houses for drug/alcohol abuse
Banks with branches in Marion (2011 data):
- Fifth Third Bank: Marion Drive Thru at 5 South Logan Street, branch established on 1989/07/28; Marion Branch at 14 South Main Street, branch established on 1989/07/28. Info updated 2009/10/05: Bank assets: $114,540.4 mil, Deposits: $89,689.1 mil, headquarters in Cincinnati, OH, positive income, Commercial Lending Specialization, 1378 total offices, Holding Company: Fifth Third Bancorp
- First-Citizens Bank & Trust Company: Marion Branch at 1570 North Main Street, branch established on 1969/11/10. Info updated 2011/10/11: Bank assets: $20,566.4 mil, Deposits: $17,596.8 mil, headquarters in Raleigh, NC, positive income, Commercial Lending Specialization, 433 total offices, Holding Company: First Citizens Bancshares, Inc.
- Wells Fargo Bank, National Association: Marion Main Branch at 145 North Main Street, branch established on 1961/10/23. Info updated 2011/04/05: Bank assets: $1,161,490.0 mil, Deposits: $905,653.0 mil, headquarters in Sioux Falls, SD, positive income, 6395 total offices, Holding Company: Wells Fargo & Company
- Asheville Savings Bank, S.S.B.: Marion Branch at 162 North Main Street, branch established on 1904/01/01. Info updated 2006/11/03: Bank assets: $785.8 mil, Deposits: $625.3 mil, headquarters in Asheville, NC, positive income, 13 total offices, Holding Company: Asb Bancorp, Inc.
- Bank of America, National Association: Marion Main Branch at 100 North Main Street, branch established on 1964/02/28. Info updated 2009/11/18: Bank assets: $1,451,969.3 mil, Deposits: $1,077,176.8 mil, headquarters in Charlotte, NC, positive income, 5782 total offices, Holding Company: Bank Of America Corporation
- Mountain 1st Bank & Trust Company: Marion Branch at 174 Highway 70 West, branch established on 2006/05/10. Info updated 2010/07/12: Bank assets: $700.0 mil, Deposits: $672.7 mil, headquarters in Hendersonville, NC, negative income in the last year, Commercial Lending Specialization, 12 total offices, Holding Company: 1st Financial Services Corporation
For population 15 years and over in Marion:
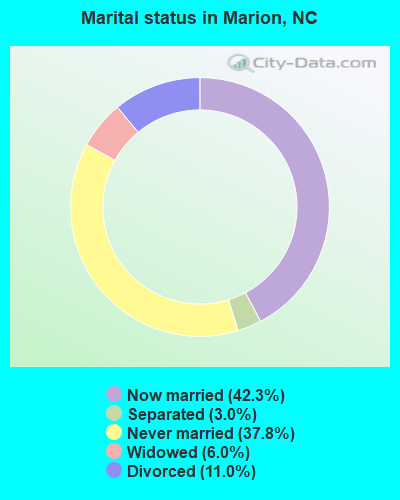
- Never married: 37.8%
- Now married: 42.3%
- Separated: 3.0%
- Widowed: 6.0%
- Divorced: 11.0%
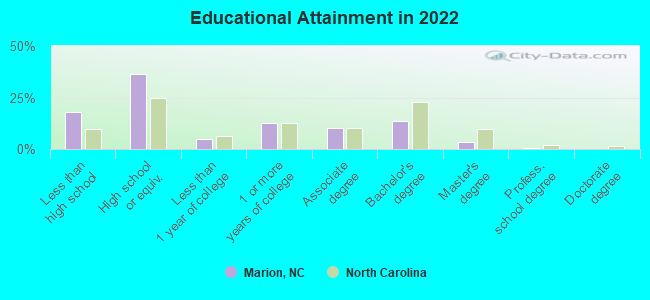
For population 25 years and over in Marion:
- High school or higher: 80.4%
- Bachelor's degree or higher: 16.3%
- Graduate or professional degree: 3.8%
- Unemployed: 6.5%
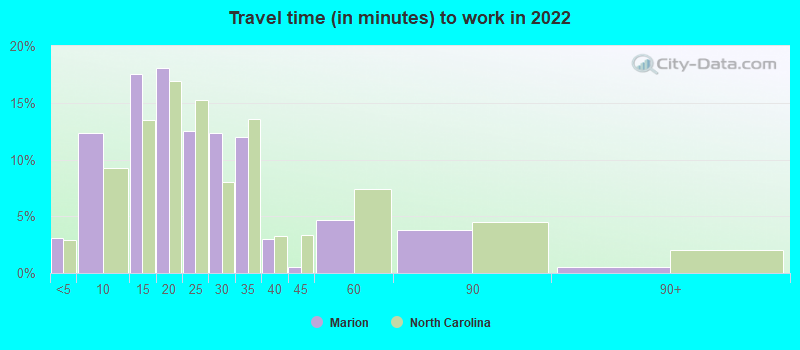
- Mean travel time to work (commute): 24.9 minutes
| Here: | 11.5 |
| North Carolina average: | 11.7 |
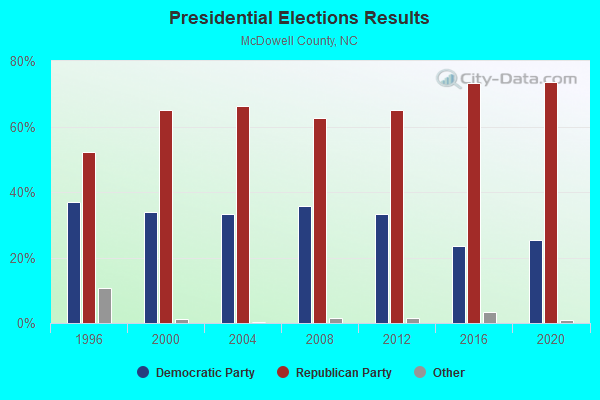

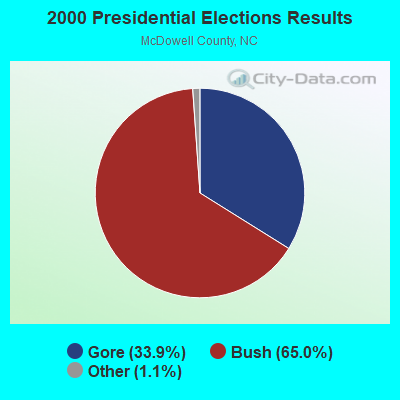

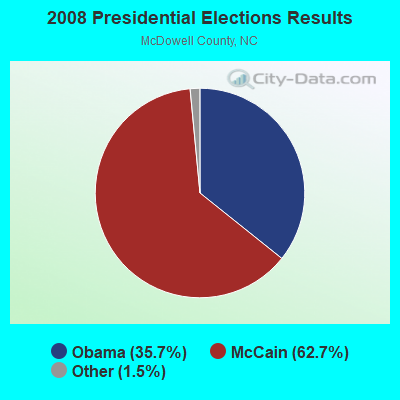
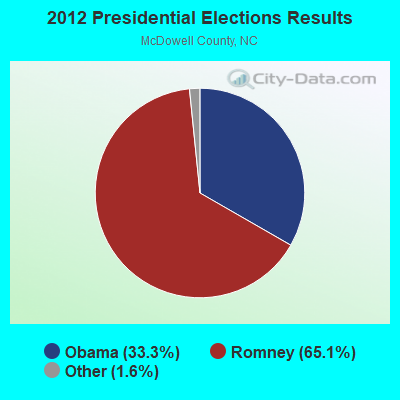
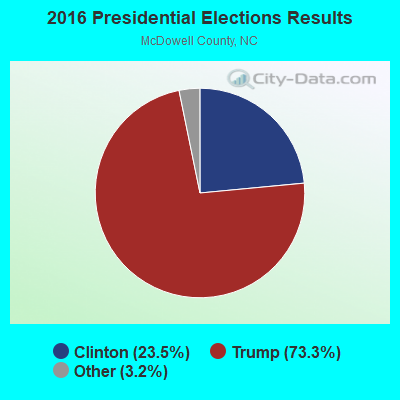
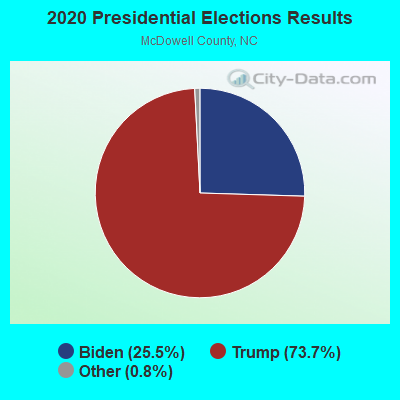
Graphs represent county-level data. Detailed 2008 Election Results
Religion statistics for Marion, NC (based on McDowell County data)
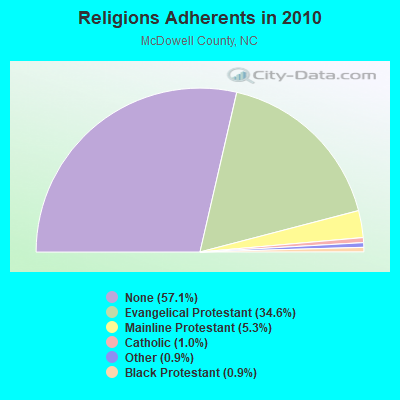
| Religion | Adherents | Congregations |
|---|---|---|
| Evangelical Protestant | 15,654 | 78 |
| Mainline Protestant | 2,406 | 23 |
| Catholic | 460 | 1 |
| Other | 426 | 2 |
| Black Protestant | 420 | 3 |
| None | 25,823 | - |
Food Environment Statistics:
| McDowell County: | 2.53 / 10,000 pop. |
| North Carolina: | 2.05 / 10,000 pop. |
| McDowell County: | 1.38 / 10,000 pop. |
| State: | 0.92 / 10,000 pop. |
| Here: | 6.43 / 10,000 pop. |
| State: | 4.75 / 10,000 pop. |
| This county: | 5.75 / 10,000 pop. |
| North Carolina: | 7.57 / 10,000 pop. |
| McDowell County: | 10.9% |
| State: | 9.8% |
| Here: | 32.2% |
| State: | 28.3% |
| McDowell County: | 13.2% |
| North Carolina: | 15.6% |
Health and Nutrition:
| Here: | 47.9% |
| North Carolina: | 48.9% |
| Marion: | 42.9% |
| State: | 46.1% |
| Here: | 28.7 |
| North Carolina: | 28.8 |
| Here: | 21.5% |
| North Carolina: | 20.7% |
| This city: | 12.3% |
| North Carolina: | 10.7% |
| This city: | 6.8 |
| North Carolina: | 6.8 |
| Marion: | 33.0% |
| North Carolina: | 33.7% |
| Marion: | 52.8% |
| North Carolina: | 55.8% |
| This city: | 76.4% |
| State: | 79.7% |
More about Health and Nutrition of Marion, NC Residents
| Local government employment and payroll (March 2022) | |||||
| Function | Full-time employees | Monthly full-time payroll | Average yearly full-time wage | Part-time employees | Monthly part-time payroll |
|---|---|---|---|---|---|
| Police Protection - Officers | 26 | $100,518 | $46,393 | 0 | $0 |
| Water Supply | 12 | $39,684 | $39,684 | 0 | $0 |
| Financial Administration | 10 | $40,621 | $48,745 | 0 | $0 |
| Other and Unallocable | 9 | $26,524 | $35,365 | 10 | $8,272 |
| Streets and Highways | 9 | $27,588 | $36,784 | 0 | $0 |
| Sewerage | 8 | $28,852 | $43,278 | 0 | $0 |
| Solid Waste Management | 8 | $23,560 | $35,340 | 0 | $0 |
| Firefighters | 8 | $27,834 | $41,751 | 3 | $1,375 |
| Other Government Administration | 4 | $24,629 | $73,887 | 7 | $6,161 |
| Fire - Other | 2 | $10,705 | $64,230 | 1 | $1,051 |
| Police - Other | 2 | $6,025 | $36,150 | 0 | $0 |
| Totals for Government | 98 | $356,539 | $43,658 | 21 | $16,859 |
Marion government finances - Expenditure in 2017 (per resident):
- Construction - Sewerage: $760,000 ($101.44)
Housing and Community Development: $226,000 ($30.17)
- Current Operations - Police Protection: $1,994,000 ($266.15)
Liquor Stores: $1,791,000 ($239.05)
Water Utilities: $1,697,000 ($226.51)
Regular Highways: $1,259,000 ($168.05)
Sewerage: $886,000 ($118.26)
Local Fire Protection: $570,000 ($76.08)
Solid Waste Management: $503,000 ($67.14)
Financial Administration: $479,000 ($63.93)
General - Other: $402,000 ($53.66)
Protective Inspection and Regulation - Other: $262,000 ($34.97)
Parks and Recreation: $131,000 ($17.49)
Housing and Community Development: $34,000 ($4.54)
Health - Other: $6,000 ($0.80)
- General - Interest on Debt: $49,000 ($6.54)
- Intergovernmental to Local - Other - Health - Other: $8,000 ($1.07)
- Other Capital Outlay - Police Protection: $332,000 ($44.31)
Solid Waste Management: $168,000 ($22.42)
Water Utilities: $78,000 ($10.41)
Sewerage: $56,000 ($7.47)
Regular Highways: $26,000 ($3.47)
Financial Administration: $15,000 ($2.00)
Housing and Community Development: $9,000 ($1.20)
Local Fire Protection: $4,000 ($0.53)
- Total Salaries and Wages: $425,000 ($56.73)
- Water Utilities - Interest on Debt: $26,000 ($3.47)
Marion government finances - Revenue in 2017 (per resident):
- Charges - Sewerage: $1,201,000 ($160.30)
Solid Waste Management: $189,000 ($25.23)
Other: $56,000 ($7.47)
Parks and Recreation: $41,000 ($5.47)
Miscellaneous Commercial Activities: $23,000 ($3.07)
- Local Intergovernmental - Other: $432,000 ($57.66)
Housing and Community Development: $9,000 ($1.20)
- Miscellaneous - General Revenue - Other: $292,000 ($38.97)
Donations From Private Sources: $198,000 ($26.43)
Sale of Property: $47,000 ($6.27)
Interest Earnings: $0 ($0.00)
- Revenue - Water Utilities: $2,054,000 ($274.16)
Liquor Stores: $1,956,000 ($261.08)
- State Intergovernmental - General Local Government Support: $692,000 ($92.37)
Highways: $224,000 ($29.90)
Housing and Community Development: $159,000 ($21.22)
Other: $87,000 ($11.61)
- Tax - Property: $2,388,000 ($318.74)
General Sales and Gross Receipts: $1,587,000 ($211.83)
Alcoholic Beverage Sales: $129,000 ($17.22)
Motor Vehicle License: $27,000 ($3.60)
Other License: $15,000 ($2.00)
Marion government finances - Debt in 2017 (per resident):
- Long Term Debt - Beginning Outstanding - Unspecified Public Purpose: $2,376,000 ($317.14)
Outstanding Unspecified Public Purpose: $2,113,000 ($282.03)
Retired Unspecified Public Purpose: $264,000 ($35.24)
| Businesses in Marion, NC | ||||
| Name | Count | Name | Count | |
|---|---|---|---|---|
| AT&T | 1 | McDonald's | 2 | |
| Advance Auto Parts | 1 | Nike | 1 | |
| AutoZone | 1 | Pizza Hut | 1 | |
| Burger King | 1 | Rite Aid | 1 | |
| CVS | 1 | SONIC Drive-In | 1 | |
| Chevrolet | 1 | Sears | 1 | |
| Comfort Inn | 1 | Subway | 3 | |
| Days Inn | 1 | Super 8 | 1 | |
| Domino's Pizza | 1 | Taco Bell | 1 | |
| FedEx | 4 | U-Haul | 4 | |
| H&R Block | 1 | U.S. Cellular | 1 | |
| Hilton | 1 | UPS | 4 | |
| KFC | 2 | Verizon Wireless | 2 | |
| Kincaid | 1 | Waffle House | 1 | |
| La-Z-Boy | 1 | Walmart | 1 | |
| Lane Furniture | 1 | Wendy's | 1 | |
| Little Caesars Pizza | 1 | YMCA | 1 | |
| Lowe's | 1 | |||
Strongest AM radio stations in Marion:
- WBRM (1250 AM; 5 kW; MARION, NC; Owner: WBRM, INC.)
- WFGW (1010 AM; 50 kW; BLACK MOUNTAIN, NC; Owner: BLUE RIDGE BROADCASTING CORP.)
- WHKY (1290 AM; 50 kW; HICKORY, NC; Owner: LONG COMMUNICATIONS, LLC.)
- WWOL (780 AM; daytime; 10 kW; FOREST CITY, NC; Owner: HOLLY SPRINGS BAPTIST BROADCASTING CO., INC.)
- WLFJ (660 AM; daytime; 50 kW; GREENVILLE, SC; Owner: CLEAR CHANNEL BROADCASTING LICENSES, INC.)
- WKJV (1380 AM; 25 kW; ASHEVILLE, NC; Owner: INTERNATIONAL BAPTIST OUTREACH MISSIONS)
- WCIS (760 AM; daytime; 4 kW; MORGANTON, NC; Owner: W.F.M. INCORPORATED)
- WCSZ (1070 AM; 50 kW; SANS SOUCI, SC; Owner: WHYZ RADIO, L.P.)
- WWRN (1350 AM; 10 kW; BLACK MOUNTAIN, NC; Owner: BLACK MOUNTAIN BROADCASTING CORP.)
- WTOE (1470 AM; 5 kW; SPRUCE PINE, NC; Owner: MOUNTAIN VALLEY MEDIA, INC.)
- WKYK (940 AM; 5 kW; BURNSVILLE, NC; Owner: MARK MEDIA, INC.)
- WBT (1110 AM; 50 kW; CHARLOTTE, NC; Owner: JEFFERSON-PILOT COMMUNICATNS CO. OF NORTH CAROLINA)
- WJFJ (1160 AM; 10 kW; TRYON, NC; Owner: COLUMBUS BROADCAST CORPORATION, INC.)
Strongest FM radio stations in Marion:
- WMIT (106.9 FM; BLACK MOUNTAIN, NC; Owner: BLUE RIDGE BROADCASTING CORPORATION)
- WNCW (88.7 FM; SPINDALE, NC; Owner: ISOTHERMAL COMMUNITY COLLEGE)
- WQNQ (104.3 FM; OLD FORT, NC; Owner: CLEAR CHANNEL BROADCASTING LICENSES, INC.)
- WAGI-FM (105.3 FM; GAFFNEY, SC; Owner: GAFFNEY BROADCASTING, INC.)
- WTPT (93.3 FM; FOREST CITY, NC; Owner: UPSTATE BROADCASTING, LLC)
- WECR-FM (102.3 FM; BEECH MOUNTAIN, NC; Owner: RONDINARO BROADCASTING, INC)
- WKSF (99.9 FM; ASHEVILLE, NC; Owner: CAPSTAR TX LIMITED PARTNERSHIP)
- WZJS (100.7 FM; BANNER ELK, NC; Owner: HIGHLAND COMMUNICATIONS ASSOCIATES, LLC)
- WSPA-FM (98.9 FM; SPARTANBURG, SC; Owner: ENTERCOM GREENVILLE LICENSE, LLC)
- WFBC-FM (93.7 FM; GREENVILLE, SC; Owner: ENTERCOM GREENVILLE LICENSE, LLC)
- WHCB (91.5 FM; BRISTOL, TN; Owner: APPALACHIAN EDUC. COMMUNICATION CORP)
- W220CD (91.9 FM; ENKA, NC; Owner: CALVARY CHAPEL OF TWIN FALLS, INC.)
- WMYI (102.5 FM; HENDERSONVILLE, NC; Owner: CAPSTAR TX LIMITED PARTNERSHIP)
- WETS-FM (89.5 FM; JOHNSON CITY, TN; Owner: EAST TENNESSEE STATE UNIVERSITY)
- WXBQ-FM (96.9 FM; BRISTOL, TN; Owner: BRISTOL BROADCASTING COMPANY, INC.)
- WPJO (99.3 FM; ELIZABETHTON, TN; Owner: BRISTOL BROADCASTING COMPANY, INC.)
- WESC-FM (92.5 FM; GREENVILLE, SC; Owner: CLEAR CHANNEL BROADCASTING LICENSES, INC.)
- WCQR-FM (88.3 FM; KINGSPORT, TN; Owner: POSITIVE ALTERNATIVE RADIO, INC.)
- W214AP (90.7 FM; JOHNSON CITY, TN; Owner: THE MOODY BIBLE INSTITUTE OF CHICAGO)
- W285DG (104.9 FM; BOONE, NC; Owner: CITADEL BROADCASTING COMPANY)
TV broadcast stations around Marion:
- W43AU (Channel 43; MARION, NC; Owner: UNIVERSITY OF NORTH CAROLINA)
- W08BJ (Channel 8; MARION, ETC., NC; Owner: MEDIA GENERAL BROADCASTING OF SO. CAROLINA HOLDINGS, INC.)
- W06AI (Channel 6; MARION, NC; Owner: WYFF HEARST-ARGYLE TELEVISION, INC.)
- W10AP (Channel 10; MARION, ETC., NC; Owner: WLOS LICENSEE, LLC)
- WASV-TV (Channel 62; ASHEVILLE, NC; Owner: MEDIA GENERAL BROADCASTING OF SOUTH CAROLINA HOLDINGS, INC.)
- WBTV (Channel 3; CHARLOTTE, NC; Owner: JEFFERSON-PILOT COMMUNICATIONS/WBTV, INC.)
- WCNC-TV (Channel 36; CHARLOTTE, NC; Owner: WCNC-TV, INC.)
- WJZY (Channel 46; BELMONT, NC; Owner: WJZY-TV, INC.)
- WWWB (Channel 55; ROCK HILL, SC; Owner: WWWB-TV, INC.)
- WHNS (Channel 21; ASHEVILLE, NC; Owner: MEREDITH CORPORATION)
- WUNE-TV (Channel 17; LINVILLE, NC; Owner: UNIVERSITY OF NORTH CAROLINA)
- W28AO (Channel 28; SPRUCE PINE, NC; Owner: UNIVERSITY OF NORTH CAROLINA)
- National Bridge Inventory (NBI) Statistics
- 117Number of bridges
- 1,024ft / 312mTotal length
- 834,430Total average daily traffic
- 130,162Total average daily truck traffic
- New bridges - historical statistics
- 31920-1929
- 11930-1939
- 461950-1959
- 101960-1969
- 81970-1979
- 141980-1989
- 71990-1999
- 162000-2009
- 122010-2019
FCC Registered Antenna Towers: 173 (See the full list of FCC Registered Antenna Towers)
FCC Registered Commercial Land Mobile Towers: 1 (See the full list of FCC Registered Commercial Land Mobile Towers in Marion, NC)
FCC Registered Private Land Mobile Towers: 2 (See the full list of FCC Registered Private Land Mobile Towers)
FCC Registered Broadcast Land Mobile Towers: 37 (See the full list of FCC Registered Broadcast Land Mobile Towers)
FCC Registered Microwave Towers: 28 (See the full list of FCC Registered Microwave Towers in this town)
FCC Registered Amateur Radio Licenses: 247 (See the full list of FCC Registered Amateur Radio Licenses in Marion)
FAA Registered Aircraft: 28 (See the full list of FAA Registered Aircraft in Marion)
2002 - 2018 National Fire Incident Reporting System (NFIRS) incidents
- Fire incident types reported to NFIRS in Marion, NC
- 1,62658.0%Structure Fires
- 78728.1%Outside Fires
- 28510.2%Mobile Property/Vehicle Fires
- 1063.8%Other
 Based on the data from the years 2002 - 2018 the average number of fires per year is 165. The highest number of fires - 264 took place in 2018, and the least - 40 in 2002. The data has a growing trend.
 When looking into fire subcategories, the most incidents belonged to: Structure Fires (58.0%), and Outside Fires (28.1%).
Fire-safe hotels and motels in Marion, North Carolina:
- Americas Best Value Inn, 4248 Hwy 221 S, Marion, North Carolina 28752 , Phone: (828) 659-2567, Fax: (828) 652-4334
- Comfort Inn, 178 Hwy 70 W, Marion, North Carolina 28752 , Phone: (828) 652-4888, Fax: (828) 652-3787
- Hampton Inn Marion, NC, 3560 US 221 S, Marion, North Carolina 28752 , Phone: (828) 652-5100, Fax: (828) 659-8203
- 61.2%Electricity
- 16.2%Fuel oil, kerosene, etc.
- 12.5%Utility gas
- 8.2%Bottled, tank, or LP gas
- 1.2%No fuel used
- 0.7%Wood
- 80.5%Electricity
- 7.8%Fuel oil, kerosene, etc.
- 5.1%Bottled, tank, or LP gas
- 3.0%Wood
- 2.4%No fuel used
- 1.1%Utility gas
Marion compared to North Carolina state average:
- Median house value below state average.
- Unemployed percentage below state average.
- Hispanic race population percentage above state average.
- Median age below state average.
- Foreign-born population percentage significantly above state average.
- Length of stay since moving in significantly above state average.
- House age above state average.
- Institutionalized population percentage significantly above state average.
- Percentage of population with a bachelor's degree or higher below state average.

|
|
Total of 13 patent applications in 2008-2024.