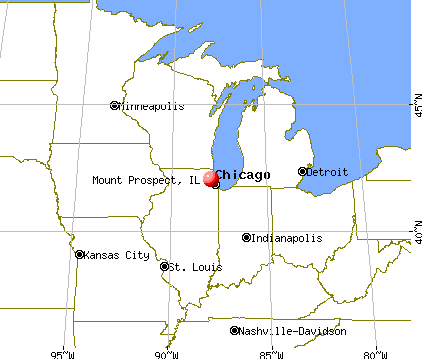
Mount Prospect, Illinois

Mount Prospect: Mt. Prospect Park District - First Snow
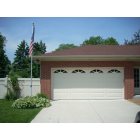
Mount Prospect: Sharon Harding sold typical Mount Prospect, Illinois ranch home
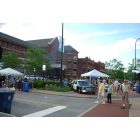
Mount Prospect: Down Town Mount Prospect
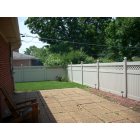
Mount Prospect: Sharon Harding sold typical Mount Prospect, Illinois ranch home
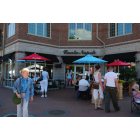
Mount Prospect: Down Town Mount Prospect
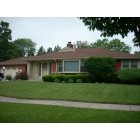
Mount Prospect: Sharon Harding sold typical Mount Prospect, Illinois ranch home

Mount Prospect: early Morning Golf-Mt. prospect Park Dist
- add
your
Submit your own pictures of this village and show them to the world
- OSM Map
- General Map
- Google Map
- MSN Map
Population change since 2000: -2.5%
 |
| Males: 27,383 | |
| Females: 27,460 |
| Median resident age: | 41.9 years |
| Illinois median age: | 39.1 years |
Zip codes: 60056.
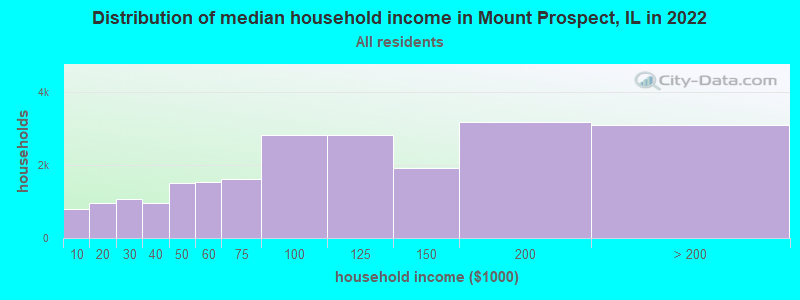
| Mount Prospect: | $98,380 |
| IL: | $76,708 |
Estimated per capita income in 2022: $47,543 (it was $26,464 in 2000)
Mount Prospect village income, earnings, and wages data
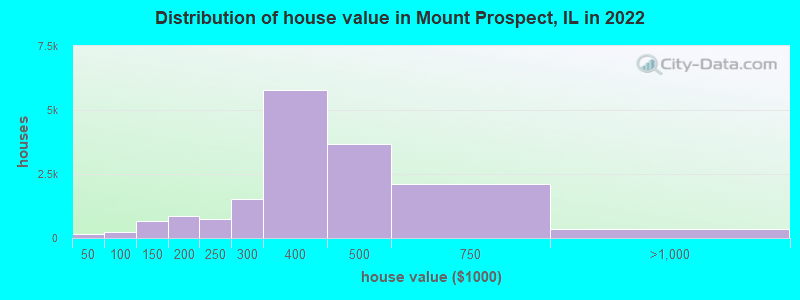
Estimated median house or condo value in 2022: $377,545 (it was $204,700 in 2000)
| Mount Prospect: | $377,545 |
| IL: | $251,600 |
Mean prices in 2022: all housing units: $427,165; detached houses: $469,763; townhouses or other attached units: $258,980; in 2-unit structures: $449,996; in 3-to-4-unit structures: $295,740; in 5-or-more-unit structures: $249,591
Median gross rent in 2022: $1,361.
Mount Prospect, IL residents, houses, and apartments details
(3.8% for White Non-Hispanic residents, 12.8% for Black residents, 7.6% for Hispanic or Latino residents, 5.8% for American Indian residents, 100.0% for Native Hawaiian and other Pacific Islander residents, 10.2% for other race residents, 3.6% for two or more races residents)
Detailed information about poverty and poor residents in Mount Prospect, IL


Compare current foreclosures in Mount Prospect, IL:
| Photo | Address | Area | Beds / Baths | Price | Details |
|---|---|---|---|---|---|

|
#1
S Elmhurst Rd
Mount Prospect, IL 60056
|
1,340 sq. feet
|
2 baths 3 beds |
show details | |

|
#2
N Sauk Ln
Mount Prospect, IL 60056
|
1,291 sq. feet
|
1 baths 3 beds |
show details | |

|
#3
N Lancaster St
Mount Prospect, IL 60056
|
1,521 sq. feet
|
1 baths 4 beds |
show details | |

|
#4
W Pickwick Ct
Mount Prospect, IL 60056
|
5,774 sq. feet
|
6 baths - beds |
show details | |

|
#5
W Busse Ave
Mount Prospect, IL 60056
|
1,433 sq. feet
|
2 baths - beds |
show details | |

|
#6
W Golf Rd
Mount Prospect, IL 60056
|
2,868 sq. feet
|
2 baths - beds |
show details | |

|
#7
N Lee St
Mount Prospect, IL 60056
|
1,930 sq. feet
|
1 baths - beds |
show details | |

|
#8
W Martha Ln
Mount Prospect, IL 60056
|
1,107 sq. feet
|
1 baths - beds |
show details | |

|
#9
N Fairview Ave
Mount Prospect, IL 60056
|
1,083 sq. feet
|
1 baths - beds |
show details | |

|
#10
N Elm St
Mount Prospect, IL 60056
|
1,161 sq. feet
|
1 baths - beds |
show details |
| Photo | Address | Area | Beds / Baths | Price | Details |
|---|---|---|---|---|---|

|
#11
N Wheeling Rd
Mount Prospect, IL 60056
|
1,169 sq. feet
|
1 baths - beds |
show details | |

|
#12
N Burning Bush Ln
Mount Prospect, IL 60056
|
1,410 sq. feet
|
1 baths - beds |
show details | |

|
#13
N Lancaster St
Mount Prospect, IL 60056
|
1,096 sq. feet
|
1 baths - beds |
show details | |

|
#14
N Kenilworth Ave
Mount Prospect, IL 60056
|
1,062 sq. feet
|
1 baths - beds |
show details | |

|
#15
N Hemlock Ln
Mount Prospect, IL 60056
|
1,557 sq. feet
|
2 baths - beds |
show details | |

|
#16
N Russel St
Mount Prospect, IL 60056
|
1,330 sq. feet
|
1 baths - beds |
show details | |

|
#17
S Church Rd
Mount Prospect, IL 60056
|
2,332 sq. feet
|
2 baths - beds |
show details | |

|
#18
S Albert St
Mount Prospect, IL 60056
|
1,778 sq. feet
|
1 baths - beds |
show details | |

|
#19
N Fairview Ave
Mount Prospect, IL 60056
|
1,312 sq. feet
|
1 baths - beds |
show details | |

|
#20
S Busse Rd
Mount Prospect, IL 60056
|
1,958 sq. feet
|
2 baths - beds |
show details |
| Photo | Address | Area | Beds / Baths | Price | Details |
|---|---|---|---|---|---|

|
#21
N Main St Apt 2ne
Mount Prospect, IL 60056
|
- sq. feet
|
- baths - beds |
show details | |

|
#22
S Busse Rd Apt 2m
Mount Prospect, IL 60056
|
- sq. feet
|
- baths - beds |
show details | |

|
#23
W Golf Rd Apt 173
Mount Prospect, IL 60056
|
- sq. feet
|
- baths - beds |
show details | |

|
#24
W Huntington Commons Rd Apt 303
Mount Prospect, IL 60056
|
- sq. feet
|
- baths - beds |
show details | |

|
#25
E Ardyce Ln Apt 507
Mount Prospect, IL 60056
|
- sq. feet
|
- baths - beds |
show details | |

|
#26
W Algonquin Rd Apt 12b
Mount Prospect, IL 60056
|
- sq. feet
|
- baths - beds |
show details | |

|
#27
Dempster St Apt A1-105
Mount Prospect, IL 60056
|
- sq. feet
|
- baths - beds |
show details | |

|
#28
S Lexington Dr Apt 210
Mount Prospect, IL 60056
|
- sq. feet
|
- baths - beds |
show details | |

|
#29
W Huntington Commons Rd Apt 359
Mount Prospect, IL 60056
|
- sq. feet
|
- baths - beds |
show details | |

|
#30
E Seminole Ln
Mount Prospect, IL 60056
|
- sq. feet
|
- baths - beds |
show details |
| Photo | Address | Area | Beds / Baths | Price | Details |
|---|---|---|---|---|---|

|
#31
W Hatherleigh Ct Apt 2d
Mount Prospect, IL 60056
|
- sq. feet
|
- baths - beds |
show details | |

|
#32
S Lexington Dr
Mount Prospect, IL 60056
|
- sq. feet
|
- baths - beds |
show details | |

|
#33
E Mulberry Ln
Mount Prospect, IL 60056
|
- sq. feet
|
- baths - beds |
show details | |

|
#34
S Pine St Apt 306
Mount Prospect, IL 60056
|
- sq. feet
|
- baths - beds |
show details | |

|
#35
W Algonquin Rd Apt 3a
Mount Prospect, IL 60056
|
- sq. feet
|
- baths - beds |
show details | |

|
#36
W Parliament Pl Apt 218
Mount Prospect, IL 60056
|
- sq. feet
|
- baths - beds |
show details | |

|
#37
Dempster St Apt 209
Mount Prospect, IL 60056
|
- sq. feet
|
- baths - beds |
show details | |

|
#38
W Algonquin Rd Apt 5b
Mount Prospect, IL 60056
|
- sq. feet
|
- baths - beds |
show details | |

|
#39
E Kensington Rd Apt C
Mount Prospect, IL 60056
|
- sq. feet
|
- baths - beds |
show details | |

|
#40
Dempster St # Cg7
Mount Prospect, IL 60056
|
- sq. feet
|
- baths - beds |
show details |
| Photo | Address | Area | Beds / Baths | Price | Details |
|---|---|---|---|---|---|

|
#41
S Hunt Club Dr
Mount Prospect, IL 60056
|
- sq. feet
|
- baths - beds |
show details | |

|
#42
S Cannon Dr Apt 102
Mount Prospect, IL 60056
|
- sq. feet
|
- baths - beds |
show details | |

|
#43
W Cottonwood Ln Apt 2k
Mount Prospect, IL 60056
|
- sq. feet
|
- baths - beds |
show details | |

|
#44
S Elmhurst Rd
Mount Prospect, IL 60056
|
- sq. feet
|
- baths - beds |
show details | |

|
#45
W Huntington Commons Rd Apt 2a
Mount Prospect, IL 60056
|
- sq. feet
|
- baths - beds |
show details | |

|
#46
W Huntington Commons Rd Apt 405
Mount Prospect, IL 60056
|
- sq. feet
|
- baths - beds |
show details | |

|
#47
W Prospect Ave Apt 202
Mount Prospect, IL 60056
|
- sq. feet
|
- baths - beds |
show details | |

|
#48
Dempster St # 203
Mount Prospect, IL 60056
|
- sq. feet
|
- baths - beds |
show details | |

|
#49
W Crystal Ln
Mount Prospect, IL 60056
|
- sq. feet
|
- baths - beds |
show details | |

|
Check over 1 million property listings on Foreclosure.com!
|
browse all offers | |||


- 34,56962.9%White alone
- 8,91716.2%Hispanic
- 7,89214.4%Asian alone
- 1,8933.4%Two or more races
- 1,5192.8%Black alone
- 1960.4%Other race alone
- 1000.2%American Indian alone
- 170.03%Native Hawaiian and Other
Pacific Islander alone
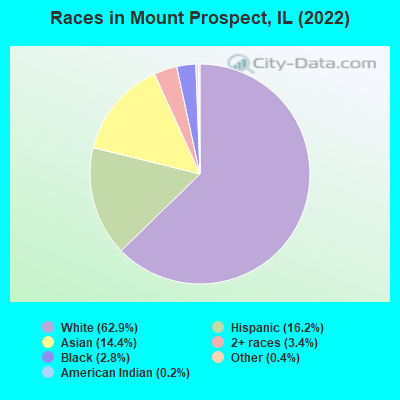
Races in Mount Prospect detailed stats: ancestries, foreign born residents, place of birth
According to our research of Illinois and other state lists, there were 17 registered sex offenders living in Mount Prospect, Illinois as of April 24, 2024.
The ratio of all residents to sex offenders in Mount Prospect is 3,194 to 1.
The ratio of registered sex offenders to all residents in this city is much lower than the state average.
The City-Data.com crime index weighs serious crimes and violent crimes more heavily. Higher means more crime, U.S. average is 246.1. It adjusts for the number of visitors and daily workers commuting into cities.
- means the value is smaller than the state average.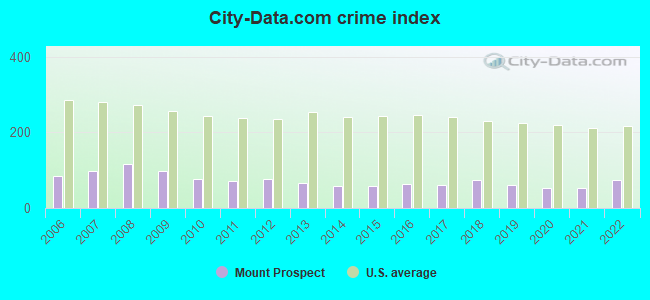
Crime rate in Mount Prospect detailed stats: murders, rapes, robberies, assaults, burglaries, thefts, arson
Full-time law enforcement employees in 2021, including police officers: 102 (81 officers - 68 male; 13 female).
| Officers per 1,000 residents here: | 1.52 |
| Illinois average: | 2.84 |
 Recent articles from our blog. Our writers, many of them Ph.D. graduates or candidates, create easy-to-read articles on a wide variety of topics.

 | Buffalo Grove/Arlington Heights vs. Naperville (19 replies) |
| Young-ish Urban Family To Chicago from Raleigh (21 replies) |
| Mount Prospect vs Arlington Heights? (4 replies) |
| Need help narrowing down town with walkable core (8 replies) |
| Wheaton vs. Arlington Heights vs. Buffalo Grove-moving from East Coast Nj (24 replies) |
| Sad (254 replies) |
Latest news from Mount Prospect, IL collected exclusively by city-data.com from local newspapers, TV, and radio stations
Ancestries: Polish (15.8%), German (6.1%), Italian (5.2%), American (4.9%), Irish (3.3%), Bulgarian (3.0%).
Current Local Time: CST time zone
Incorporated on 05/04/1917
Elevation: 665 feet
Land area: 10.2 square miles.
Population density: 5,374 people per square mile (average).
16,767 residents are foreign born (12.0% Europe, 10.4% Asia, 7.2% Latin America).
| This village: | 30.5% |
| Illinois: | 14.1% |
Median real estate property taxes paid for housing units with mortgages in 2022: $7,943 (2.1%)
Median real estate property taxes paid for housing units with no mortgage in 2022: $7,735 (2.0%)
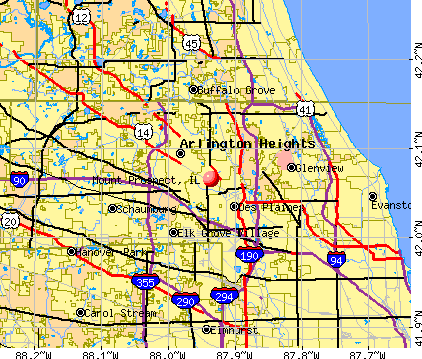
Nearest city with pop. 200,000+: Chicago, IL  (20.4 miles , pop. 2,896,016).
Nearest cities:
), )Latitude: 42.07 N, Longitude: 87.94 W
Daytime population change due to commuting: -5,583 (-10.2%)
Workers who live and work in this village: 6,975 (23.9%)
Mount Prospect tourist attractions:
Mount Prospect, Illinois accommodation & food services, waste management - Economy and Business Data
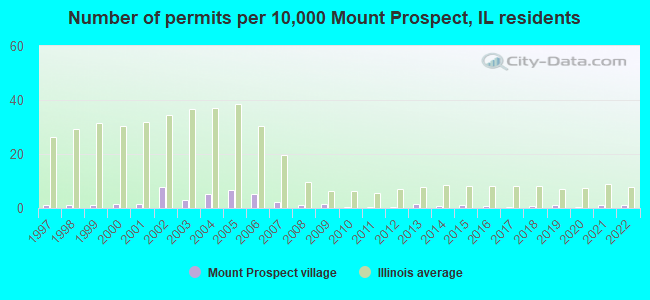
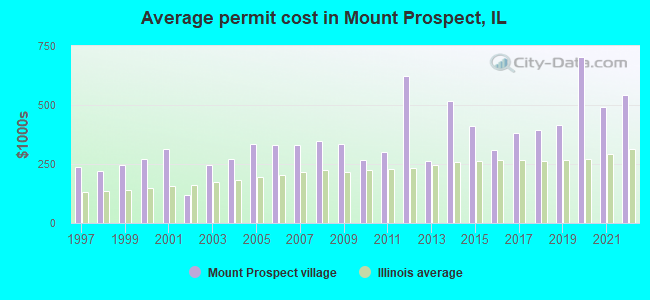
Single-family new house construction building permits:
- 2022: 7 buildings, average cost: $544,400
- 2021: 7 buildings, average cost: $491,200
- 2020: 3 buildings, average cost: $703,300
- 2019: 7 buildings, average cost: $414,600
- 2018: 4 buildings, average cost: $395,500
- 2017: 3 buildings, average cost: $383,300
- 2016: 5 buildings, average cost: $309,000
- 2015: 6 buildings, average cost: $408,600
- 2014: 5 buildings, average cost: $515,000
- 2013: 8 buildings, average cost: $262,500
- 2012: 2 buildings, average cost: $622,500
- 2011: 3 buildings, average cost: $299,100
- 2010: 3 buildings, average cost: $266,500
- 2009: 8 buildings, average cost: $336,000
- 2008: 6 buildings, average cost: $345,800
- 2007: 12 buildings, average cost: $328,600
- 2006: 30 buildings, average cost: $331,100
- 2005: 37 buildings, average cost: $335,300
- 2004: 29 buildings, average cost: $271,700
- 2003: 17 buildings, average cost: $246,300
- 2002: 43 buildings, average cost: $119,200
- 2001: 8 buildings, average cost: $315,000
- 2000: 8 buildings, average cost: $272,500
- 1999: 7 buildings, average cost: $246,700
- 1998: 6 buildings, average cost: $221,700
- 1997: 7 buildings, average cost: $237,100
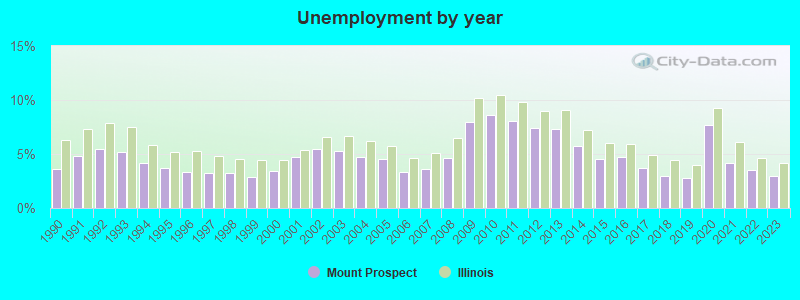
| Here: | 3.0% |
| Illinois: | 4.2% |
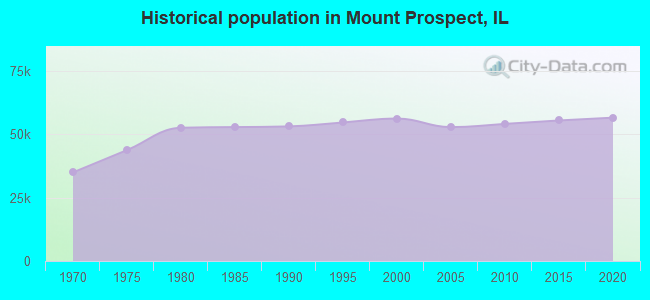

Population change in the 1990s: +3,247 (+6.1%).
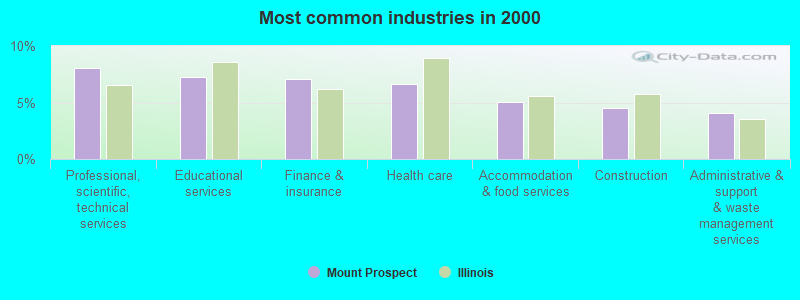
- Professional, scientific, technical services (8.1%)
- Educational services (7.2%)
- Finance & insurance (7.1%)
- Health care (6.6%)
- Accommodation & food services (5.1%)
- Construction (4.5%)
- Administrative & support & waste management services (4.1%)
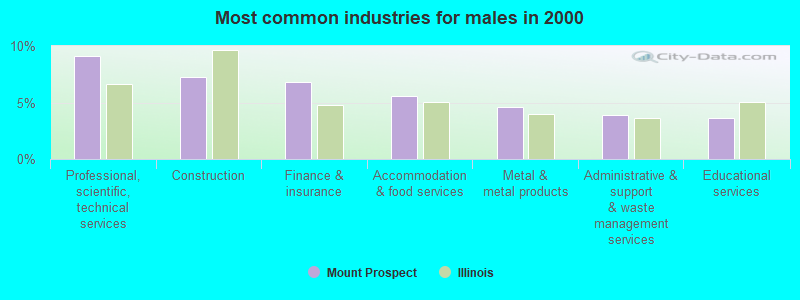
- Professional, scientific, technical services (9.2%)
- Construction (7.3%)
- Finance & insurance (6.8%)
- Accommodation & food services (5.6%)
- Metal & metal products (4.6%)
- Administrative & support & waste management services (3.9%)
- Educational services (3.6%)
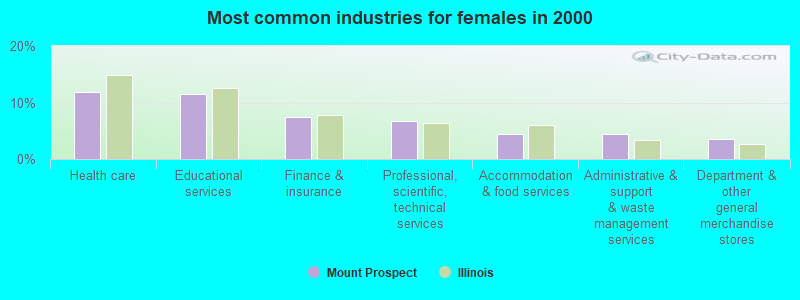
- Health care (11.9%)
- Educational services (11.6%)
- Finance & insurance (7.4%)
- Professional, scientific, technical services (6.8%)
- Accommodation & food services (4.4%)
- Administrative & support & waste management services (4.4%)
- Department & other general merchandise stores (3.5%)
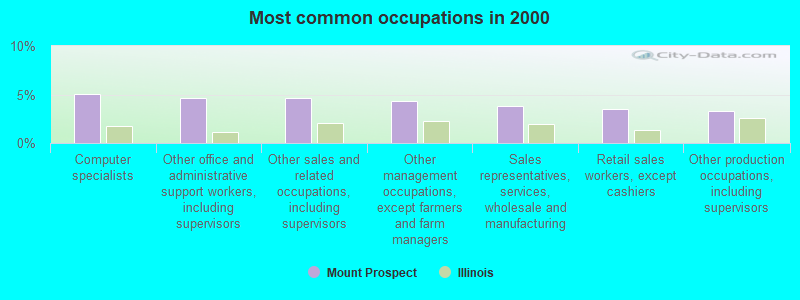
- Computer specialists (5.1%)
- Other office and administrative support workers, including supervisors (4.6%)
- Other sales and related occupations, including supervisors (4.6%)
- Other management occupations, except farmers and farm managers (4.3%)
- Sales representatives, services, wholesale and manufacturing (3.8%)
- Retail sales workers, except cashiers (3.5%)
- Other production occupations, including supervisors (3.3%)
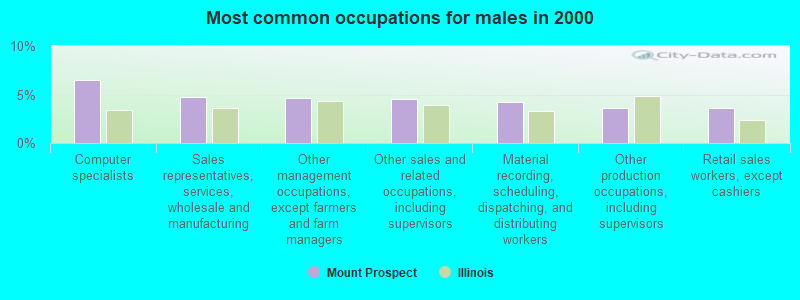
- Computer specialists (6.5%)
- Sales representatives, services, wholesale and manufacturing (4.8%)
- Other management occupations, except farmers and farm managers (4.7%)
- Other sales and related occupations, including supervisors (4.5%)
- Material recording, scheduling, dispatching, and distributing workers (4.2%)
- Other production occupations, including supervisors (3.7%)
- Retail sales workers, except cashiers (3.6%)
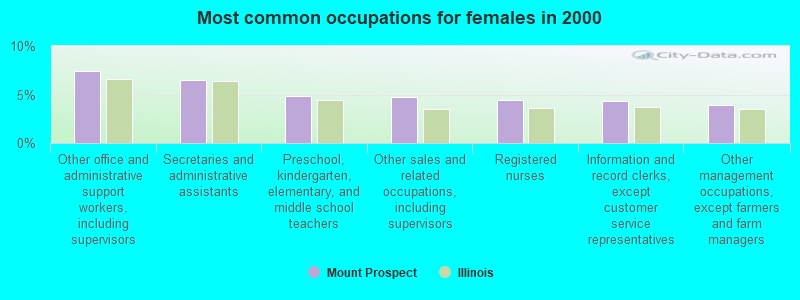
- Other office and administrative support workers, including supervisors (7.4%)
- Secretaries and administrative assistants (6.4%)
- Preschool, kindergarten, elementary, and middle school teachers (4.8%)
- Other sales and related occupations, including supervisors (4.7%)
- Registered nurses (4.4%)
- Information and record clerks, except customer service representatives (4.3%)
- Other management occupations, except farmers and farm managers (3.9%)
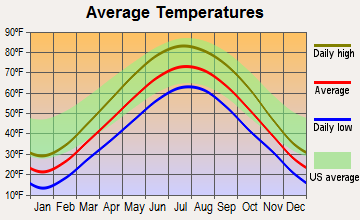
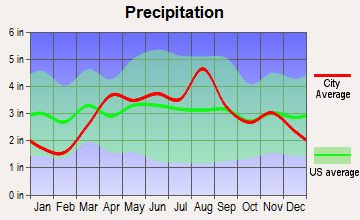
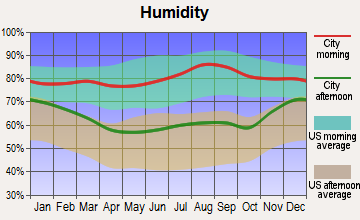
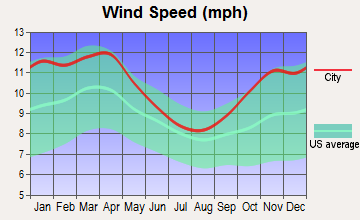
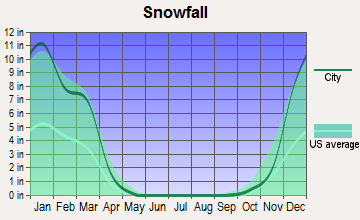
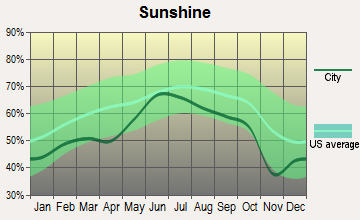
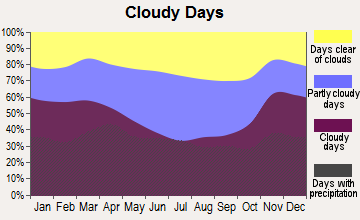
Average climate in Mount Prospect, Illinois
Based on data reported by over 4,000 weather stations
|
|


(lower is better)
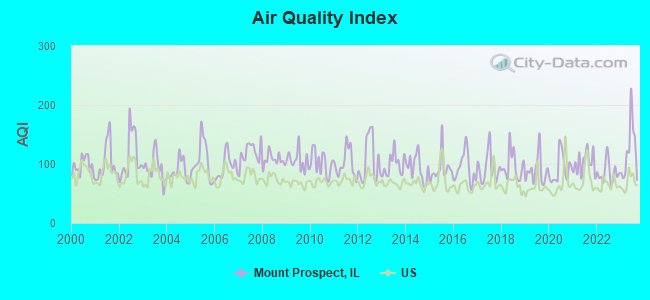
Air Quality Index (AQI) level in 2023 was 121. This is significantly worse than average.
| City: | 121 |
| U.S.: | 73 |
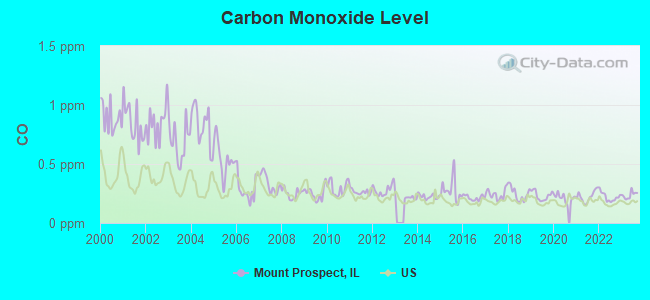
Carbon Monoxide (CO) [ppm] level in 2023 was 0.237. This is about average. Closest monitor was 5.6 miles away from the city center.
| City: | 0.237 |
| U.S.: | 0.251 |
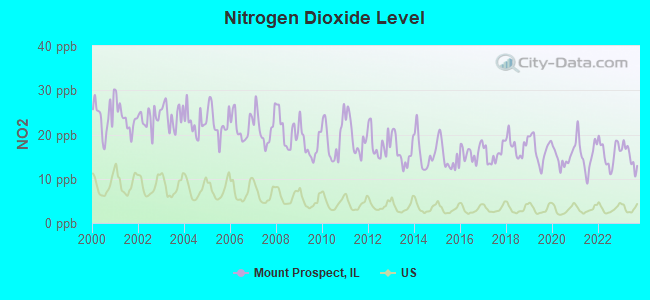
Nitrogen Dioxide (NO2) [ppb] level in 2023 was 15.1. This is significantly worse than average. Closest monitor was 2.7 miles away from the city center.
| City: | 15.1 |
| U.S.: | 5.1 |
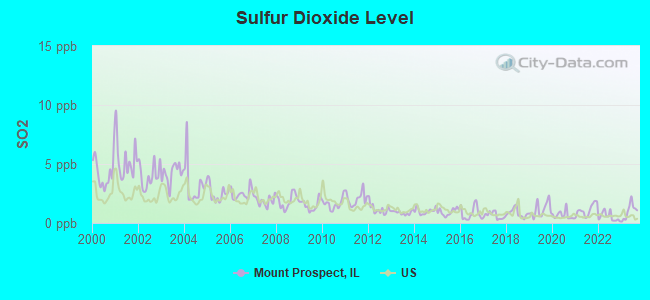
Sulfur Dioxide (SO2) [ppb] level in 2023 was 1.00. This is significantly better than average. Closest monitor was 2.7 miles away from the city center.
| City: | 1.00 |
| U.S.: | 1.51 |
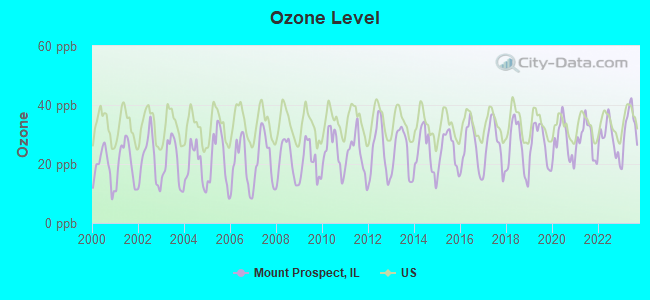
Ozone [ppb] level in 2023 was 32.6. This is about average. Closest monitor was 2.1 miles away from the city center.
| City: | 32.6 |
| U.S.: | 33.3 |
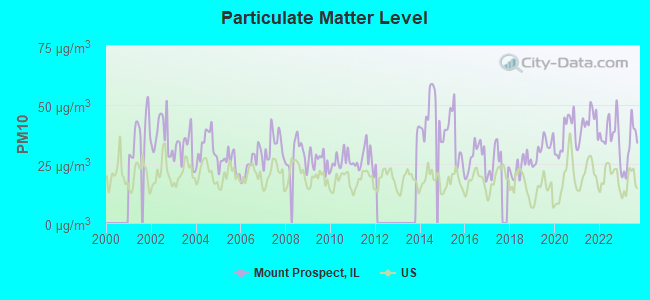
Particulate Matter (PM10) [µg/m3] level in 2023 was 31.4. This is significantly worse than average. Closest monitor was 2.7 miles away from the city center.
| City: | 31.4 |
| U.S.: | 19.2 |
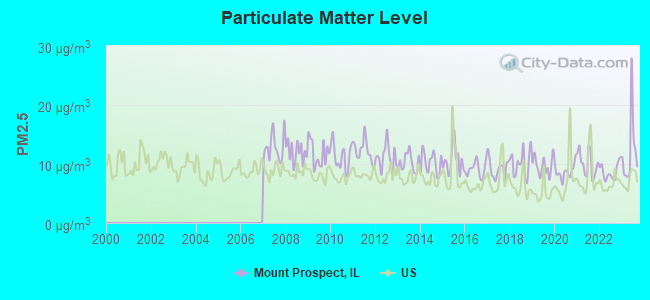
Particulate Matter (PM2.5) [µg/m3] level in 2023 was 12.1. This is significantly worse than average. Closest monitor was 3.0 miles away from the city center.
| City: | 12.1 |
| U.S.: | 8.1 |
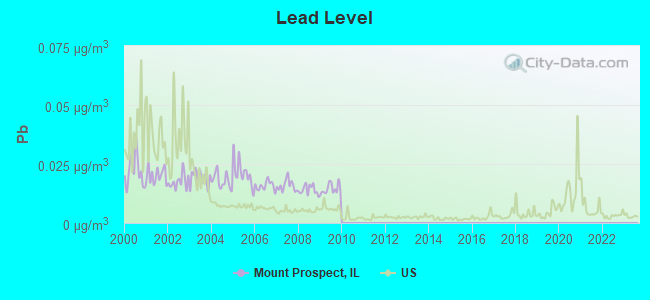
Lead (Pb) [µg/m3] level in 2009 was 0.0144. This is significantly worse than average. Closest monitor was 2.1 miles away from the city center.
| City: | 0.0144 |
| U.S.: | 0.0093 |
Tornado activity:
Mount Prospect-area historical tornado activity is slightly below Illinois state average. It is 38% greater than the overall U.S. average.
On 4/21/1967, a category F4 (max. wind speeds 207-260 mph) tornado 13.6 miles away from the Mount Prospect village center killed one person and injured 100 people and caused between $500,000 and $5,000,000 in damages.
On 9/28/1972, a category F4 tornado 15.2 miles away from the village center injured 20 people and caused between $500,000 and $5,000,000 in damages.
Earthquake activity:
Mount Prospect-area historical earthquake activity is significantly above Illinois state average. It is 36% greater than the overall U.S. average.On 4/18/2008 at 09:36:59, a magnitude 5.4 (5.1 MB, 4.8 MS, 5.4 MW, 5.2 MW, Class: Moderate, Intensity: VI - VII) earthquake occurred 249.9 miles away from the city center
On 6/10/1987 at 23:48:54, a magnitude 5.1 (4.9 MB, 4.4 MS, 4.6 MS, 5.1 LG) earthquake occurred 224.4 miles away from the city center
On 4/18/2008 at 09:36:59, a magnitude 5.2 (5.2 MW, Depth: 8.9 mi) earthquake occurred 250.0 miles away from Mount Prospect center
On 6/28/2004 at 06:10:52, a magnitude 4.2 (4.2 MW, Depth: 6.2 mi, Class: Light, Intensity: IV - V) earthquake occurred 65.0 miles away from Mount Prospect center
On 2/10/2010 at 09:59:35, a magnitude 3.8 (3.8 MW, Depth: 6.2 mi, Class: Light, Intensity: II - III) earthquake occurred 29.6 miles away from the city center
On 5/2/2015 at 16:23:07, a magnitude 4.2 (4.2 MW, Depth: 2.8 mi) earthquake occurred 129.1 miles away from Mount Prospect center
Magnitude types: regional Lg-wave magnitude (LG), body-wave magnitude (MB), surface-wave magnitude (MS), moment magnitude (MW)
Natural disasters:
The number of natural disasters in Cook County (20) is greater than the US average (15).Major Disasters (Presidential) Declared: 15
Emergencies Declared: 4
Causes of natural disasters: Floods: 13, Storms: 12, Tornadoes: 3, Snowstorms: 2, Winter Storms: 2, Blizzard: 1, Hurricane: 1, Snow: 1, Wind: 1, Other: 1 (Note: some incidents may be assigned to more than one category).

Main business address for: ISCO INTERNATIONAL INC (INSTRUMENTS FOR MEAS & TESTING OF ELECTRICITY & ELEC SIGNALS).
Hospitals and medical centers in Mount Prospect:
- GENTLE PRO HOSPICE SERVICES INC (1699 WALL STREET SUITE 425)
- CORAM ALTERNATE SITE SERVICES INC (1471 BUSINESS CENTER DR, SUITE 500)
- CORE HOMEHEALTH PROFESSIONALS, LLC (1100 WEST NORTHWEST HIGHWAY, SUUITE 101)
- EXPRESS PROF HOME HEALTH SERV INC (1699 WALL STREET, SUITE 104)
- GENTLEPRO HOME HEALTH CARE (1699 WALL ST. SUITE 120)
- IDEAL CARE HOME HEALTH, INC (800 E NORTHWEST HWY, STE 107)
- PRIMARY CARE HOME HEALTH CARE, INC (431 LAKEVIEW COURT, SUITE 3)
- SYNERGY HOME HEALTHCARE, INC (411 BUSINESS CENTER DRIVE, STE 106)
- VISION HOME HEALTH CARE, INC (500 W CENTRAL AVE, STE 200)
Amtrak stations near Mount Prospect:
- 7 miles: GLENVIEW (1116 DEPOT ST.) . Services: ticket office, fully wheelchair accessible, enclosed waiting area, public restrooms, public payphones, free short-term parking, free long-term parking, call for car rental service, taxi stand, public transit connection.
- 18 miles: LA GRANGE ROAD (LA GRANGE, 25 W. BURLINGTON AVE.) . Services: enclosed waiting area, public payphones, taxi stand, public transit connection.
- 20 miles: SUMMIT (ARCHER & CENTER AVE.) . Services: public payphones, free short-term parking, free long-term parking, call for taxi service, public transit connection.
College/University in Mount Prospect:
Colleges/universities with over 2000 students nearest to Mount Prospect:
- Oakton Community College (about 3 miles; Des Plaines, IL; Full-time enrollment: 7,271)
- American InterContinental University-Online (about 6 miles; Schaumburg, IL; FT enrollment: 16,158)
- Harper College (about 7 miles; Palatine, IL; FT enrollment: 10,800)
- Computer Systems Institute (about 10 miles; Skokie, IL; FT enrollment: 2,311)
- Chamberlain College of Nursing-Illinois (about 10 miles; Addison, IL; FT enrollment: 8,977)
- City Colleges of Chicago-Wilbur Wright College (about 11 miles; Chicago, IL; FT enrollment: 8,683)
- Triton College (about 12 miles; River Grove, IL; FT enrollment: 8,817)
Public high school in Mount Prospect:
- PROSPECT HIGH SCHOOL (Students: 2,087, Location: 801 W KENSINGTON RD, Grades: 9-12)
Biggest public elementary/middle schools in Mount Prospect:
- ROBERT FROST ELEM SCHOOL (Students: 583, Location: 1308 S CYPRESS DR, Grades: PK-5)
- ROBERT FROST ELEM SCHOOL (Students: 583, Location: 1805 N ASPEN DR, Grades: KG-5)
- LIONS PARK ELEM SCHOOL (Students: 562, Location: 300 E COUNCIL TRL, Grades: 2-5)
- EUCLID ELEM SCHOOL (Students: 552, Location: 1211 N WHEELING RD, Grades: KG-5)
- RIVER TRAILS MIDDLE SCHOOL (Students: 544, Location: 1000 N WOLF RD, Grades: 6-8)
- INDIAN GROVE ELEM SCHOOL (Students: 466, Location: 1340 N BURNING BUSH LN, Grades: PK-5)
- HOLMES JR HIGH SCHOOL (Students: 439, Location: 1900 W LONNQUIST BLVD, Grades: 6-8)
- FOREST VIEW ELEM SCHOOL (Students: 367, Location: 1901 W ESTATES DR, Grades: PK-5)
- JOHN JAY ELEM SCHOOL (Students: 342, Location: 1835 W PHEASANT TRL, Grades: PK-5)
- WESTBROOK EARLY LEARNING CNTR (Students: 240, Location: 103 S BUSSE RD, Grades: PK-1)
Library in Mount Prospect:
- MOUNT PROSPECT PUBLIC LIBRARY (Operating income: $7,562,844; Location: 10 SOUTH EMERSON STREET; 371,679 books; 974 e-books; 25,137 audio materials; 24,174 video materials; 25 local licensed databases; 17 state licensed databases; 1 other licensed databases; 692 print serial subscriptions; 1 electronic serial subscriptions)
User-submitted facts and corrections:
- WRXT 93.1 is a radio station listened to by residents of Mt.Prospect
Points of interest:
Notable locations in Mount Prospect: Mount Prospect Golf Course (A), Mount Prospect Country Club (B), Old Orchard Country Club (C), Mount Prospect Public Library (D), The Moorings Retirement Center (E), Elk Grove Rural Fire Protection District (F), Mount Prospect Village Hall (G), Mount Prospect Fire Department Station 14 (H), Mount Prospect Fire Department Station 13 (I), Mount Prospect Fire Department Station 12 (J). Display/hide their locations on the map
Shopping Centers: Randhurst Mall Shopping Center (1), Brentwood Square Shopping Center (2), Briarwood Plaza Shopping Center (3), Colony Square Shopping Center (4), Countryside Court Shopping Center (5), Crystal Court Shopping Center (6), Euclid Mall Shopping Center (7), Golf Plaza II Shopping Center (8), Golf Shopping Plaza Shopping Center (9). Display/hide their locations on the map
Main business address in Mount Prospect: ISCO INTERNATIONAL INC (A). Display/hide its location on the map
Churches in Mount Prospect include: Cumberland Baptist Church (A), Gloria Dei Presbyterian Church (B), Grace Evangelical Lutheran Church (C), Lutheran Church of Martha and Mary (D), Mount Prospect Bible Church (E), Peace Reformed Church (F), Saint Emily Catholic Church (G), Saint John's Episcopal Church (H), Saint Mark Lutheran Church (I). Display/hide their locations on the map
Cemetery: Saint Pauls Evangelical Lutheran Cemetery (1). Display/hide its location on the map
Parks in Mount Prospect include: Owen Park (1), Melas Park (2), Kopp Park (3), Aspen Trails Park (4), Busse Park (5), East Wedgewood Park (6), Frost Park (7), Hill Street Park (8), Maple Trails Park (9). Display/hide their locations on the map
Hotel: Country Inn-Suites OHare NW (2200 South Elmhurst Street).
Birthplace of: Lee DeWyze - Singer, Brian Gregory - Basketball coache, Ian Brennan (writer) - Television writer, Jeff Bzdelik - Basketball player-coach, George Bork - Football player, Sue Price - Actor.
| This village: | 2.6 people |
| Illinois: | 2.6 people |
| This village: | 70.7% |
| Whole state: | 65.8% |
| This village: | 4.0% |
| Whole state: | 6.3% |
Likely homosexual households (counted as self-reported same-sex unmarried-partner households)
- Lesbian couples: 0.3% of all households
- Gay men: 0.2% of all households
People in group quarters in Mount Prospect in 2010:
- 72 people in emergency and transitional shelters (with sleeping facilities) for people experiencing homelessness
- 26 people in college/university student housing
- 13 people in group homes intended for adults
- 10 people in other noninstitutional facilities
People in group quarters in Mount Prospect in 2000:
- 20 people in other noninstitutional group quarters
- 17 people in college dormitories (includes college quarters off campus)
- 12 people in homes for the mentally retarded
- 12 people in religious group quarters
- 5 people in mental (psychiatric) hospitals or wards
Banks with most branches in Mount Prospect (2011 data):
- JPMorgan Chase Bank, National Association: Randhurst, Rand & Central Banking Center Branch, Mt. Prospect Countryside, Mt. Prospect - Busse Branch. Info updated 2011/11/10: Bank assets: $1,811,678.0 mil, Deposits: $1,190,738.0 mil, headquarters in Columbus, OH, positive income, International Specialization, 5577 total offices, Holding Company: Jpmorgan Chase & Co.
- Parkway Bank and Trust Company: Mount Prospect North Branch at 700 East Rand Road, branch established on 1997/05/01; Mount Prospect South Branch at 1590 South Elmhurst Road, branch established on 2005/10/03. Info updated 2011/06/03: Bank assets: $2,237.7 mil, Deposits: $1,906.2 mil, headquarters in Harwood Heights, IL, positive income, Commercial Lending Specialization, 33 total offices, Holding Company: Parkway Bancorp, Inc.
- Bank of America, National Association: Randhurst Branch at 200 East Kensington Road, branch established on 1922/01/01; Mt. Prospect/Golf Plaza at 1080 South Elmhurst Road, branch established on 1988/06/30. Info updated 2009/11/18: Bank assets: $1,451,969.3 mil, Deposits: $1,077,176.8 mil, headquarters in Charlotte, NC, positive income, 5782 total offices, Holding Company: Bank Of America Corporation
- Firstmerit Bank, National Association: Mount Prospect Branch at 50 North Main Street, branch established on 1997/09/15; Mount Prospect Branch at 2100 South Elmhurst Road, branch established on 1990/01/02. Info updated 2010/05/17: Bank assets: $14,420.6 mil, Deposits: $11,497.6 mil, headquarters in Akron, OH, positive income, Commercial Lending Specialization, 213 total offices, Holding Company: Firstmerit Corporation
- PNC Bank, National Association: Mt Prospect Branch at 935 North Elmhurst Road, branch established on 2010/11/01; Mount Prospect-Algonquin & 83 at 1800 South Elmhurst Road, branch established on 2011/08/29. Info updated 2012/03/20: Bank assets: $263,309.6 mil, Deposits: $197,343.0 mil, headquarters in Wilmington, DE, positive income, Commercial Lending Specialization, 3085 total offices, Holding Company: Pnc Financial Services Group, Inc., The
- MB Financial Bank, National Association: Mount Prospect Branch at 15 East Prospect Avenue, branch established on 1957/09/09. Info updated 2010/04/27: Bank assets: $9,792.4 mil, Deposits: $7,757.4 mil, headquarters in Chicago, IL, positive income, Commercial Lending Specialization, 93 total offices, Holding Company: Mb Financial, Inc
- U.S. Bank National Association: Mount Prospect Dominick's Branch at 1042 South Elmhurst Road, branch established on 2007/11/19. Info updated 2012/01/30: Bank assets: $330,470.8 mil, Deposits: $236,091.5 mil, headquarters in Cincinnati, OH, positive income, 3121 total offices, Holding Company: U.S. Bancorp
- BMO Harris Bank National Association: Mount Prospect Elmhurst Road Branch at 1450 Elmhurst Road, branch established on 2005/04/11. Info updated 2011/07/14: Bank assets: $97,264.0 mil, Deposits: $75,624.6 mil, headquarters in Chicago, IL, positive income, 717 total offices, Holding Company: Bank Of Montreal
- Glenview State Bank: Mount Prospect Branch at 20 East Northwest Highway, branch established on 2010/02/15. Info updated 2006/11/03: Bank assets: $1,170.7 mil, Deposits: $1,008.1 mil, headquarters in Glenview, IL, positive income, 8 total offices, Holding Company: Cummins-American Corp.
- 5 other banks with 5 local branches
For population 15 years and over in Mount Prospect:
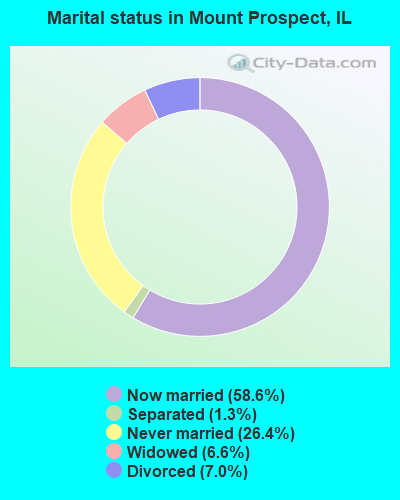
- Never married: 26.4%
- Now married: 58.6%
- Separated: 1.3%
- Widowed: 6.6%
- Divorced: 7.0%
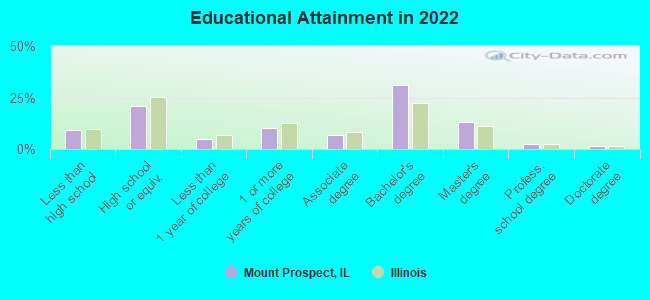
For population 25 years and over in Mount Prospect:
- High school or higher: 91.0%
- Bachelor's degree or higher: 47.1%
- Graduate or professional degree: 16.6%
- Unemployed: 3.5%
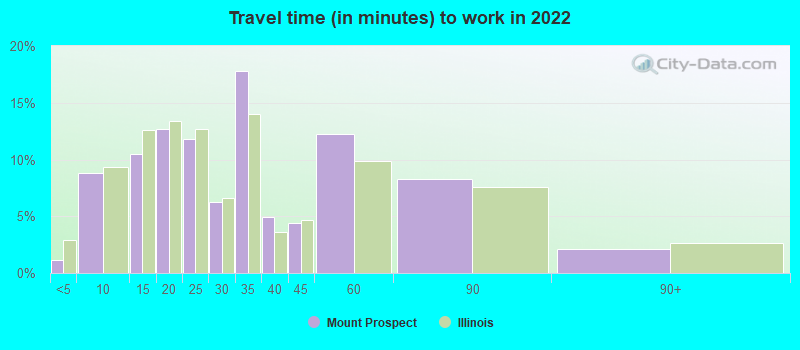
- Mean travel time to work (commute): 22.7 minutes
| Here: | 13.3 |
| Illinois average: | 12.5 |


Graphs represent county-level data. Detailed 2008 Election Results
Political contributions by individuals in Mount Prospect, IL
Neighborhoods in Mount Prospect:
(Mount Prospect, Illinois Neighborhood Map)Religion statistics for Mount Prospect, IL (based on Cook County data)


| Religion | Adherents | Congregations |
|---|---|---|
| Catholic | 1,947,223 | 376 |
| Evangelical Protestant | 432,975 | 1,484 |
| Other | 312,636 | 403 |
| Mainline Protestant | 202,114 | 630 |
| Black Protestant | 148,895 | 395 |
| Orthodox | 53,276 | 66 |
| None | 2,097,556 | - |
Food Environment Statistics:
| This county: | 2.77 / 10,000 pop. |
| Illinois: | 2.24 / 10,000 pop. |
| This county: | 0.04 / 10,000 pop. |
| Illinois: | 0.08 / 10,000 pop. |
| Cook County: | 0.93 / 10,000 pop. |
| State: | 0.75 / 10,000 pop. |
| Here: | 1.53 / 10,000 pop. |
| Illinois: | 2.61 / 10,000 pop. |
| Here: | 6.67 / 10,000 pop. |
| Illinois: | 6.86 / 10,000 pop. |
| Here: | 8.4% |
| Illinois: | 8.3% |
| Here: | 23.5% |
| Illinois: | 25.2% |
| Cook County: | 16.3% |
| Illinois: | 14.5% |
Health and Nutrition:
| Mount Prospect: | 50.9% |
| Illinois: | 49.5% |
| Here: | 47.9% |
| Illinois: | 47.2% |
| Mount Prospect: | 28.0 |
| Illinois: | 28.6 |
| Here: | 20.0% |
| State: | 20.5% |
| Here: | 11.2% |
| Illinois: | 10.8% |
| Mount Prospect: | 6.9 |
| Illinois: | 6.8 |
| This city: | 32.0% |
| Illinois: | 33.4% |
| This city: | 56.8% |
| Illinois: | 56.4% |
| This city: | 78.9% |
| Illinois: | 79.9% |
More about Health and Nutrition of Mount Prospect, IL Residents
| Local government employment and payroll (March 2022) | |||||
| Function | Full-time employees | Monthly full-time payroll | Average yearly full-time wage | Part-time employees | Monthly part-time payroll |
|---|---|---|---|---|---|
| Police Protection - Officers | 80 | $768,297 | $115,245 | 0 | $0 |
| Local Libraries | 76 | $381,063 | $60,168 | 73 | $93,512 |
| Firefighters | 75 | $731,638 | $117,062 | 10 | $903 |
| Other and Unallocable | 23 | $199,527 | $104,101 | 4 | $14,043 |
| Police - Other | 22 | $149,081 | $81,317 | 3 | $4,207 |
| Health | 16 | $114,492 | $85,869 | 0 | $0 |
| Financial Administration | 14 | $108,434 | $92,943 | 4 | $10,141 |
| Streets and Highways | 14 | $127,419 | $109,216 | 2 | $3,245 |
| Natural Resources | 11 | $91,311 | $99,612 | 0 | $0 |
| Other Government Administration | 10 | $96,767 | $116,120 | 8 | $6,674 |
| Water Supply | 10 | $88,005 | $105,606 | 0 | $0 |
| Welfare | 9 | $58,377 | $77,836 | 0 | $0 |
| Fire - Other | 7 | $71,358 | $122,328 | 0 | $0 |
| Housing and Community Development (Local) | 4 | $37,227 | $111,681 | 1 | $1,495 |
| Sewerage | 4 | $33,923 | $101,769 | 0 | $0 |
| Totals for Government | 375 | $3,056,917 | $97,821 | 105 | $134,220 |
Mount Prospect government finances - Expenditure in 2021 (per resident):
- Construction - General - Other: $149,000 ($2.72)
- Current Operations - Police Protection: $19,160,000 ($349.36)
Local Fire Protection: $17,212,000 ($313.84)
Water Utilities: $16,536,000 ($301.52)
Regular Highways: $10,577,000 ($192.86)
Libraries: $8,750,000 ($159.55)
Central Staff Services: $5,349,000 ($97.53)
Health - Other: $4,793,000 ($87.39)
Financial Administration: $1,548,000 ($28.23)
Public Welfare - Other: $1,535,000 ($27.99)
General - Other: $1,405,000 ($25.62)
Solid Waste Management: $1,063,000 ($19.38)
Housing and Community Development: $290,000 ($5.29)
Parks and Recreation: $167,000 ($3.05)
- General - Interest on Debt: $5,643,000 ($102.89)
- Other Capital Outlay - Central Staff Services: $27,331,000 ($498.35)
General - Other: $1,990,000 ($36.29)
Libraries: $381,000 ($6.95)
- Total Salaries and Wages: $36,029,000 ($656.95)
Mount Prospect government finances - Revenue in 2021 (per resident):
- Charges - Solid Waste Management: $4,465,000 ($81.41)
Sewerage: $3,294,000 ($60.06)
Other: $2,347,000 ($42.79)
Parking Facilities: $104,000 ($1.90)
- Local Intergovernmental - Other: $4,468,000 ($81.47)
- Miscellaneous - General Revenue - Other: $2,136,000 ($38.95)
Interest Earnings: $483,000 ($8.81)
Fines and Forfeits: $242,000 ($4.41)
- Revenue - Water Utilities: $13,439,000 ($245.04)
- State Intergovernmental - General Local Government Support: $33,630,000 ($613.20)
Highways: $1,971,000 ($35.94)
Other: $53,000 ($0.97)
- Tax - Property: $31,442,000 ($573.31)
Other License: $3,817,000 ($69.60)
Public Utilities Sales: $3,025,000 ($55.16)
General Sales and Gross Receipts: $2,591,000 ($47.24)
Other Selective Sales: $2,292,000 ($41.79)
Mount Prospect government finances - Debt in 2021 (per resident):
- Long Term Debt - Beginning Outstanding - Unspecified Public Purpose: $227,424,000 ($4146.82)
Outstanding Unspecified Public Purpose: $206,073,000 ($3757.51)
Retired Unspecified Public Purpose: $30,813,000 ($561.84)
Issue, Unspecified Public Purpose: $9,462,000 ($172.53)
Mount Prospect government finances - Cash and Securities in 2021 (per resident):
- Other Funds - Cash and Securities: $79,315,000 ($1446.22)
3.53% of this county's 2021 resident taxpayers lived in other counties in 2020 ($82,405 average adjusted gross income)
| Here: | 3.53% |
| Illinois average: | 5.09% |
0.01% of residents moved from foreign countries ($114 average AGI)
Cook County: 0.01% Illinois average: 0.01%
Top counties from which taxpayers relocated into this county between 2020 and 2021:
| from DuPage County, IL | |
| from Lake County, IL | |
| from Will County, IL |
5.44% of this county's 2020 resident taxpayers moved to other counties in 2021 ($120,340 average adjusted gross income)
| Here: | 5.44% |
| Illinois average: | 6.10% |
0.01% of residents moved to foreign countries ($140 average AGI)
Cook County: 0.01% Illinois average: 0.01%
Top counties to which taxpayers relocated from this county between 2020 and 2021:
| to DuPage County, IL | |
| to Will County, IL | |
| to Lake County, IL |
| Businesses in Mount Prospect, IL | ||||
| Name | Count | Name | Count | |
|---|---|---|---|---|
| 7-Eleven | 2 | KFC | 1 | |
| Advance Auto Parts | 1 | LA Fitness | 1 | |
| Bally Total Fitness | 1 | Little Caesars Pizza | 1 | |
| Baskin-Robbins | 3 | McDonald's | 1 | |
| Bed Bath & Beyond | 1 | Nike | 1 | |
| Brunswick Bowling & Billiards | 1 | OfficeMax | 1 | |
| CVS | 1 | Old Navy | 1 | |
| Carson Pirie Scott | 1 | Payless | 1 | |
| Costco | 1 | Pizza Hut | 1 | |
| Discount Tire | 1 | Starbucks | 2 | |
| Dunkin Donuts | 3 | Steak 'n Shake | 1 | |
| FedEx | 7 | The Room Place | 1 | |
| GNC | 1 | True Value | 1 | |
| GameStop | 1 | U-Haul | 2 | |
| H&R Block | 1 | U.S. Cellular | 1 | |
| Home Depot | 1 | UPS | 7 | |
| Jewel-Osco | 1 | Volkswagen | 1 | |
| Just Tires | 1 | Wet Seal | 1 | |
Strongest AM radio stations in Mount Prospect:
- WGN (720 AM; 50 kW; CHICAGO, IL; Owner: WGN CONTINENTAL BROADCASTING CO.)
- WBBM (780 AM; 50 kW; CHICAGO, IL; Owner: INFINITY BROADCASTING OPERATIONS, INC.)
- WSCR (670 AM; 50 kW; CHICAGO, IL; Owner: INFINITY BROADCASTING OPERATIONS, INC.)
- WMVP (1000 AM; 50 kW; CHICAGO, IL; Owner: ABC, INC.)
- WKTA (1330 AM; 5 kW; EVANSTON, IL; Owner: POLNET COMMUNICATIONS, LTD.)
- WLS (890 AM; 50 kW; CHICAGO, IL; Owner: WLS, INC.)
- WMBI (1110 AM; daytime; 5 kW; CHICAGO, IL; Owner: THE MOODY BIBLE INSTITUTE OF CHICAGO)
- WTMJ (620 AM; 50 kW; MILWAUKEE, WI; Owner: JOURNAL BROADCAST CORPORATION)
- WYLL (1160 AM; 50 kW; CHICAGO, IL; Owner: SCA LICENSE CORPORATION)
- WCSN (820 AM; 5 kW; CHICAGO, IL; Owner: WYPA, INC.)
- WISN (1130 AM; 50 kW; MILWAUKEE, WI; Owner: CAPSTAR TX LIMITED PARTNERSHIP)
- WVIV (1200 AM; 20 kW; CHICAGO, IL; Owner: WLXX-AM LICENSE CORP.)
- WONX (1590 AM; 4 kW; EVANSTON, IL; Owner: KOVAS COMMUNICATIONS, INC.)
Strongest FM radio stations in Mount Prospect:
- WVIV-FM (103.1 FM; HIGHLAND PARK, IL; Owner: HBC LICENSE CORPORATION)
- WZFS (106.7 FM; DES PLAINES, IL; Owner: SALEM MEDIA OF ILLINOIS, LLC)
- WKIE (92.7 FM; ARLINGTON HEIGHTS, IL; Owner: SPANISH BROADCASTING SYSTEM OF ILLINOIS, INC.)
- WCKG (105.9 FM; ELMWOOD PARK, IL; Owner: INFINITY HOLDINGS CORPORATION OF ORLANDO)
- WLIT-FM (93.9 FM; CHICAGO, IL; Owner: AMFM RADIO LICENSES, L.L.C.)
- WJMK (104.3 FM; CHICAGO, IL; Owner: INFINITY BROADCASTING CORP. OF ILLINOIS)
- WGCI-FM (107.5 FM; CHICAGO, IL; Owner: AMFM RADIO LICENSES, L.L.C.)
- WNUA (95.5 FM; CHICAGO, IL; Owner: AMFM RADIO LICENSES, L.L.C.)
- WTMX (101.9 FM; SKOKIE, IL; Owner: BONNEVILLE HOLDING COMPANY)
- WBBM-FM (96.3 FM; CHICAGO, IL; Owner: INFINITY BROADCASTING OPERATIONS, INC.)
- WKSC-FM (103.5 FM; CHICAGO, IL; Owner: AMFM RADIO LICENSES, L.L.C.)
- WFMT (98.7 FM; CHICAGO, IL; Owner: WINDOW TO THE WORLD COMMUNICATIONS)
- WZZN (94.7 FM; CHICAGO, IL; Owner: ABC CHICAGO FM RADIO,INC.)
- WBEZ (91.5 FM; CHICAGO, IL; Owner: THE WBEZ ALLIANCE, INC.)
- WKQX (101.1 FM; CHICAGO, IL; Owner: EMMIS RADIO LICENSE CORPORATION)
- WLUP-FM (97.9 FM; CHICAGO, IL; Owner: BONNEVILLE HOLDING COMPANY)
- WNND (100.3 FM; CHICAGO, IL; Owner: BONNEVILLE HOLDING COMPANY)
- WOJO (105.1 FM; EVANSTON, IL; Owner: TICHENOR LICENSE CORPORATION ("TLC"))
- WUSN (99.5 FM; CHICAGO, IL; Owner: INFINITY BROADCASTING CORPORATION OF CHICAGO)
- WVAZ (102.7 FM; OAK PARK, IL; Owner: AMFM RADIO LICENSES, L.L.C.)
TV broadcast stations around Mount Prospect:
- W34CK (Channel 34; ARLINGTON HEIGHTS, IL; Owner: FIRST UNITED, INC.)
- WLS-TV (Channel 7; CHICAGO, IL; Owner: WLS TELEVISION, INC.)
- WMAQ-TV (Channel 5; CHICAGO, IL; Owner: NBC SUBSIDIARY (WMAQ-TV), INC.)
- WTTW (Channel 11; CHICAGO, IL; Owner: WINDOW TO THE WORLD COMMUNICATIONS, INC.)
- WGBO-TV (Channel 66; JOLIET, IL; Owner: WGBO LICENSE PARTNERSHIP, G.P.)
- WGN-TV (Channel 9; CHICAGO, IL; Owner: WGN CONTINENTAL BROADCASTING COMPANY)
- WBBM-TV (Channel 2; CHICAGO, IL; Owner: CBS BROADCASTING INC.)
- WPWR-TV (Channel 50; GARY, IN; Owner: FOX TELEVISION STATIONS, INC.)
- WXFT (Channel 60; AURORA, IL; Owner: TELEFUTURA CHICAGO LLC)
- WCIU-TV (Channel 26; CHICAGO, IL; Owner: WCIU-TV LIMITED PARTNERSHIP)
- WCPX (Channel 38; CHICAGO, IL; Owner: PAXSON CHICAGO LICENSE, INC.)
- WSNS-TV (Channel 44; CHICAGO, IL; Owner: TELEMUNDO OF CHICAGO, INC.)
- WFLD (Channel 32; CHICAGO, IL; Owner: FOX TELEVISION STATIONS, INC.)
- W68DO (Channel 68; PALATINE, IL; Owner: TRINITY BROADCASTING NETWORK)
- WFBT-CA (Channel 23; CHICAGO, IL; Owner: CHANNEL 23 LIMITED PARTNERSHIP)
- WJYS (Channel 62; HAMMOND, IN; Owner: JOVON BROADCASTING CORPORATION)
- W64CQ (Channel 64; ARLINGTON HEIGHTS, IL; Owner: TRINITY BROADCASTING NETWORK)
- WOCH-LP (Channel 28; CHICAGO, IL; Owner: KM LPTV OF CHICAGO-28, L.L.C.)
- WYCC (Channel 20; CHICAGO, IL; Owner: COLLEGE DIST. #508, COUNTY OF COOK)
- WOCK-CA (Channel 13; CHICAGO, IL; Owner: KM LPTV OF CHICAGO-13, L.L.C.)
- W57DN (Channel 57; ELGIN, IL; Owner: TRINITY BROADCASTING NETWORK)
- WYIN (Channel 56; GARY, IN; Owner: NORTHWEST INDIANA PUBLIC BROADCASTING, INC.)
- W24AJ (Channel 24; AURORA, IL; Owner: NELSON TV, INC.)
- National Bridge Inventory (NBI) Statistics
- 23Number of bridges
- 180ft / 54.9mTotal length
- 702,375Total average daily traffic
- 61,390Total average daily truck traffic
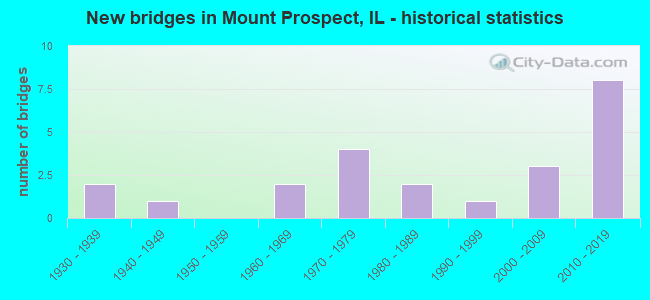
- New bridges - historical statistics
- 21930-1939
- 11940-1949
- 21960-1969
- 41970-1979
- 21980-1989
- 11990-1999
- 32000-2009
- 82010-2019
FCC Registered Antenna Towers:
66 (See the full list of FCC Registered Antenna Towers in Mount Prospect)FCC Registered Broadcast Land Mobile Towers:
15 (See the full list of FCC Registered Broadcast Land Mobile Towers in Mount Prospect, IL)FCC Registered Microwave Towers:
7- CM1, 900 Ardyce (Lat: 42.069417 Lon: -87.921361), Type: Building, Structure height: 20 m, Call Sign: WQIJ298,
Assigned Frequencies: 23025.0 MHz, 23125.0 MHz, 23175.0 MHz, 23075.0 MHz, Grant Date: 02/27/2018, Expiration Date: 02/26/2028, Certifier: Elizabeth Creekmore, Registrant: Bob, LLC Dba Business Only Broadband, 999 Oak Creek Dr, Lombard, IL 60148, Phone: (630) 590-6006, Email:
- WAL, 1084 Mt. Prospect Plaza (Lat: 42.068889 Lon: -87.918833), Type: Building, Structure height: 14 m, Call Sign: WQIJ365,
Assigned Frequencies: 21925.0 MHz, 21975.0 MHz, Grant Date: 02/26/2008, Expiration Date: 02/26/2018, Cancellation Date: 01/02/2018, Certifier: Elizabeth Creekmore, Registrant: Bob, LLC Dba Business Only Broadband, 999 Oak Creek Dr., Lombard, IL 60148, Phone: (630) 590-6009, Fax: (630) 986-2496, Email:
- EBC, 1331 Business Center Dr (Lat: 42.078472 Lon: -87.915667), Type: Building, Structure height: 17 m, Call Sign: WQIJ366,
Assigned Frequencies: 21825.0 MHz, 21875.0 MHz, Grant Date: 02/26/2008, Expiration Date: 02/26/2018, Cancellation Date: 01/02/2018, Certifier: Elizabeth Creekmore, Registrant: Bob, LLC Dba Business Only Broadband, 999 Oak Creek Dr., Lombard, IL 60148, Phone: (630) 590-6009, Fax: (630) 986-2496, Email:
- WATER TANK, 110 Northwest Hwy (Lat: 42.062444 Lon: -87.933528), Type: Tank, Structure height: 33 m, Overall height: 34 m, Call Sign: WQYU246,
Assigned Frequencies: 19380.0 MHz, 19380.0 MHz, 19380.0 MHz, 19380.0 MHz, 19380.0 MHz, 19380.0 MHz, 19380.0 MHz, 19380.0 MHz, 19380.0 MHz, 19380.0 MHz, 18060.0 MHz, Grant Date: 01/20/2017, Expiration Date: 01/20/2027, Certifier: Matt Overeem, Registrant: Village Of Mt Prospect, 50 S Emerson St, Mount Prospect, IL 60056, Phone: (847) 392-6000, Email:
- MTPROSPECTPW, 1700 W Central Road (Lat: 42.067333 Lon: -87.961056), Type: Ltower, Structure height: 31 m, Call Sign: WRKI455, Licensee ID: L02060978,
Assigned Frequencies: 17820.0 MHz, 17820.0 MHz, 17820.0 MHz, 17820.0 MHz, 17820.0 MHz, 17820.0 MHz, 17820.0 MHz, 17820.0 MHz, 17820.0 MHz, 17820.0 MHz, Grant Date: 01/08/2021, Expiration Date: 01/08/2031, Certifier: Andrew Schaeffer, Registrant: Village Of Mount Prospect, 50 S. Emerson Street, Mount Prospect, IL 60056, Phone: (847) 392-6000, Email:
- 1FD, 1600 Feehanville Dr (Lat: 42.077472 Lon: -87.911528), Type: Building, Structure height: 7 m, Overall height: 9 m, Call Sign: WRWU223, Licensee ID: L01166198,
Assigned Frequencies: 11585.0 MHz, 11585.0 MHz, 11585.0 MHz, 11585.0 MHz, 11585.0 MHz, Grant Date: 03/28/2023, Expiration Date: 03/28/2033, Certifier: Michael Higginbotham, Registrant: Business Only Broadband, LLC, 999 Oak Creek Drive, Lombard, IL 60148, Phone: (630) 590-6009, Email:
- MT PROSPECT, 2069 Busse Rd (Lat: 42.030861 Lon: -87.958111), Overall height: 47.5 m, Call Sign: WLM667,
Assigned Frequencies: 18630.0 MHz, Grant Date: 12/19/1994, Expiration Date: 02/01/2001, Cancellation Date: 07/19/1995, Registrant: Southwestern Bell Mobile Systems Inc, 17330 Preston Road Ste 100a, Dallas, TX 75252
FCC Registered Amateur Radio Licenses:
157 (See the full list of FCC Registered Amateur Radio Licenses in Mount Prospect)FAA Registered Aircraft:
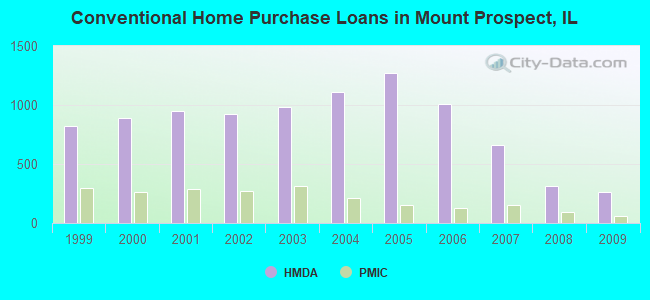
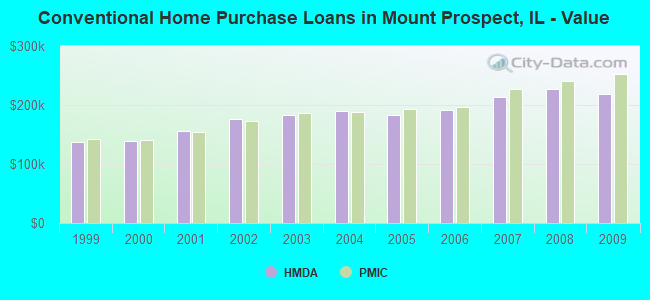
16 (See the full list of FAA Registered Aircraft in Mount Prospect)| Home Mortgage Disclosure Act Aggregated Statistics For Year 2009 (Based on 5 full and 11 partial tracts) | ||||||||||||||
| A) FHA, FSA/RHS & VA Home Purchase Loans | B) Conventional Home Purchase Loans | C) Refinancings | D) Home Improvement Loans | E) Loans on Dwellings For 5+ Families | F) Non-occupant Loans on < 5 Family Dwellings (A B C & D) | G) Loans On Manufactured Home Dwelling (A B C & D) | ||||||||
|---|---|---|---|---|---|---|---|---|---|---|---|---|---|---|
| Number | Average Value | Number | Average Value | Number | Average Value | Number | Average Value | Number | Average Value | Number | Average Value | Number | Average Value | |
| LOANS ORIGINATED | 99 | $230,292 | 259 | $218,465 | 1,455 | $232,307 | 38 | $162,489 | 8 | $1,421,869 | 35 | $198,429 | 1 | $127,340 |
| APPLICATIONS APPROVED, NOT ACCEPTED | 8 | $252,556 | 31 | $229,824 | 145 | $245,447 | 4 | $181,452 | 1 | $207,500 | 2 | $127,555 | 0 | $0 |
| APPLICATIONS DENIED | 25 | $190,587 | 49 | $203,180 | 394 | $235,986 | 20 | $129,929 | 3 | $484,867 | 18 | $124,163 | 1 | $25,800 |
| APPLICATIONS WITHDRAWN | 6 | $203,147 | 10 | $166,219 | 170 | $239,850 | 8 | $171,432 | 0 | $0 | 3 | $151,147 | 0 | $0 |
| FILES CLOSED FOR INCOMPLETENESS | 5 | $151,778 | 8 | $169,400 | 79 | $237,129 | 2 | $67,160 | 0 | $0 | 1 | $153,190 | 0 | $0 |
Detailed mortgage data for all 16 tracts in Mount Prospect, IL
| Private Mortgage Insurance Companies Aggregated Statistics For Year 2009 (Based on 5 full and 11 partial tracts) | ||||
| A) Conventional Home Purchase Loans | B) Refinancings | |||
|---|---|---|---|---|
| Number | Average Value | Number | Average Value | |
| LOANS ORIGINATED | 57 | $252,410 | 33 | $284,935 |
| APPLICATIONS APPROVED, NOT ACCEPTED | 19 | $289,281 | 13 | $276,952 |
| APPLICATIONS DENIED | 11 | $227,264 | 6 | $292,610 |
| APPLICATIONS WITHDRAWN | 3 | $222,977 | 7 | $291,826 |
| FILES CLOSED FOR INCOMPLETENESS | 3 | $190,757 | 2 | $197,045 |
2004 - 2018 National Fire Incident Reporting System (NFIRS) incidents
- Fire incident types reported to NFIRS in Mount Prospect, IL
- 89551.2%Structure Fires
- 55531.8%Outside Fires
- 19611.2%Mobile Property/Vehicle Fires
- 1015.8%Other
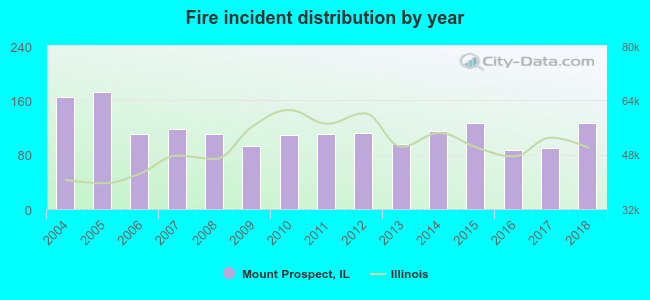 According to the data from the years 2004 - 2018 the average number of fire incidents per year is 116. The highest number of reported fire incidents - 173 took place in 2005, and the least - 87 in 2016. The data has a declining trend.
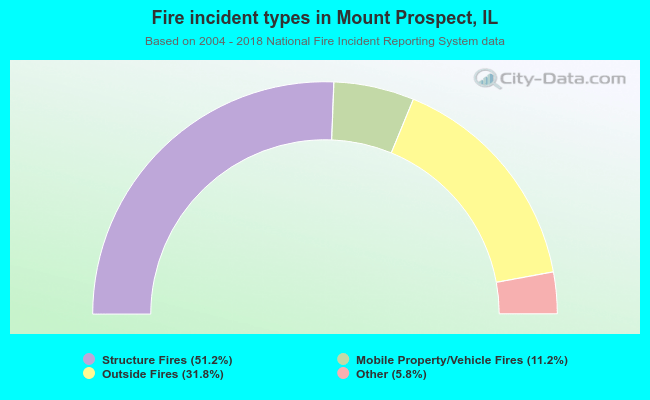 When looking into fire subcategories, the most reports belonged to: Structure Fires (51.2%), and Outside Fires (31.8%).
Fire-safe hotels and motels in Mount Prospect, Illinois:
- Holiday Inn, 200 E Rand Rd, Mount Prospect, Illinois 60056 , Phone: (847) 392-0123
- Hampton Inn & Suites Chicago / Mt Prospect, One Randhurst Village Dr, Mount Prospect, Illinois 60056 , Phone: (847) 590-1860, Fax: (847) 590-1862
| Most common first names in Mount Prospect, IL among deceased individuals | ||
| Name | Count | Lived (average) |
|---|---|---|
| John | 335 | 74.6 years |
| Mary | 274 | 80.6 years |
| William | 218 | 74.6 years |
| Robert | 203 | 70.5 years |
| Joseph | 202 | 77.2 years |
| Frank | 180 | 76.9 years |
| Helen | 171 | 80.6 years |
| James | 163 | 73.0 years |
| Edward | 161 | 74.8 years |
| Anna | 155 | 84.6 years |
| Most common last names in Mount Prospect, IL among deceased individuals | ||
| Last name | Count | Lived (average) |
|---|---|---|
| Johnson | 81 | 76.4 years |
| Anderson | 68 | 80.2 years |
| Miller | 51 | 78.8 years |
| Smith | 35 | 77.7 years |
| Peterson | 32 | 78.4 years |
| Carlson | 31 | 74.6 years |
| Nelson | 30 | 74.5 years |
| Busse | 25 | 78.9 years |
| Martin | 22 | 77.1 years |
| Mueller | 21 | 79.8 years |
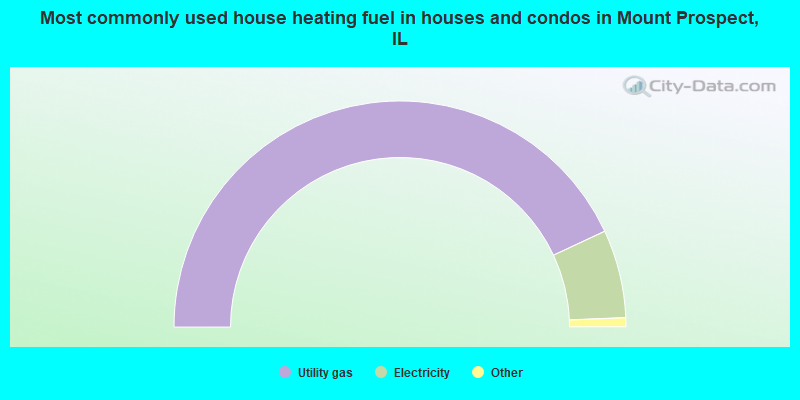
- 86.1%Utility gas
- 12.6%Electricity
- 0.7%Bottled, tank, or LP gas
- 0.2%Other fuel
- 0.2%No fuel used
- 0.1%Fuel oil, kerosene, etc.
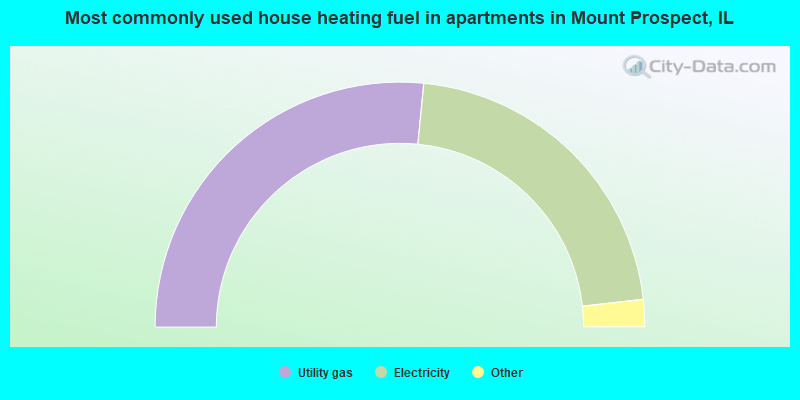
- 53.1%Utility gas
- 43.3%Electricity
- 1.6%Other fuel
- 1.5%No fuel used
- 0.5%Bottled, tank, or LP gas
Mount Prospect compared to Illinois state average:
- Median house value above state average.
- Unemployed percentage significantly below state average.
- Black race population percentage significantly below state average.
- Foreign-born population percentage above state average.
- Length of stay since moving in significantly above state average.
- Percentage of population with a bachelor's degree or higher above state average.
Mount Prospect on our top lists:
- #8 on the list of "Top 101 cities with the most full-time local library workers per 1000 residents (population 5,000+)"
- #10 on the list of "Top 100 safest cities (lowest city-data.com crime index) (pop. 50,000+)"
- #11 on the list of "Top 101 cities with the most local government spending on current operations of libraries per resident (population 10,000+)"
- #12 on the list of "Top 101 cities with the highest cost per building permit(population 50,000+)"
- #21 on the list of "Top 101 cities with the most residents born in Poland (population 500+)"
- #26 on the list of "Top 101 cities with largest percentage of females in occupations: fire fighting and prevention workers including supervisors (population 50,000+)"
- #27 on the list of "Top 101 cities with the most residents born in Eastern Europe (population 500+)"
- #34 on the list of "Top 101 cities with the lowest percentage of single-parent households, population 50,000+"
- #35 on the list of "Top 101 cities with the most residents born in Europe (population 500+)"
- #38 on the list of "Top 101 cities with largest percentage of males in industries: management of companies and enterprises (population 50,000+)"
- #39 on the list of "Top 101 cities with the most residents born in Other Eastern Asia (population 500+)"
- #40 on the list of "Top 101 cities with fewest building permits per 10,000 residents (population 50,000+)"
- #42 on the list of "Top 101 cities with largest percentage of females in industries: wholesale trade (population 50,000+)"
- #58 on the list of "Top 101 cities with largest percentage of females in occupations: health diagnosing and treating practitioners and other technical occupations (population 50,000+)"
- #61 on the list of "Top 101 cities with the smallest percentage of unmarried partner households (population 50,000+)"
- #61 on the list of "Top 101 cities with the largest percentage population decrease from 2000 (population 50,000+)"
- #62 on the list of "Top 101 cities with the least people below the poverty level (population 50,000+)"
- #62 on the list of "Top 101 cities with the coldest winters (population 50,000+)"
- #65 on the list of "Top 100 cities with declining populations from 2000 to 2014 (pop. 50,000+)"
- #76 on the list of "Top 101 cities with the largest temperature differences during a year (population 50,000+)"
- #59 (60056) on the list of "Top 101 zip codes with the largest percentage of Polish first ancestries (pop 5,000+)"
- #1 on the list of "Top 101 counties with the most Black Protestant congregations"
- #1 on the list of "Top 101 counties with the most Catholic congregations"
- #1 on the list of "Top 101 counties with the highest surface withdrawal of fresh water for public supply"
- #2 on the list of "Top 101 counties with the most Black Protestant adherents"
- #2 on the list of "Top 101 counties with the most Orthodox congregations (pop. 50,000+)"

|
|
Total of 770 patent applications in 2008-2024.